


Introduction
Chronic kidney disease (CKD) has been recognized as a leading cause of morbidity and mortality [1,2]. Nevertheless, current therapies for preventing CKD progression are still lacking [3], which is largely attributable to the absence of well-validated surrogate endpoints for renal outcomes [4]. Established endpoints for CKD progression, such as doubling of serum creatinine or end-stage renal disease (ESRD), are late events indicating substantial kidney damage. Furthermore, such studies require long-term follow-up and a large number of participants to produce reliable data. Considering these challenges, several alternative surrogate markers for CKD progression have been proposed [5]. In the 2012 scientific workshop sponsored by the National Kidney Foundation and the US Food and Drug Administration, a decline of 30% or 40% in the estimated glomerular filtration rate (eGFR) over 2 to 3 years was proposed as an acceptable alternative surrogate endpoint for clinical trials involving CKD [6]. While these newly-suggested endpoints have been utilized in some studies [7,8], experts recommend their careful application in clinical trials [6]. In particular, surrogate endpoints based on percentage changes in eGFR have been mainly validated in the CKD population and are less applicable in patients with a high baseline GFR [9]. Surrogate markers could prove more useful if they are validated in patients with early-stage CKD who have high GFRs. Therefore, different candidate surrogate endpoints such as GFR slope or changes in albuminuria have been evaluated in recent studies [9ŌĆō12]. However, the efficacy of these endpoints needs to be further validated. Moreover, differences in the efficacy of novel surrogate endpoints based on the GFR-estimating equations are not well-studied.
Currently, the Modification of Diet in Renal Disease (MDRD) and Chronic Kidney Disease-Epidemiology Collaboration (CKD-EPI) equations are widely used to estimate GFR [13,14]. The later-developed CKD-EPI equation is increasingly used due to better accuracy at GFRs of >60 mL/min/1.73 m2. However, none of these equations are optimally applicable across all GFR ranges and in different populations [15]. The eGFR decline was noninferior to the measured GFR decline in predicting renal outcomes [16]; however, the specific GFR estimation method which may improve predictive accuracy when utilizing novel surrogate endpoints is unknown. Application of different equations could lead to misclassification of CKD [17] or to variability in the calculation of GFR decline. Therefore, we aimed to evaluate the impact of GFR estimation methods on the efficacy of GFR decline or GFR slope for predicting renal outcomes in the general population.
Methods
Study design
We retrospectively enrolled 143,890 participants aged Ōēź18 years with eGFR of Ōēź15 mL/min/1.73 m2 who underwent routine health screenings between May 1995 and April 2009 at one of three university-affiliated hospitals (Seoul National University Hospital, Seoul National University Bundang Hospital, and Seoul National University Boramae Medical Center) in Korea. Clinical characteristics including age, sex, medical history, and laboratory values, were collected from the electronic medical records of each participant at each hospital. The eGFR was calculated using the modified MDRD equation (eGFRm) or the CKD-EPI 2009 equation (eGFRc) using isotope dilution mass spectrometry-traceable creatinine values [13,14]. To determine eGFR decline and slope, we defined two different baseline period groups, YR1 and YR3, which consisted of participants with available 1-year or 3-year eGFR values along with their baseline eGFR levels. The development of ESRD by December 2017 was determined using the ESRD registry of the Korean Society of Nephrology. The study was approved by the Institutional Review Board (IRB) of Seoul National University Hospital (No. B-1801/442-003). The requirement for written informed consent was waived by the IRB, and all data were fully anonymized before analysis.
Statistical analyses
Data were presented as percentages for categorical variables and as mean ┬▒ standard deviation for continuous variables. Each variable was compared using the t-test for continuous variables and the chi-square or Fisher exact test for categorical variables. Receiver operating characteristic (ROC) curve analyses were performed to examine the discriminant ability of each surrogate marker for predicting ESRD development. The Bland-Altman plot was also used to represent the agreement of eGFR percentage change and eGFR slope according to the equations used for GFR estimation. The areas under the ROC curves (AUCs) of different surrogate markers were compared using the DeLong test.
The performance of surrogate markers was also presented in a manner similar to that of diagnostic tests [18]. To evaluate overall performance, diagnostic accuracy was shown by using paired indicators such as sensitivity and specificity, positive predictive value (PPV) and negative predictive value, and positive likelihood ratio and negative likelihood ratio. In particular, likelihood ratios are useful measures from a clinical perspective and are directly linked to posttest probabilities of event occurrence [19]. Overall diagnostic accuracy and diagnostic odds ratios (DOR) were used as global measures. DORs are not dependent on disease prevalence [20] and are therefore more useful for comparing accuracy between surrogate markers for rare events. Comparisons of sensitivity and specificity achieved with different threshold values were performed using the McNemar test, and positive and negative predictive values were compared using a weighted generalized score statistic [21].
Multivariable Cox proportional hazards analysis with a restricted cubic spline of three knots was performed to examine the association of GFR decline and GFR slope with renal survival. Hazard ratios (HRs) were adjusted by age, sex, and factors related to incident ESRD including systolic blood pressure, diabetes mellitus, eGFR, uric acid, albumin, alkaline phosphatase, glucose, hemoglobin, and urine dipstick protein results. The completeness of these variables is shown in Supplementary Table 1 (available online), and listwise deletion was used in the multivariable analyses. The p-values of <0.05 were considered statistically significant. All analyses were performed using IBM SPSS version 23 (IBM Corp., Armonk, NY, USA) and R software version 3.6.1 (R Foundation for Statistical Computing, Vienna, Austria).
Results
Baseline characteristics
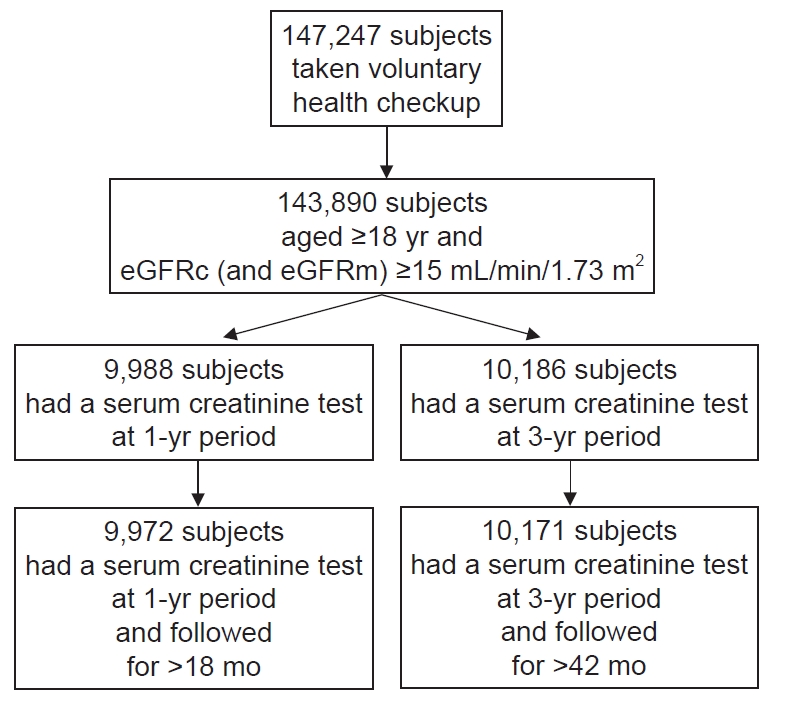
Of 143,890 subjects aged Ōēź18 years with eGFRc of Ōēź15 mL/min/1.73 m2, we finally included 9,972 and 10,171 individuals in the YR1 and YR3 groups, respectively, after excluding patients with either missing eGFRc values or inadequate follow-up data (Fig. 1). The YR1 and YR3 groups were followed for 180.1 ┬▒ 38.6 months and 178.8 ┬▒ 33.4 months, respectively. The mean age of the YR1 group was 54 years, 60.0% were male, the mean eGFRc was 95.8 mL/min/1.73 m2, and 10.6% were diabetic (Table 1). The mean age of the YR3 group was 53 years, 59.0% were male, the mean eGFRc was 95.9 mL/min/1.73 m2, and 10.4% were diabetic. In total, 1.8% and 2.3% of YR1 participants and 1.7% and 2.3% of YR3 patients had an eGFRc of <60 mL/min/1.73 m2 and an eGFRm of <60 mL/min/1.73 m2, respectively. The YR1 and YR3 groups did not differ with respect to sex, presence of diabetes, blood pressure, or laboratory values.
At baseline, eGFRc showed a greater mean value compared to eGFRm in both the YR1 (95.8 mL/min/1.73 m2 vs. 95.4 mL/min/1.73 m2) and YR3 (95.9 mL/min/1.73 m2 vs. 95.0 mL/min/1.73 m2) groups. The standard deviation and intersubject coefficient of variation (CV) were greater for eGFRm, as these values were more wildly distributed across the range of eGFR than eGFRc values were (Supplementary Table 2, available online). The Bland-Altman plot showed how differences between eGFRc and eGFR in both the YR1 and YR3 groups were prominent at high GFR levels (Ōēź90 mL/min/1.73 m2) (Supplementary Fig. 1, available online). During the baseline period, percentage changes in eGFR differed between eGFRc and eGFRm in YR1, but not in YR3 (Supplementary Table 2). Likewise, while the eGFRc slope was steeper than the eGFRm slope in YR1, this difference in inclination was not observed in YR3. The CV for percentage change in eGFR and for the eGFR slope was much greater for eGFRm compared to eGFRc in both the YR1 and YR3 groups. The Bland-Altman plot showed that the larger the absolute value of eGFR percentage change and eGFR slope, the larger the difference between eGFRc and eGFRm. In particular, subjects with high eGFRs showed greater differences in eGFR percentage change and eGFR slope between the CKD-EPI and MDRD equations.
Prediction accuracy for ESRD according to surrogate markers
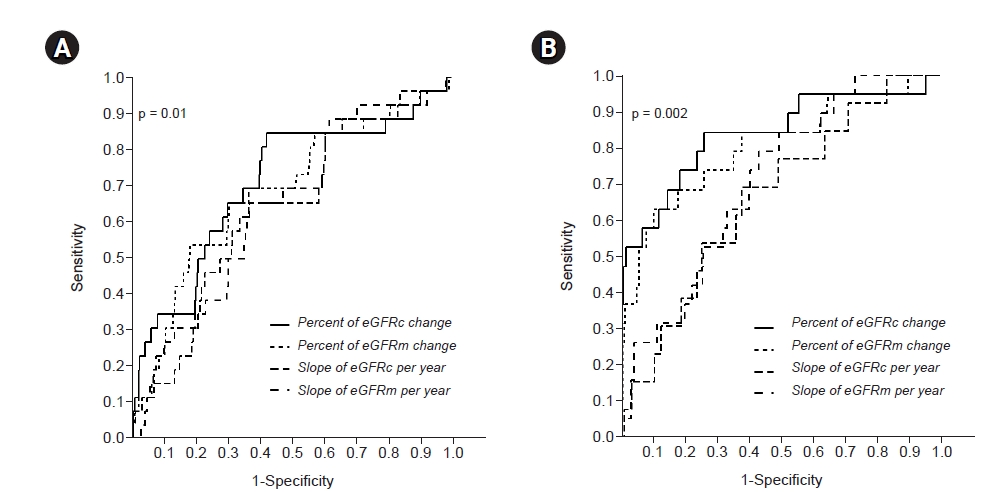
During the follow-up period, the rate of ESRD incidence was 0.26% and 0.19% in the YR1 and YR3 groups, respectively. Surrogate markers showed better discrimination for ESRD development in the YR3 group compared to the YR1 group (Table 2). ROC analysis showed that ESRD prediction accuracy was significantly greater when using percentage change in eGFR compared to eGFR slope (Fig. 2, Table 2). Among the studied surrogate markers, the percentage change in eGFRc in YR3 showed the highest AUC (0.837), while eGFRc slope in YR1 showed the lowest AUC (0.632). AUCs for percentage changes in eGFRc and eGFRm, and those for yearly slopes for eGFRc and eGFRm values, did not differ in either the YR1 or YR3 groups (Table 2). When diagnostic indicators were evaluated based on percentage changes in eGFR and the estimating equations, changes of Ōēź30% in eGFRc and eGFRm showed an acceptable specificity of >90% and a high DOR (Table 3). Although the PPV of each endpoint was relatively small due to the low incidence of ESRD, application of a higher threshold yielded a greater PPV. Overall, the diagnostic indices according to the two equations revealed similar patterns. However, the eGFRc criteria had higher DOR, specificity, and PPV than the eGFRm criteria at all eGFR thresholds in both the YR1 and YR3 groups (Table 3). In particular, the PPV and specificity of a 30% or 40% decline in eGFR were statistically different based on the GFR-estimating equation used (Supplementary Table 3, available online). The PPV associated with a 40% decline in eGFR was not statistically different compared to conventional endpoints (57% eGFRc or 55% eGFRm decline) in YR3, but not for a 30% decline or less. Subgroup analyses showed that 30% and 40% declines in eGFR showed higher DORs in patients with age of <65 years and proteinuria grade >1+. The eGFRc values demonstrated a better DOR than eGFRm values in patients aged <65 years and in those with eGFR of Ōēź60 mL/min/1.73 m2 (Supplementary Table 4, 5; available online).
Associations between changes in eGFR and ESRD risk
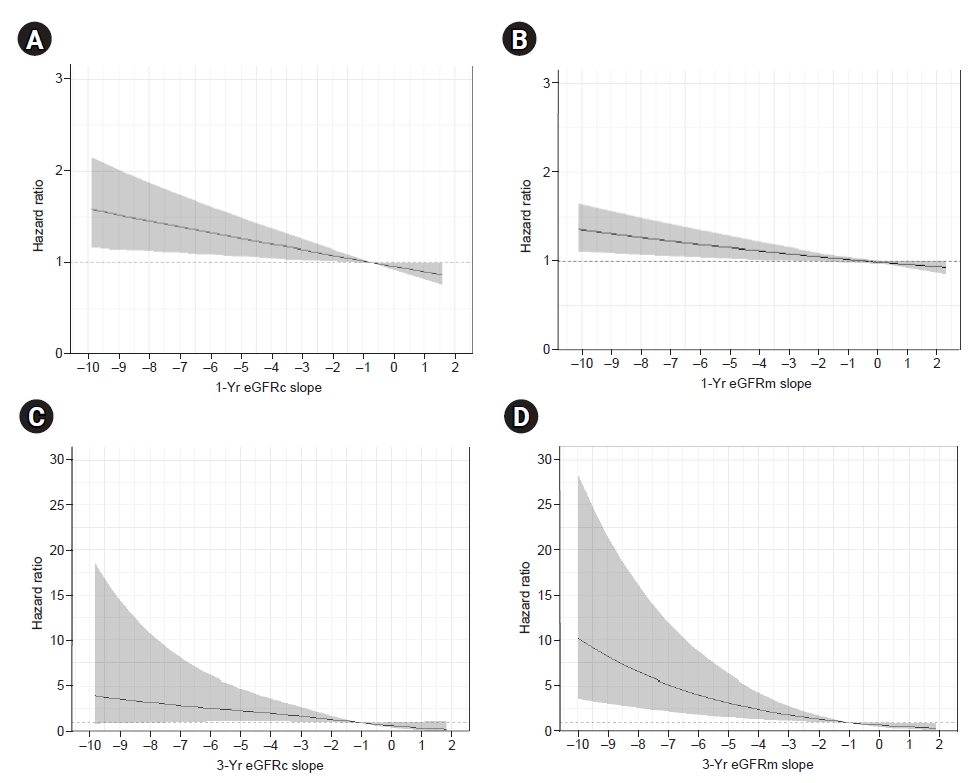
In the restricted cubic spline model, percentage decline in eGFR was not significantly associated with the risk for ESRD in YR1 (Fig. 3). However, in YR3, a greater percentage decline in eGFR was significantly associated with a higher risk for developing ESRD at all ranges. These associations between changes in eGFR and HR were comparable using eGFRc and eGFRm. A negative eGFR slope was associated with a modest increase in the adjusted HR for ESRD in YR1 (Fig. 4), while this correlation with eGFR slope was stronger in YR3. While eGFRm slope had a higher estimated HR than eGFRc, the former demonstrated a wider confidence interval.
In subgroup analyses stratified by age, sex, presence of diabetes, eGFR, and presence of proteinuria, adjusted HRs for percentage change in eGFR for each criterion were not significant in YR1, except for eGFR of Ōēź60 mL/min/1.73 m2 (Supplementary Table 6, available online). Meanwhile, percentage changes in eGFR in YR3 were associated with significantly higher HRs for each subgroup, especially in young patients and those with proteinuria. Overall, estimated HRs based on eGFRc or eGFRm were similar, though HRs estimated using eGFRc were 2 to 3 times greater than those derived using eGFRm in patients with eGFR of Ōēź60 mL/min/1.73 m2.
Discussion
In this study, we evaluated the predictive accuracy of several novel surrogate markers for ESRD, including eGFR percentage change and eGFR slope over 1- and 3-year baseline periods in the general population, using different estimating equations. Our findings showed that a 30% or 40% decline in eGFR may be a more accurate surrogate endpoint than the eGFR slope when predicting renal outcome. We also showed that these values are more predictive over a baseline period of 3 years compared to 1 year. Percentage changes in eGFRc showed higher specificity and PPV compared to those in eGFRm and were more likely to be associated with the development of ESRD in patients with eGFR of Ōēź60 mL/min/1.73 m2. Nevertheless, there were no significant differences in discriminative ability (AUC) or adjusted HRs between eGFRc and eGFRm for predicting ESRD risk.
Recent studies have provided evidence in favor of using alternative surrogate endpoints such as eGFR percentage decline and eGFR slope for predicting renal outcomes [10ŌĆō12,22,23]. Indeed, an ongoing randomized trial to evaluate the effect of sodium-glucose cotransporter-2 inhibitors on renal outcomes set eGFR decline of Ōēź40% as one of the primary endpoints [24]. Nevertheless, novel surrogate endpoints have not been well validated in the general population. Overall, our findings are similar to those of previous studies in the CKD population showing that eGFR changes over 1 year were insufficient to predict renal outcomes. Researchers have recommended the use of surrogate markers over 2 to 3 years [6]. Furthermore, a 40% decline in eGFR is more acceptable than a 30% decline [25], which was also consistent with our results. We found that a 40% decline in eGFR over 3 years was the most reliable candidate surrogate endpoint in this study. Since our study was based on the Korean population, our findings highlight the significance of these early surrogate markers in Asian populations. While the eGFR slope showed moderate predictive accuracy as well, it was lower than that achieved with percentage change in eGFR and was a comparatively weaker surrogate marker. These findings may be related to characteristics of eGFR slope such as greater variability in eGFR at higher levels, nonlinear trajectories, and nonuniform distributions [26].
These early-identifiable markers are important, as conventional endpoints such as creatinine doubling or ESRD require much longer follow-up periods in the general population. The application of these surrogate endpoints can enable early detection and management of CKD progression. However, there are some considerations regarding surrogate markers of eGFR change in patients with high baseline GFR levels. The MDRD and CKD-EPI equations are most commonly used to assess kidney function in medical research and clinical practice. Clinically meaningful differences between the two equations are mainly seen when GFR levels are high [27]. The CKD-EPI equation shows greater accuracy than the MDRD equation when estimating GFR in individuals with normal kidney function [14]. Thus, using the CKD-EPI equation can decrease the chances of misclassifying patients at low risk of ESRD [28]. Since misclassification of at-risk patients affects the efficacy of surrogate endpoints, it is clinically important to assess their accuracy based on the equation used for GFR estimation. Our findings demonstrated that both the CKD-EPI and MDRD equations were acceptable at estimating the risk for ESRD in the general population based on the results of the ROC and Cox proportional hazards analyses. These results support the application of both equations for predicting renal outcome and alleviate concerns about the use of the MDRD equation in utilizing novel surrogate endpoints.
However, we found that the CKD-EPI equation was better with respect to some diagnostic indices such as specificity, DOR, and PPV, representing more accurate prediction for true endpoint. Our findings can be attributed to (1) less bias in estimating GFR and (2) lower within-subject variability of CKD-EPI equation in patients with high GFR [14,29]. As shown in our Bland-Altman plot analysis (Supplementary Fig. 1), the differences between eGFRc and eGFRm increased at higher GFRs, and greater differences in both eGFR percentage change and slope were observed mainly in patients with higher GFRs. These findings suggest that the greater bias associated with the MDRD equation could affect its predictive accuracy. In addition, our results may be indicative of the high within-subject variability of the MDRD equation. Within-subject variability was usually higher at higher GFRs and was significantly higher in the application of the MDRD equation compared to the CKD-EPI equation [29]. Changes in eGFR between two time points may be partly affected by this within-subject variability.
There are certain limitations in this study. The number of enrolled patients was relatively small, and the rate of incidence of ESRD was low due to the characteristics of the studied population. Surrogate markers based on changes in eGFR were assessed using serum creatinine measurements merely at the beginning and the end of the defined baseline period. Therefore, GFR variability and acute treatment effects during the baseline period were not considered. In addition, several unmeasured confounders could be present, considering the observational nature of the study. Nevertheless, our study rigorously analyzed the differences in different novel surrogate endpoints with respect to the equations used for estimating eGFR, which allowed us to provide detailed implications. To the best of our knowledge, the impact of GFR-estimating equations on the efficacy of novel surrogate markers for predicting renal outcomes has not been evaluated previously.
In conclusion, there were no significant differences in estimated ESRD risk using the GFR percentage change or eGFR slope between the CKD-EPI equation and the modified MDRD equation in the general population. Surrogate markers using the CKD-EPI equation may be slightly more accurate in patients with high GFRs.

 PDF Links
 PubReader
 ePub Link
 Full text via DOI
 Download Citation
 Supplement 1
 Print
Print


")


