Diagnostic accuracy of urine dipstick for proteinuria in older outpatients
Article information
Abstract
Background
The urine dipstick is widely used as an initial screening tool for the evaluation of proteinuria; however, its diagnostic accuracy has not yet been sufficiently evaluated. Therefore, we evaluated its diagnostic accuracy using spot urine albumin/creatinine ratio (ACR) and total protein/creatinine ratio (PCR) in proteinuria.
Methods
Using PCR ≥0.2 g/g or ≥0.5 g/g and ACR ≥300 mg/g or ≥30 mg/g as the reference standard, we calculated the diagnostic accuracy profile: sensitivity, specificity, positive and negative predictive value, and the area under the curve (AUC) of the receiver operating characteristic curve.
Results
PCR and ACR were available for 10,348 and 3,873 instances of dipstick testing. The proportions with PCR ≥0.2 g/g, ≥0.5 g/g and ACR ≥300 mg/g, ≥30 mg/g were 38.2%, 24.6% and 8.9%, 31.7%, respectively. The AUCs for PCR ≥0.2 g/g, ≥0.5 g/g, and ACR ≥300 mg/g were 0.935 (trace: closest to ideal point), 0.968 (1+), and 0.983 (1+), respectively. Both sensitivity and specificity were >80% except for PCR ≥0.5 g/g with trace cutoff. For the reference standard of ACR ≥30 mg/g, the AUC was 0.797 (trace) and the sensitivity was 63.5%.
Conclusion
Urine dipstick test can be used for screening in older outpatients with ACR ≥300 mg/g or PCR as the reference standard for proteinuria. However, we cannot recommend the test as a screening tool with ACR ≥30 mg/g as the reference owing to its low sensitivity.
Introduction
The prevalence of chronic kidney disease (CKD) is rapidly increasing worldwide, influencing public health by causing increasing risk of end-stage renal disease and broadening the range of complications including cardiovascular diseases [1]. Proteinuria is a cardinal manifestation of CKD. Its significance as an independent risk factor for end-stage renal disease and cardiovascular disease has long been recognized, and is emphasized by several large cohort studies showing the prognostic value of even low-grade proteinuria [2], [3], [4], [5], [6], [7]. However, proteinuria is usually silent and can be detected through medical screening.
Currently, the most accurate test for proteinuria is quantification using timed (usually 24 hours) urine collection [8]. However, this method is not only extremely cumbersome, the precision of urine collection is also questionable. Therefore, current clinical practice guidelines recommend “spot urine total protein or albumin” corrected for urine creatinine as the optimal method for the evaluation of proteinuria or albuminuria [8], [9]. Recent research has focused on the outcome of albuminuria, a more sensitive marker of CKD attributable to diabetes, hypertension, and glomerular disease than total protein/creatinine ratio (PCR) [8]. However, quantifying albuminuria by spot urine albumin/creatinine ratio (ACR) is time-consuming and expensive.
The urine dipstick test is widely used as an initial screening tool for detecting proteinuria because of its low cost, wide availability, and ability to provide rapid information to clinicians and patients. The urine dipstick, however, has not been sufficiently evaluated for diagnostic accuracy. There have been a few studies concerning the diagnostic accuracy of urine dipstick for proteinuria in outpatients; however, most of these studies have been conducted on the general population. In addition, current clinical practice guidelines differ in their recommendations regarding the clinical utility of the dipstick for detecting proteinuria. We evaluated the diagnostic accuracy of urine dipsticks for proteinuria in outpatients at a single center using ACR and PCR as reference standards.
Methods
We collected data on urine dipstick, spot urine total protein, spot urine albumin, urine creatinine, and serum creatinine in patients who visited our center between January 1, 2012 and July 31, 2013. In the PCR group, urine dipstick (Clinitek Atlas 10 Reagent Pak; Siemens, Tarrytown, NY, USA), spot urine total protein (200 FR Neo, SICDIA M-TP Kit; Toshiba, Tokyo, Japan), spot urine creatinine (Modular P/Modular D analysis, Jaffe kinetic colorimetric assay; Roche, Indianapolis, IN, USA) were all available, and the PCR (g/g) was calculated. In instances where the urine albumin (Nephelometer BN-II, N antiserum to human albumin; Siemens) was available, urine ACR (mg/g) was calculated (ACR group).
As a reference standard to evaluate the accuracy of urine dipstick for proteinuria, we used four different criteria: PCR ≥0.2 g/g or ≥0.5 g/g and ACR ≥300 mg/g or ≥30 mg/g. We calculated the sensitivity, specificity, positive predictive value (PPV), and negative predictive value (NPV) of urine dipstick analysis for proteinuria using two cutoff values (trace or more, 1+ or more), and compared the area under the curve (AUC) of the receiver operating characteristic (ROC) curve. This study was approved by the Institutional Review Board of Veterans Health Service Medical Center.
We used Chi-square test for categorical variables. Data are expressed as mean±standard deviation. All statistical analyses including the ROC curve were performed using STATA release 12 (StataCorp LP, College Station, TX, USA). A significant difference was defined as P<0.05
Results
PCR group
A total of 10,348 urine dipstick tests were conducted in 6,801 patients, and the PCR value was calculated. Of this total, 9,323 tests (90.0%) were performed in males. The average patient age was 68.2±8.6 years, and 92.9% of the patients were older than 60 years. A negative dipstick result was obtained in 57.4% of tests and trace positive in 9.3%, 1+ in 10.6%, 2+ in 13.3%, and 3+ in 9.5%. In 38.2% of tests, PCR was ≥0.2 g/g. Six percent of patients with a negative dipstick result had a PCR ≥0.2 g/g, 41.9% of those with trace, 78.2% of those with 1+, and virtually 100% of those with either 2+ or 3+. A PCR ≥0.5 g/g was observed in 24.6% of all patients. The proportion of PCR ≥0.5 g/g was 0.6% for those with negative dipstick result, 8% for those with trace, 30% of those with 1+, 81.4% of those with 2+, and 100% of those with 3+ (Table 1).

Demographic data and clinical characteristics by urine dipstick result
When we set PCR ≥0.2 g/g as the reference standard for proteinuria, the AUC of the ROC curve was 0.935 [95% confidence interval (CI), 0.930–0.940], and the trace result was the closest to the ideal test point (Fig. 1). When trace or greater was set as the positive urine dipstick, we derived the result of 90.9% sensitivity, 87.2% specificity, and 81.5% PPV. If we set the cutoff value for the dipstick result as 1+ or greater, the sensitivity decreased to 80.7%, the specificity increased to 95.9%, and the PPV increased to 92.5% (Table 2).

The ROC curve of the urine dipstick for proteinuria is derived using PCR. PCR values of (A) ≥0.2 g/g and (B) ≥0.5 g/g are used as standard reference, yielding AUCs of 0.935 (95% CI, 0.930–0.940) and 0.968 (95% CI, 0.964–0.971), respectively. AUC, area under the curve; CI, confidence interval; PCR, protein/creatinine ratio; ROC, receiver operating characteristic; tr, trace.

Comparison of diagnostic performance of urine dipstick test for proteinuria
When PCR ≥0.5 g/g was set as the reference standard, the AUC of the ROC curve was 0.968 (95% CI, 0.964–0.971), and the 1+ cutoff was closest to the ideal test point (Fig. 1). When trace or more was set as a positive dipstick result, we obtained 98.6% sensitivity, 75.6% specificity, and 56.8% PPV. If we set the cutoff value for the dipstick result to 1+ or greater, the results are as follows: sensitivity, 95.6%; specificity, 86.9%; PPV, 70.4% (Table 2).
ACR group
The ACR was calculated for a total of 3,873 urine dipstick tests (3,685 patients). Of the patients, 94.1% were males. Their mean age was 67.7±6.2 years, and 95.3% were older than 60 years old. The dipstick result was negative in 75.3%, trace in 9.1%, 1+ in 7.1%, 2+ in 5.5%, and 3+ in 2.9%. Overall, 8.9% had an ACR ≥300 mg/g: 0.03% of those with a negative dipstick result, 4.0% of those with trace, 18.8% of those with 1+, 77.1% of those with 2+, and 99.1% of those with 3+. An ACR of ≥30 mg/g was observed in 31.7% of all tests: 15.4% of those with a negative dipstick result, 61% of those with trace, 89.1% of those with 1+, 98.6% of those with 2+, and 99.1% of those with 3+ (Table 1).
When ACR ≥300 mg/g was set as the reference standard for proteinuria, the AUC of the ROC curve was 0.983 (95% CI, 0.978–0.987), and 1+ was closest to the ideal test point (Fig. 2). For trace or above as a positive dipstick result, the sensitivity was 99.7%, the specificity 82.6, the PPV 35.8%, and the NPV 100%. A cutoff value of 1+ for dipstick yielded 95.7% sensitivity, 92.2% specificity, 54.5% PPV, and 99.5% NPV, respectively (Table 2).
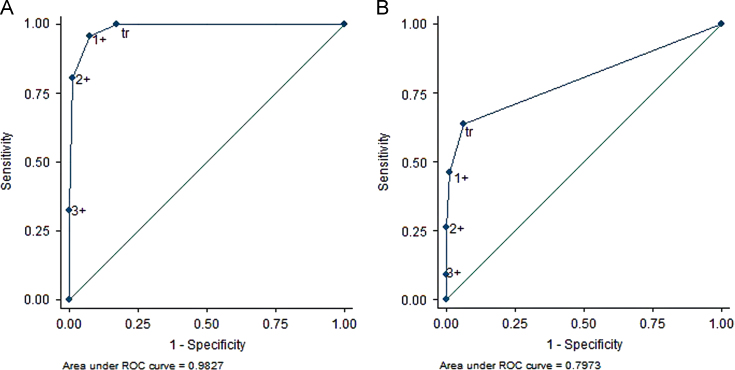
The ROC curve of the urine dipstick for proteinuria is derived using ACR. ACR values of (A) ≥300 mg/g and (B) ≥30 mg/g (B) are used as standard reference, yielding AUCs of 0.983 (95% CI, 0.978–0.987) and 0.797 (95% CI, 0.783–0.812), respectively. ACR, albumin/creatinine ratio; AUC, area under the curve; CI, confidence interval; ROC, receiver operating characteristic; tr, trace.
If ACR ≥30 mg/g was set as the reference standard, the AUC of the ROC curve was 0.797 (95% CI, 0.783–0.812), and trace was the closest to the ideal test point (Fig. 2). For trace or more as the dipstick cutoff, the sensitivity was 63.5%, specificity 93.5%, and PPV 82.0%. For 1+ dipstick cutoff value, the sensitivity was 46.0%, specificity 98.7%, and PPV 94.3% (Table 2).
Discussion
The main purpose of our study was to explore the accuracy of urine dipstick testing for detection of proteinuria in older outpatients in the era of epidemic CKD. Although there are several studies available that are related to this subject, these are general population-based studies [10], [11]. In our study, the study population consisted of outpatients, and more than 90% of them were older than 60 years. Consequently, our study showed a higher prevalence of proteinuria compared with that of the general population (<10%) [10], [11], [12], [13], [14].
PCR and ACR were suggested in the 2002 Kidney Disease Outcomes Quality Initiative guideline as the standard measures of proteinuria, and PCR ≥0.2 g/g was used as the standard cutoff for proteinuria [9]. However, after albumin was demonstrated to have a better correlation with the prognosis of CKD than did total protein, the ACR was recommended as the reference standard for proteinuria [8]. An ACR of ≥300 mg/g has been used as the cutoff value; however, ACR ≥30 mg/g is more frequently used when proteinuria of 30–300 mg/g (i.e., microalbuminuria) is known to be related to the patient’s prognosis. Therefore, we used various reference standards: ACR ≥30 mg/g or ≥300 mg/g, and PCR ≥0.2 g/g or ≥ 0.5 g/g (a PCR equivalent to ACR 300 mg/g).
The AUCs of the ROC curve were much higher than 0.9 with PCR ≥0.5 g/g, ≥0.2 g/g or ACR ≥300 mg/g as the reference standard, and urine dipstick tests can provide excellent accuracy. When 1+ was used as the dipstick cutoff value, the sensitivity was >95%, and the specificity was 86.9% and 92.2%, respectively. Notably, the NPV was close to 100%, and the PPV was 70.4% or 54.5%, respectively. This implies that if we use PCR ≥0.2 g/g or ACR ≥300 mg/g as the reference standard for proteinuria, the urine dipstick with trace or 1+ cutoff value can be recommended for initial testing in the outpatient clinic.
When ACR ≥30 mg/g was set as the reference standard, which is the current trend, the AUC of the ROC curve was 0.797, and the sensitivity decreased to 63.5% (trace cutoff value), 46% (1+ cutoff value). In this setting, the low sensitivity made it troublesome to use dipstick test as a screening tool despite a moderate overall accuracy.
In a general population-based study, the accuracy of urine dipstick for diagnosis of proteinuria was relatively low [11]. When ACR ≥30 mg/g was set as the reference standard for proteinuria, the sensitivity and specificity were 37.1% and 97.3% (cutoff: trace) and 23.3% and 98.9% (cutoff: 1+). The low accuracy could be explained by the fact that this study was conducted in the general population rather than in outpatients, resulting in the low prevalence of proteinuria.
In an Australian study, which showed a higher prevalence of proteinuria, when ACR ≥30 mg/g was set as the reference standard for proteinuria, the AUC of the ROC curve was 0.8451±0.0129 in men and 0.7775±0.0131 in women. These data are not significantly different from our result of 0.797 (95% CI, 0.783–0.812), which did not differentiate the patients by sex. When 1+ was set as the cutoff value for dipstick, the sensitivity was 57.8%, specificity 95.4%, and PPV 47.2%. This result is comparable with our results. The higher PPV in our study could be explained by the higher prevalence of proteinuria. If ACR ≥300 mg/g was set as the reference standard, there is no significant difference from our results in terms of accuracy, except for the PPV. Our finding that there is a significant trend of decreasing estimated glomerular filtration rate (eGFR) as the dipstick changes from negative through 3+ was similar to the findings of other studies [10], [11].
In this study, we could not collect data about underlying diseases such as type 2 diabetes mellitus, hypertension and cardiovascular diseases, smoking, body mass index, and medications. If these data are available, a more extensive analysis could be possible, and we could evaluate the accuracy of urine dipstick testing under more specific circumstances. In addition, the fact that >90% of the patients in our study were males, because of the distinctive character of our center, must be considered carefully when this study is used as a reference.
In conclusion, if we intend to set ACR ≥300 mg/g or PCR as the reference standard for proteinuria, urine dipstick testing can be recommended for screening in older outpatients. However, it would be inappropriate to use dipstick tests without direct ACR test as a screening tool for proteinuria if we set ACR ≥30 mg/g as the reference standard.
Conflict of interest
The authors report no conflict of interest. The authors alone are responsible for the content and writing of this article.