


Introduction
Metabolic syndrome (MetS) and its components are important risk factors for cardiovascular disease and diabetes mellitus [1-5]. These MetS-related diseases have a large burden on society. Therefore, screening for and managing MetS are of utmost importance [6-8]. With the aging population and the increasing prevalence of obesity globally, both of which are closely associated with MetS development, the importance of MetS treatment becomes even more significant [9-11].
A significant association between MetS and chronic kidney disease (CKD), another global health problem, is present [12]. Diabetes mellitus and hypertension are the most common etiologies of CKD, both of which are also components of MetS. Therefore, there is increased risk of consequent CKD when MetS is present [13-15]. MetS itself, independent of its individual components, may also be an important predictor of CKD [12,15,16]. However, it remains unclear whether recovery from preexisting MetS is related to decreased risk of CKD. This dynamic relationship has been rarely demonstrated in large-scale cohorts, although some studies have suggested its possibility [17]. The guidelines in treatment of CKD, however, recommend focusing on management of its metabolic risk factors [18-23]. In addition, a nationwide study comparing the incidence of CKD according to changes in individual components of MetS is needed in order to establish a health policy that targets the globally increasing burden of CKD-related health issues [24,25]. However, such national data, including repetitive evaluations of peopleŌĆÖs MetS and kidney function, are rare.
In this study, we asked whether recovery from preexisting MetS lessens the risk of CKD. Simultaneously, we sought to provide evidence for public metabolic risk management for CKD prevention by studying the association between CKD risk increments and the development of MetS. We reviewed more than 6 million people in a national health screening program to understand the relationship between MetS and CKD.
Methods
Ethical approval
The study was conducted in accordance with the Declaration of Helsinki. The Institutional Review Board (IRB) of Seoul National University Hospital (IRB no. E-1801-027-913) approved this study. The National Health Insurance Service (NHIS) approved the use of the NHID (no. NHIS-2017-1-346). Informed consent was waived because anonymous data were provided by the NHIS.
Data resources
The study setting was described in our previous study [17]. The National Health Insurance Database (NHID) is a public data resource provided by the National Health Insurance System (NHIS) of the Republic of Korea [26]. It includes national health screening results, socio-demographic variables, and claims. National health screening programs are provided by NHIS. The details of the examinations have been previously described [27]. In brief, this free health screening is provided biennially for office workers/non-workplace subscribers, and annually for non-office workers. Dependent subscribers older than 40 years can also receive the exam biennially. Approximately 15 million people are the target population for the health screening every year. The total examination rate has remained consistently > 70% since 2011. All of the parameters that are included in MetS, including serum creatinine and urinalysis albumin values, are measured at every national health screening.
Extracted data from the NHID
The following health information was collected from the examinations: date, age, sex, waist circumference, body mass index (BMI), systolic/diastolic blood pressure, fasting glucose, serum triglycerides (Tg), high-density lipoprotein (HDL) cholesterol, serum creatinine (by the JaffeŌĆÖs kinetic methods), baseline urine albumin (by dipstick method), hemoglobin, alanine aminotransferase (ALT), and aspartate aminotransferase (AST). Other information regarding comorbidities was reviewed in the claims database. The Charlson comorbidity index (CCI) score was calculated to represent the comorbidity burden by reviewing the applied International Classification of Diseases, 10th Revision diagnostic codes [28]. An individual was considered to have a comorbidity when the respective diagnostic codes were present more than two times before the inclusion date within one year. The income status was determined by the required insurance fee. People in the lowest quartile of the fee or with free insurance were considered to have low-income status.
Study population
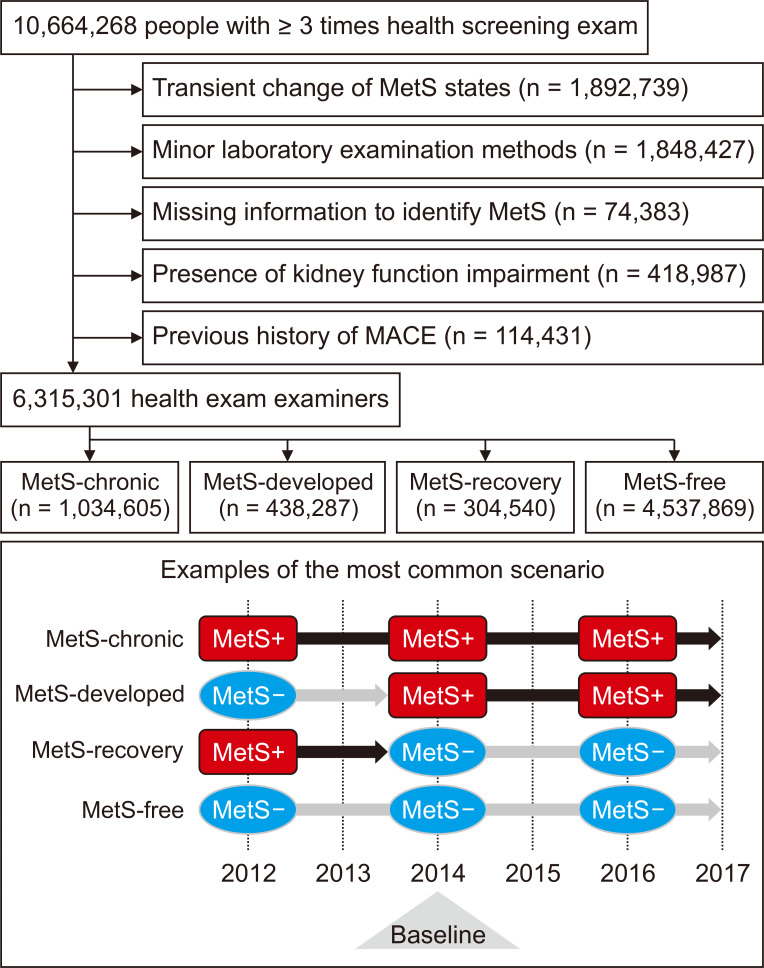
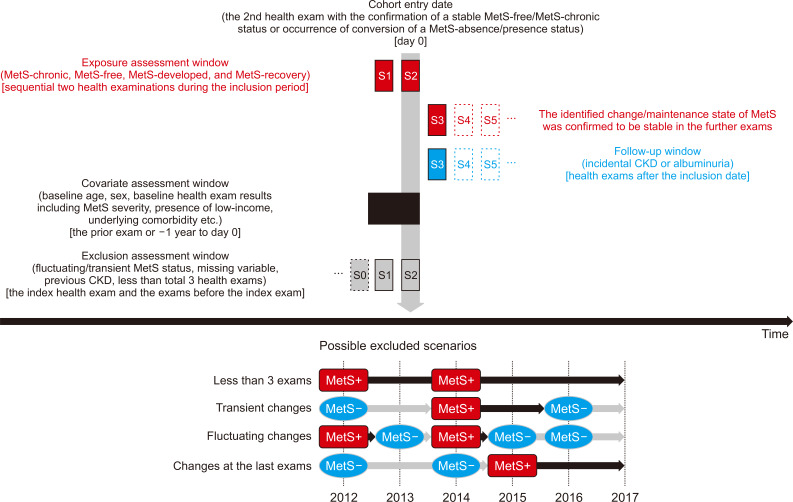
National health screening examinations conducted between 2012 and 2016 were included in the study. We included individuals who underwent health examinations Ōēź 3 times during the period, as we intended to identify dynamic, but not transient, changes in MetS status (Fig. 1). The graphical description of the time windows to define study population, collect variables, and identify outcomes is shown in Fig. 2. The exclusion criteria were people with: 1) missing information regarding MetS status; 2) a previous history of overt CKD [identified by baseline estimated glomerular filtration rate (eGFR) calculated by the Modification of Diet in Renal Disease (MDRD) equation < 60 mL/min/1.73 m2, presence of CKD related diagnostic codes or a history of renal replacement therapy in the claims database]; 3) a history of significant cardio/cerebro-vascular events, including myocardial infarction, coronary revascularization and acute ischemic stroke; 4) health screenings with other methods than the JaffeŌĆÖs kinetic method for serum creatinine measurement; and 5) people with changes in MetS status on the last exam (and those with transient/fluctuating changes) who had no follow-up were excluded because the persistence of the change was not certain.
Definition of MetS
At each health screening, the MetS statuses were identified using the widely used harmonizing criteria that were published by Alberti et al [29]. Briefly, the presence of MetS was determined when Ōēź 3 of the 5 following components of MetS were present: elevated waist circumference (Ōēź 90 cm for male, Ōēź 80 cm for female in Asians), elevated Tg (Ōēź 150 mg/dL) or use of relevant medications, reduced HDL cholesterol (< 40 mg/dL for male, 50 mg/dL for female) or use of relevant medications, high blood pressure (systolic Ōēź 130 and/or diastolic Ōēź 80 mmHg), and elevated fasting glucose (Ōēź 100 mg/dL) or use of relevant medications. This definition may include those who had different severities of MetS (regarding the number of MetS components, or the degree of the parameters). Such severities were further adjusted in the analysis described below.
Study groups according to dynamic MetS statuses
We defined four study groups to reflect the examineesŌĆÖ dynamic MetS statuses. The most common scenario is shown in Fig. 1. The ŌĆ£MetS-free groupŌĆØ consisted of those who did not have MetS during the entire study period. The ŌĆ£MetS-chronic groupŌĆØ included those who had MetS identified at every health screening. The ŌĆ£MetS-developed groupŌĆØ consisted of those who developed MetS during the health screenings that was not present earlier and was persistent until the last health screening. The ŌĆ£MetS-recovery groupŌĆØ included examinees who had MetS that recovered by the time of the last health screening.
In the MetS-developed and MetS-recovery groups, the inclusion date was that when MetS developed or recovered. On the other hand, the inclusion date in the MetS-free and MetS-chronic groups was the second examination date. Many study subjects underwent a total of three health screenings biennially. Therefore, the above definitions secured a similar follow-up duration among the study groups, and the persistence of their MetS statuses for at least one more health exam until the last one.
Study outcomes
The primary outcome was incidental CKD that was identified during the health examinations after the inclusion date. Incidental CKD was defined by an eGFR < 60 mL/min/1.73 m2 at the follow-up health examination. The eGFR values were calculated using the MDRD equation. Incidental CKD was not considered to have occurred when the outcome was identified transiently, or was not present at the final examination. The secondary outcome was the presence of albuminuria during the follow-up period. Similar to the CKD outcome, transient albuminuria was not considered an outcome event.
Intergroup analysis reflecting the severity of MetS
After demonstrating the risk of study outcomes with the MetS-free group as a reference group, we performed an additional intergroup analysis (similar to that in our previous study) [17].
First, we compared people with the same previous MetS presence/absence state (e.g., MetS-free vs. MetS-developed and MetS-chronic vs. MetS-recovery group) to show the possible benefits and adverse outcomes associated with a change in oneŌĆÖs baseline MetS status. People with mild metabolic profiles were more likely to attain or maintain a MetS-free status. Therefore, the previous MetS severity was additionally adjusted in these cases. The MetS severity was determined by the following two methods: the number of present MetS components, and the actually measured MetS parameters [15].
Next, we investigated whether prior history of MetS was associated with different CKD risk. Therefore, people with the same MetS presence/absence state during the follow-up period but an opposite history of MetS before inclusion were compared (e.g., MetS-free vs. MetS-recovery and MetS-chronic vs. MetS-developed group). In this analysis, the MetS severity at the inclusion examination was additionally adjusted, as the baseline MetS severity itself could be an essential confounder for oneŌĆÖs prognosis.
Analysis regarding each MetS component
Additional analysis was conducted with MetS-free/developed groups and MetS-chronic/recovery groups to determine which MetS components are most important with regard to CKD risk. In this analysis, we compared the adverse outcome risk of people with the reversal or development of the MetS component in the group was compared to that of those with maintained stable MetS states and the according criteria. In defining the study subgroups, we only considered the alteration or maintenance of the component that persisted until the last health examination.
Statistical analysis
Categorical variables are presented as numbers (percentages). Continuous variables are reported as means (┬▒ standard deviations). Logistic regression analysis was used to investigate the significance of the associations between the studied groups and CKD risk. The baseline multivariable model included the following variables (as recorded at the time of study inclusion): age, sex, low-income status, CCI, BMI, baseline laboratory parameters (including eGFR, AST/ALT, hemoglobin), and the presence of dipstick albuminuria. The severity of MetS was determined by the number and actual values of the MetS components. These components were additionally adjusted when comparisons were made between the subgroups and the presence/absence of MetS before and after the inclusion. SAS software version 9.4 (SAS Institute Inc., Cary, NC, USA) was used for the above statistical analyses. Statistical significance was determined using two-tailed P values < 0.05.
Results
Study population
We identified 10,664,268 health examinees who underwent Ōēź 3 national health screenings in the NHID. After excluding those with transient MetS status, overt kidney function impairment (eGFR < 60 mL/min/1.73 m2), or previous major coronary vascular events, 6,315,301 individuals were included. The included number of examinees and the median follow-up duration of each study group were as follows: 4,537,869 for the MetS-free group with 2.64 (2.12-3.30) years; 1,034,605 for the MetS-chronic group with 2.58 (2.13-3.09) years; 438,287 for the MetS-developed group with 2.35 (2.01-2.84) years; and 304,540 for the MetS-recovery group with 2.46 (2.05-3.09) years of follow-up duration.
Baseline characteristics
There were significant differences identified according to the examineesŌĆÖ dynamic MetS statuses (Table 1). The overall differences were most prominent between the MetS-chronic group and the MetS-free group. The MetS-chronic group was the oldest (on average) among all groups, while the MetS-free group was the youngest. The MetS-recovery group included the largest proportion of male examinees. The MetS-developed group and the MetS-recovery group had relatively similar baseline values. However, there was a notable difference between these two groups with regard to BMI. With regard to the MetS component parameters, the MetS-free and MetS-recovery groups evidently had better characteristics than did those with MetS during the follow-up period. However, the MetS-recovery group still had worse MetS parameters than did the MetS-free group.
Incidental CKD risk according to MetS recovery or development
The number of cases of incidental CKD were 44,867 (4.3%), 11,141 (2.5%), 5,723 (1.9%) and 45,029 (1.0%) in the MetS-chronic, MetS-developed, MetS-recovery, and MetS-free groups, respectively. There was persistent albuminuria (until the final exam) in 41,297 (4.0%), 10,470 (2.4%), 4,803 (1.6%), and 52,757 (1.2%) individuals in the MetS-chronic, MetS-developed, MetS-recovery, and MetS-free groups, respectively. In our regression analysis, the risk of incidental CKD was the highest in the MetS-chronic group, followed in order by the MetS-developed, MetS-recovery, and MetS-free groups (Fig. 3). The risk of albuminuria followed the same order. The associations remained valid in our multivariable analysis, which was adjusted for socio-clinical variables (including income status), BMI and comorbidity burden (represented by CCI). In the intergroup analysis, which adjusted for previous MetS severity (Table 2), people who recovered from previous MetS showed a significantly lower risk of incidental CKD, even after adjustment for the previous MetS severity. The adjusted odds for incidental CKD was approximately 0.7-fold of those who maintained their chronic MetS status. The odds of the presence of albuminuria were nearly half. In contrast, those who newly developed MetS showed a significantly increased risk of consequent CKD. The size of the association was even greater with the albuminuria outcome. Conversely, the MetS recovery group still showed a higher risk of incidental CKD or albuminuria than did the MetS-free group. However, the size of the risk difference was relatively small. The MetS-developed group had a lower risk of incidental CKD or albuminuria than did the MetS chronic group, despite both groups having MetS during the follow-up period.
MetS components and risk of incidental CKD
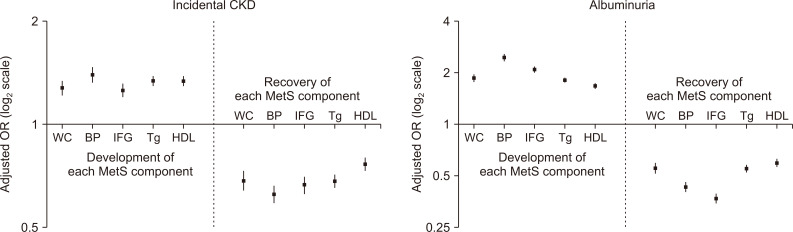
We investigated which components were associated with the largest change in risk of incidental CKD (Fig. 4). The newly fulfilled high blood pressure criterion for MetS was associated with the highest risk elevation of CKD and albuminuria. The other components showed relatively similar association sizes. However, the development of impaired fasting glucose was associated with the second largest increased risk of albuminuria. Regarding recovery, the association sizes were similar for each MetS component regarding incidental CKD outcomes. With regard to albuminuria outcomes, recovery from previous impaired fasting glucose was associated with the largest risk reduction. Furthermore, the associations and their sizes remained similar in our intergroup analysis, which was additionally adjusted for the previous metabolic parameters (Table 3).
Discussion
In this nationwide population-based study of more than 6 million people without baseline kidney dysfunction, approximately 5% of individuals recovered from preexisting MetS and a similar portion newly developed MetS. Recovery from MetS was significantly associated with decreased risk of incidental CKD. In contrast, people who developed MetS had a higher CKD risk than did those who did not develop MetS. However, individuals who newly developed MetS still had a lower risk of incidental CKD than did those with chronic MetS. Among all MetS criteria, high blood pressure development was the component that was associated with the most substantial CKD risk increase.
The main strength of the present study is that we demonstrated that MetS status alteration was significantly associated with a change in CKD risk. To our knowledge, this is the first time that this finding has been reported in a large-scale nationwide study. MetS has been a significant medical problem, because it is one of the most important risk factors for cardiovascular events (which are the most common causes of death worldwide). A significant association between MetS and incidental CKD has also been previously reported, which was independent of individual MetS components, such as established diabetes or hypertension [12,15,16]. However, whether decreased CKD risk is observed in those who recovered from preexisting MetS has only been rarely reported in large cohorts. The evidence is finally shown in the current study. The unique database of national health screenings with repetitive assessments of MetS and kidney function enabled us to define the dynamic MetS statuses and renal outcomes. Our population-based results suggest that emerging CKD-related health problems might be ameliorated through the prevention or reversal of MetS [24,25].
MetS is a cluster of traditional cardiovascular risk factors, including the most common causes of CKD. Therefore, a direct cause-effect relationship with MetS and CKD, beyond the effects of individual components, is debatable. However, previous studies have suggested that MetS is independently associated with CKD, and that the components of MetS are interrelated [12,15,16]. Additional studies are needed to determine whether a synergistic or additive effect of MetS components for progressive kidney function decline exists. Nevertheless, our study suggests that repetitive assessments for MetS are important to predict an individualŌĆÖs consequent risk of incidental CKD in a population.
Another notable finding in the study was that those who recovered from preexisting MetS still had a higher risk of CKD than did those in the MetS-free group. This relationship was true even after adjustment for previous metabolic profiles. This finding could be understood by the chronic changes that are induced by previous MetS, which may not be fully reversible in a few years [30]. Our finding that the MetS-developed group still had a lower risk of CKD than did the MetS-chronic group also supports our hypothesis, because the burden of MetS might have already accumulated in people with chronic MetS. Overall, this finding suggests the clinical relevance of chronic MetS or a previous history of MetS, implying health providers should pay close attention to such history.
The development of high blood pressure was related to the highest risk increase of CKD among MetS components. Clinicians may closely monitor oneŌĆÖs elevated blood pressure when considering CKD risks. However, the other metabolic factors should not be overlooked, because all of its components were significantly related to the risk of CKD. For instance, impaired fasting glucose was associated with consequent albuminuria, which is simply understood based on the pathophysiologic consequences of diabetic nephropathy [31].
Our study has several limitations. First, given its retrospective nature, changes in MetS status may have been affected by other coexisting medical conditions. Although we attempted to adjusted the effects of differences in important characteristics (e.g. BMI, comorbidity burden, and metabolic parameters), unincluded confounders might have been present. In addition, whether an intervention to reduce or prevent MetS would actually lead to improved CKD burden in a population could not have been directly proved herein. This study provides epidemiologic evidence of MetS and its relationship with CKD. Still, further interventional or etiologic studies are warranted in the future. A second limitation is the relatively short follow-up duration of this study, particularly when assessing chronic outcomes such as CKD. A longer follow-up may have allowed us to determine whether the prolonged MetS-recovery state could attain a similar risk of CKD as did the MetS-free group. Conversely, our study suggested that only a few years of follow-up was necessary to observe significant changes in CKD risk according to MetS. A third limitation of this study is that the serum creatinine values were not measured using the current-standard IDMS-traceable method. In addition, an inter-center variance might have been present. Fourth, the included kidney function measurement was mostly performed biennially or annually. These measurements may have caused inclusion of transient renal function changes as CKD. Nevertheless, an annual or biennial examination would reflect the actual practice pattern, since our subjects were relatively healthy people who underwent general health screenings. Finally, although this study included overt diabetes or hypertension as components of MetS, the direct proportions of established hypertension or diabetes were not presented. Therefore, it was difficult to compare this study with other previous studies that focused on early MetS [32-34].
In conclusion, a populationŌĆÖs recovery from MetS was significantly associated with reduced risk of CKD. People who develop MetS should be evaluated for incidental CKD. A public intervention to reduce or prevent MetS may help to reduce CKD-related health burden.

 PDF Links
 PubReader
 Full text via DOI
 Download Citation
 Print
Print


")


