


Introduction
Acute kidney injury (AKI) frequently develops in critically ill patients and is associated with increased mortality and morbidity [1]. AKI is a well-known clinical risk factor for progression to chronic kidney disease (CKD) [2], and even subclinical AKI episodes may progress to CKD. Previous studies indicate that advanced CKD often develops in patients who recover from severe AKI or who require dialysis because of severe uremic signs and symptoms [2–4]. Clinical conditions such as diabetes mellitus, decreased baseline glomerular filtration rate, hypertension, obesity, chronic inflammation, severe AKI, and hypoalbuminemia are risk factors of the progression of AKI to CKD [5]. Several previous studies have confirmed the causal relationship between progression of AKI to CKD and its risk factors; however, limited information is available on mechanisms underlying the progression of AKI to CKD. Renal fibrosis is a common manifestation of CKD [6] and is characterized by accumulation of fibrillary collagen in myofibroblasts and loss or degeneration of tubular epithelial cells. The incidence of CKD associated with this fibrotic process is increasing. Therefore, biomarkers associated with renal fibrotic pathways should be identified to understand mechanisms underlying the progression of AKI to CKD.
Cluster of differentiation 36 (CD36), which is implicated in multiple biological processes, is a multifunctional or multi-ligand signaling receptor. CD36 is usually present on various cells such as renal proximal tubular epithelial cells, macrophages, endothelial cells, platelets, and adipocytes [7]. CD36 also functions as a receptor for thrombosponin-1 and serially binds to thromobosponin-1 to antagonize angiogenesis by inducing endothelial cell apoptosis. Moreover, CD36 is associated with several pathophysiologic processes in different cells, including innate immunity, long-chain fatty acid transport, free radical generation, and atherosclerosis. A high glucose level induces CD36 expression, and high glucose-induced increase in CD36 expression increases free fatty acid (FFA) uptake. Factors such as high glucose level and increased FFA uptake lead to apoptosis or dedifferentiation of renal proximal tubular epithelial cells and micro-vascular endothelial cells [8]. According to previous literature, renal tubulointerstitial fibrosis is associated with decreased expression of regulators of fatty acid oxidation and fatty acid accumulation [9]. Moreover, lipid accumulation in renal tubular epithelial cells may induce cellular lipotoxicity, thus promoting renal fibrosis in diabetic kidney disease.
Thus, CD36, which plays a crucial role in intracellular lipid uptake, may be a critical mediator of renal tubular epithelial–mesenchymal transition (EMT) or kidney injury progression. However, a previous study indicated that CD36 overexpression alone cannot induce a complete fibrotic change [9]. Interestingly, CD36 overexpression under specific pathological conditions such as diabetic nephropathy is significantly associated with renal tubular epithelial cell damage or renal tubulointerstitial fibrosis [8]. These findings suggest that CD36 overexpression promotes AKI progression. However, compared with human CD36 (hCD36), mouse Cd36 (mCd36) does not exert anti-angiogenic and proinflammatory effects in vivo [8]. Thus, we used folic acid-induced AKI mice and transgenic (Tg) mice overexpressing hCD36 to identify the effects of hCD36 associated with AKI progression.
Methods
Animals
Tg mice expressing Pax8–reverse tetracycline transactivator (Pax8–rtTA) in the renal tubules were purchased from Jackson Laboratory (Bar Harbor, ME, USA), and Tg mice expressing tetracycline response element–hCD36 (TRE–hCD36) were obtained from the Einstein Transgenic Facility (New York, NY, USA). Next, Pax8–rtTA Tg mice were mated with TRE–hCD36 Tg mice to generate Pax8–rtTA/TRE–hCD36 Tg mice overexpressing hCD36 under the control of the ‘Tet’O operation regulated with tetracycline. In other words, Tg mice expressing TRE and hCD36 were mated with Tg mice expressing rtTA to generate Pax8–rtTA/TRE–hCD36 Tg mice that overexpressed hCD36 in the proximal tubules under tetracycline feeding. First, 4-week-old Tg mice were fed doxycycline-containing food (Bioserv S3888; Bioserv, San Diego, CA, USA) for two weeks to confirm hCD36 expression. Finally, the Tg mice were analyzed after eating doxycycline-added food for two weeks, and the first and fourth among the four lines showed the highest expression of hCD36 in quantitative reverse transcription polymerase chain reaction (qRT-PCR) and western blot assay. Immuno-fluorescence analysis of samples obtained from Tg mice showing the highest hCD36 expression also yielded positive results for hCD36. Then, mice of the first and fourth line were mated, and tail genotyping was used to identify these as Tg mice overexpressing hCD36 in the proximal tubule.
Folic acid administration
Six-week-old mice were intraperitoneally injected with folic acid (250 mg kg−1 dissolved in 300 mM NaHCO3; Sigma, St. Louis, MO, USA). The mice were divided into the following four groups to compare the effect of hCD36 overexpression on folic acid-induced AKI: (1) folic acid-treated Tg mice (n = 7), (2) folic acid-treated wild-type (WT) mice (n = 7), (3) vehicle-treated Tg mice (n = 7), and (4) vehicle-treated WT mice (n = 7). After 48 hours of folic acid administration, the mouse kidneys were harvested, prepared for histological analysis, and stored at −80°C for mRNA analysis.
Antibodies
The following antibodies were used in this study: anti-hCD36 antibody (Santa Cruz Bio, Paso Robles, CA, USA) and mouse anti-α-smooth muscle actin (α-SMA) antibody (Santa Cruz Bio).
Western blotting analysis
Protein in kidney tissues harvested from Tg mice with hCD36-overexpression and WT mice was extracted for western blot analysis. The proteins were mixed with sodium dodecyl sulfate (SDS) loading buffer, resolved by performing SDS-polyacrylamide gel electrophoresis, and transferred to polyvinylidene difluoride membranes. The membranes were blocked for nonspecific binding and were incubated overnight at 4°C with anti-hCD36 antibody. Next, the densities of hCD36 were normalized to those of β-actin (Sigma-Aldrich) in protein samples obtained from the kidneys of WT and Tg mice.
Immunofluorescence analysis
Formalin-fixed, paraffin-embedded kidney sections of mice in the four groups were washed twice with 0.01 M phosphate-buffered saline (PBS; pH 7.4) and were treated with 10% BSA/0.3% Triton X-100 in PBS for 1 hours to block nonspecific binding. Immunofluorescence labeling was performed using anti-hCD36 antibody to identify hCD36 overexpression in the renal proximal tubules of Tg mice. Next, the kidney sections were washed and incubated with appropriate secondary antibodies for two hours at room temperature, followed by counterstaining with 4′,6-diamidine-2′-phenylindole dihydrochloride (DAPI; Sigma-Aldrich).
Histochemical and immunohistochemical analyses
Formalin-fixed, paraffin-embedded kidney sections were stained with periodic acid Schiff (PAS) to identify histopathological changes in the renal tubules of hCD36-overexpressing mice. In addition, kidney sections from folic acid-treated mice were incubated overnight at 4°C with anti-α-SMA antibody, followed by treatment with an appropriate biotin-conjugated secondary immuno-globulin G to identify renal fibrosis-associated changes. The tubular injury scoring was quantified into six groups on the basis of percentage of tubular dilatation, epithelial desquamation, and intra-tubular crystal formation in 10 randomly chosen, non-overlapping fields at a magnification of 100× under a light microscope: 0, none; 0.5, < 10%; 1, 10–25%; 2, 25–50%; 3, 50–75%; and 4, > 75%. The positive areas of α-SMA immunostaining in the kidney tissue were measured as percentage of total area in 10 randomly chosen, non-overlapping fields at a magnification of 400× using ImageJ software (http://rsb.info.nih.gov/ij).
Measurement of urinary albumin excretion
At 48 hours after folic acid injection, the mice were placed in metabolic cages to collect 24-hour urine samples for measuring urinary albumin and creatinine excretion. Urinary albumin excretion was measured using Albuwell M ELISA kit (Exocell Inc., Philadelphia, PA, USA), and urinary creatinine excretion was measured using a creatinine ELISA kit (Exocell Inc.). Urinary albumin excretion was expressed as the urinary albumin to creatinine ratio (UACR).
qRT-PCR
For qRT-PCR, CD36 and Cd36 RNA was isolated from the harvested kidneys using an RNeasy Mini Kit (Qiagen, Valencia, CA, USA). Next, 1 μg of the RNA was reverse transcribed using a cDNA archival kit (Life Technology, Woburn, MA, USA). qRT-PCR was performed using the ViiA 7 System (Life Technology) with SYBR Green Master Mix (Life Technology) and gene-specific primers. Data obtained were normalized and analyzed using the delta delta CT method. The following primers were used: CD36 forward, 5′-GCTCTGGGGCTACAAAGATG-3′; CD36 reverse, 5′-TAGGGAGAGATATCGGGCCT-3′; Cd36 forward 5′-TG-CTGGGCTGTTATTGGTG-3′; Cd36 reverse, 5′-CATGAGAATGCCTCCA-AACA-3′; Col1a1 forward, 5′-GCTCTTTTTAGATACTGTGG-TGAGGAA-3′; Col1a1 reverse, 5′-GTTTCCACGTCTCACCATTG-3′; Col3a1 forward, 5′-ACAGCTGGTGAACCTGGAAG-3′; Col3a1 reverse, 5′-ACCAGG-AGATCCATCTCGAC-3′; Acta2 forward, 5′-CTGACAGAGGCACC-ACTGAA-3′; Acta2 reverse, 5′-AGAGGCATAGAGGGACAGCA-3′; Fn1 forward, 5′-ACAAGGTTCGGGAAGAGGTT-3′; Fn1 reverse, 5′-CCGTGT-AAGGGTCAAAGCAT-3′; Apaf1 forward, 5′-GGGTGGGTCACCAT-CTATGG-3′; Apaf1 reverse, 5′-TTCCGCAGCTAACACAGACTTG-3′; Bax/Bcl2 forward, 5′-TGGGATGCCTTTGTGGAACT-3′; Bax/Bcl2 reverse, 5′-CAGCCAGGAGAAATCAAACAGA-3′; Cd68 forward, 5′-CTTCC-CACAGGCAGCACAG-3′; Cd68 reverse, 5′-AATGATGAGAGGCAGCAA-GAGG-3′; Mcp1 forward, 5′-TCTCT-CTTCCTCCACCACCATG-3′; and Mcp1 reverse, 5′-GCGTTAACTGCATCTG-GCTGA-3′.
Results
Generation of Tg mice overexpressing hCD36 in the renal tubules
Pax8–rtTA Tg mice expressing rtTA in the renal proximal tubules and TRE–hCD36 Tg mice were mated to generate Pax8–rtTA/TRE–hCD36 Tg mice overexpressing hCD36. The generated Pax8–rtTA/TRE–hCD36 Tg mice overexpressed hCD36 under specific conditions such as tetracycline or doxycycline feeding (Fig. 1).
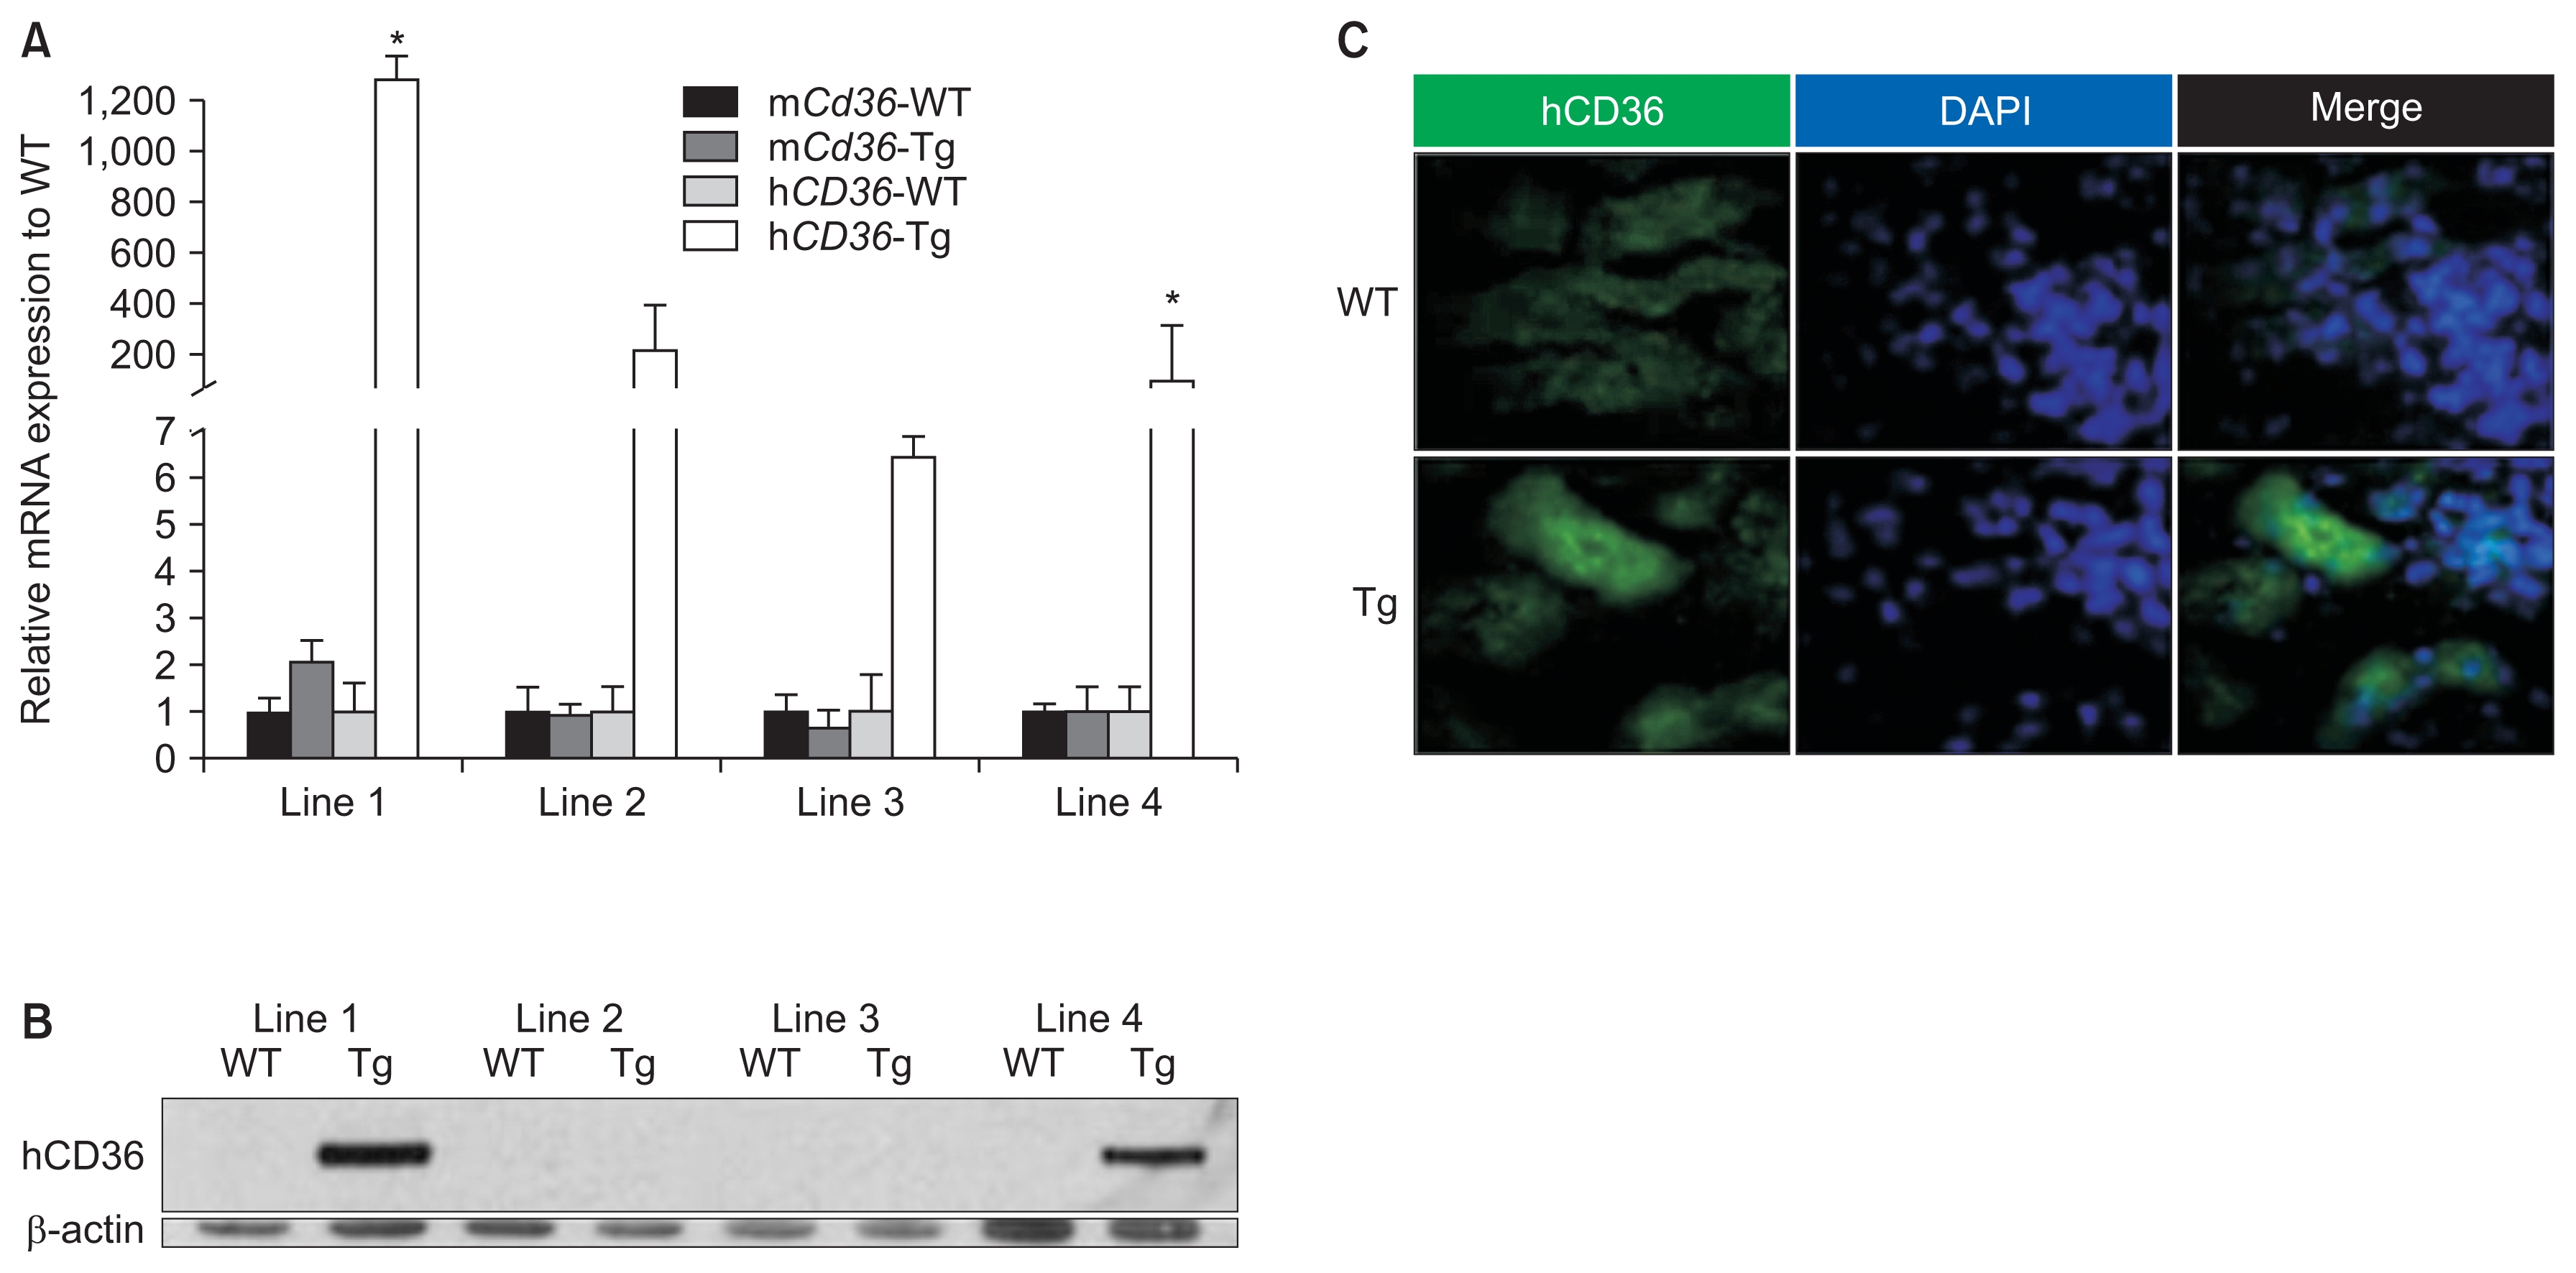
The four lines of Pax8–rtTA/TRE–hCD36 Tg mice were fed doxycycline-containing food from 4 weeks of age for 2 weeks. Finally, mice from the four lines were obtained at 5 weeks of age after the doxycycline feeding. Western blotting, qRT-PCR, and immunohistochemistry for hCD36 and mCd36 were performed with whole kidneys of all lines to identify hCD36-overespression at molecular levels. The results of qRT-PCR and western blotting showed that mice in the first and fourth lines showed the highest hCD36 expression. In addition, Tg mice showing the highest hCD36 mRNA expression yielded positive results for immunofluorescence analysis of hCD36. Thus, hCD36-overexpressing Tg mice were obtained by mating Pax8–rtTA and TRE–hCD36 Tg mice (Fig. 2). Genotyping of tail samples of the mated mice was also performed to produce definitive Pax8–rtTA/TRE–hCD36 Tg mice. On the basis of genotyping, Tg mice expressing both TRE–hCD36 and Pax8–rtTA were defined as true Pax8–rtTA/ TRE–hCD36 Tg mice, and those not expressing TRE–hCD36 and Pax8–rtTA were defined as WT mice (Fig. 3).
Next, we used these Tg mice overexpressing hCD36 in the renal proximal tubules to investigate the effects of hCD36 on the progression of folic acid-induced AKI.
Effects of hCD36 overexpression on folic acid-induced AKI in mice
Folic acid-induced AKI results in the loss or damage of renal tubular epithelial cells. Moreover, severe tubular cell damage aggravates the progression of AKI to CKD [10]. Kidney sections of folic acid-treated mice were stained with PAS for histological analysis of folic acid-induced AKI. Vehicle-treated WT and Tg mice showed relatively normal renal histology (Fig. 4A, B). However, folic acid-treated WT and Tg mice showed marked renal damage, including renal tubular dilatation, inflammatory cell infiltration in the tubulointerstitium, proximal and distal tubular epithelial flattening, and renal tubular cast formation. In addition, folic acid-treated Tg mice showed more severely dilated renal tubules with casts than folic acid-treated WT mice (Fig. 4A, B). Next, the kidney sections of folic acid-treated WT and Tg mice were stained with anti-α-SMA antibody to determine the effects of hCD36 overexpression on folic acid-induced AKI. In the present study, no significant difference was observed between folic acid-treated WT and Tg mice with respect to α-SMA expression (Fig. 4C, D). Fibrosis biomarkers are usually expressed approximately 7 days after the development of folic acid-induced nephropathy. Moreover, the evaluation of samples obtained about 7 days after folic acid-induced AKI may be better for identifying the impact of hCD36-overexpression on progression from AKI to CKD. However, severe AKI is a prominent risk factor of CKD, and preemptive analyses of qRT-PCR for inflammatory and fibrotic biomarkers at the time points (after 2 days and 7 days) in this study showed significant changes only 2 days after folic acid-treatment. Therefore, we performed analyses only 2 days after folic acid-treatment.
A decrease in albuminuria delays the progression of renal disease and improves clinical outcomes, particularly in patients with renal dysfunction [11,12]. Thus, albuminuria may be a risk factor for the progression of renal disease after AKI. In the present study, UACR was measured for all the experimental mice to determine the degree of albuminuria. The UACR was significantly higher for folic acid-treated WT and Tg mice than for vehicle-treated WT mice. Interestingly, albuminuria was significantly higher in folic acid-treated Tg mice than in folic acid-treated WT mice (Fig. 4E).
Thus, the results of histological analysis showed a higher degree of albuminuria and more severe pathological changes in folic acid-treated Tg mice than in folic acid-treated WT mice (Fig. 4D). These results suggest that hCD36 overexpression aggravates the progression of renal diseases after folic acid-induced AKI.
Renal inflammation is not exacerbated in folic acid-treated Tg mice overexpressing hCD36 compared with folic acid-treated WT mice
Generally, macrophages are deeply associated with the inflammatory response via various mechanisms. During the inflammatory response, infiltrating macrophages are usually derived from monocytes. Monocyte chemoattractant protein-1 (MCP-1; also referred to as chemokine [C-C motif] ligand 2 [CCL2]) plays an important role in inflammation [13]. CCL2 is a small cytokine associated with proinflammation or inflammation and mainly induces acute inflammatory damage in humans under pathological conditions [14].
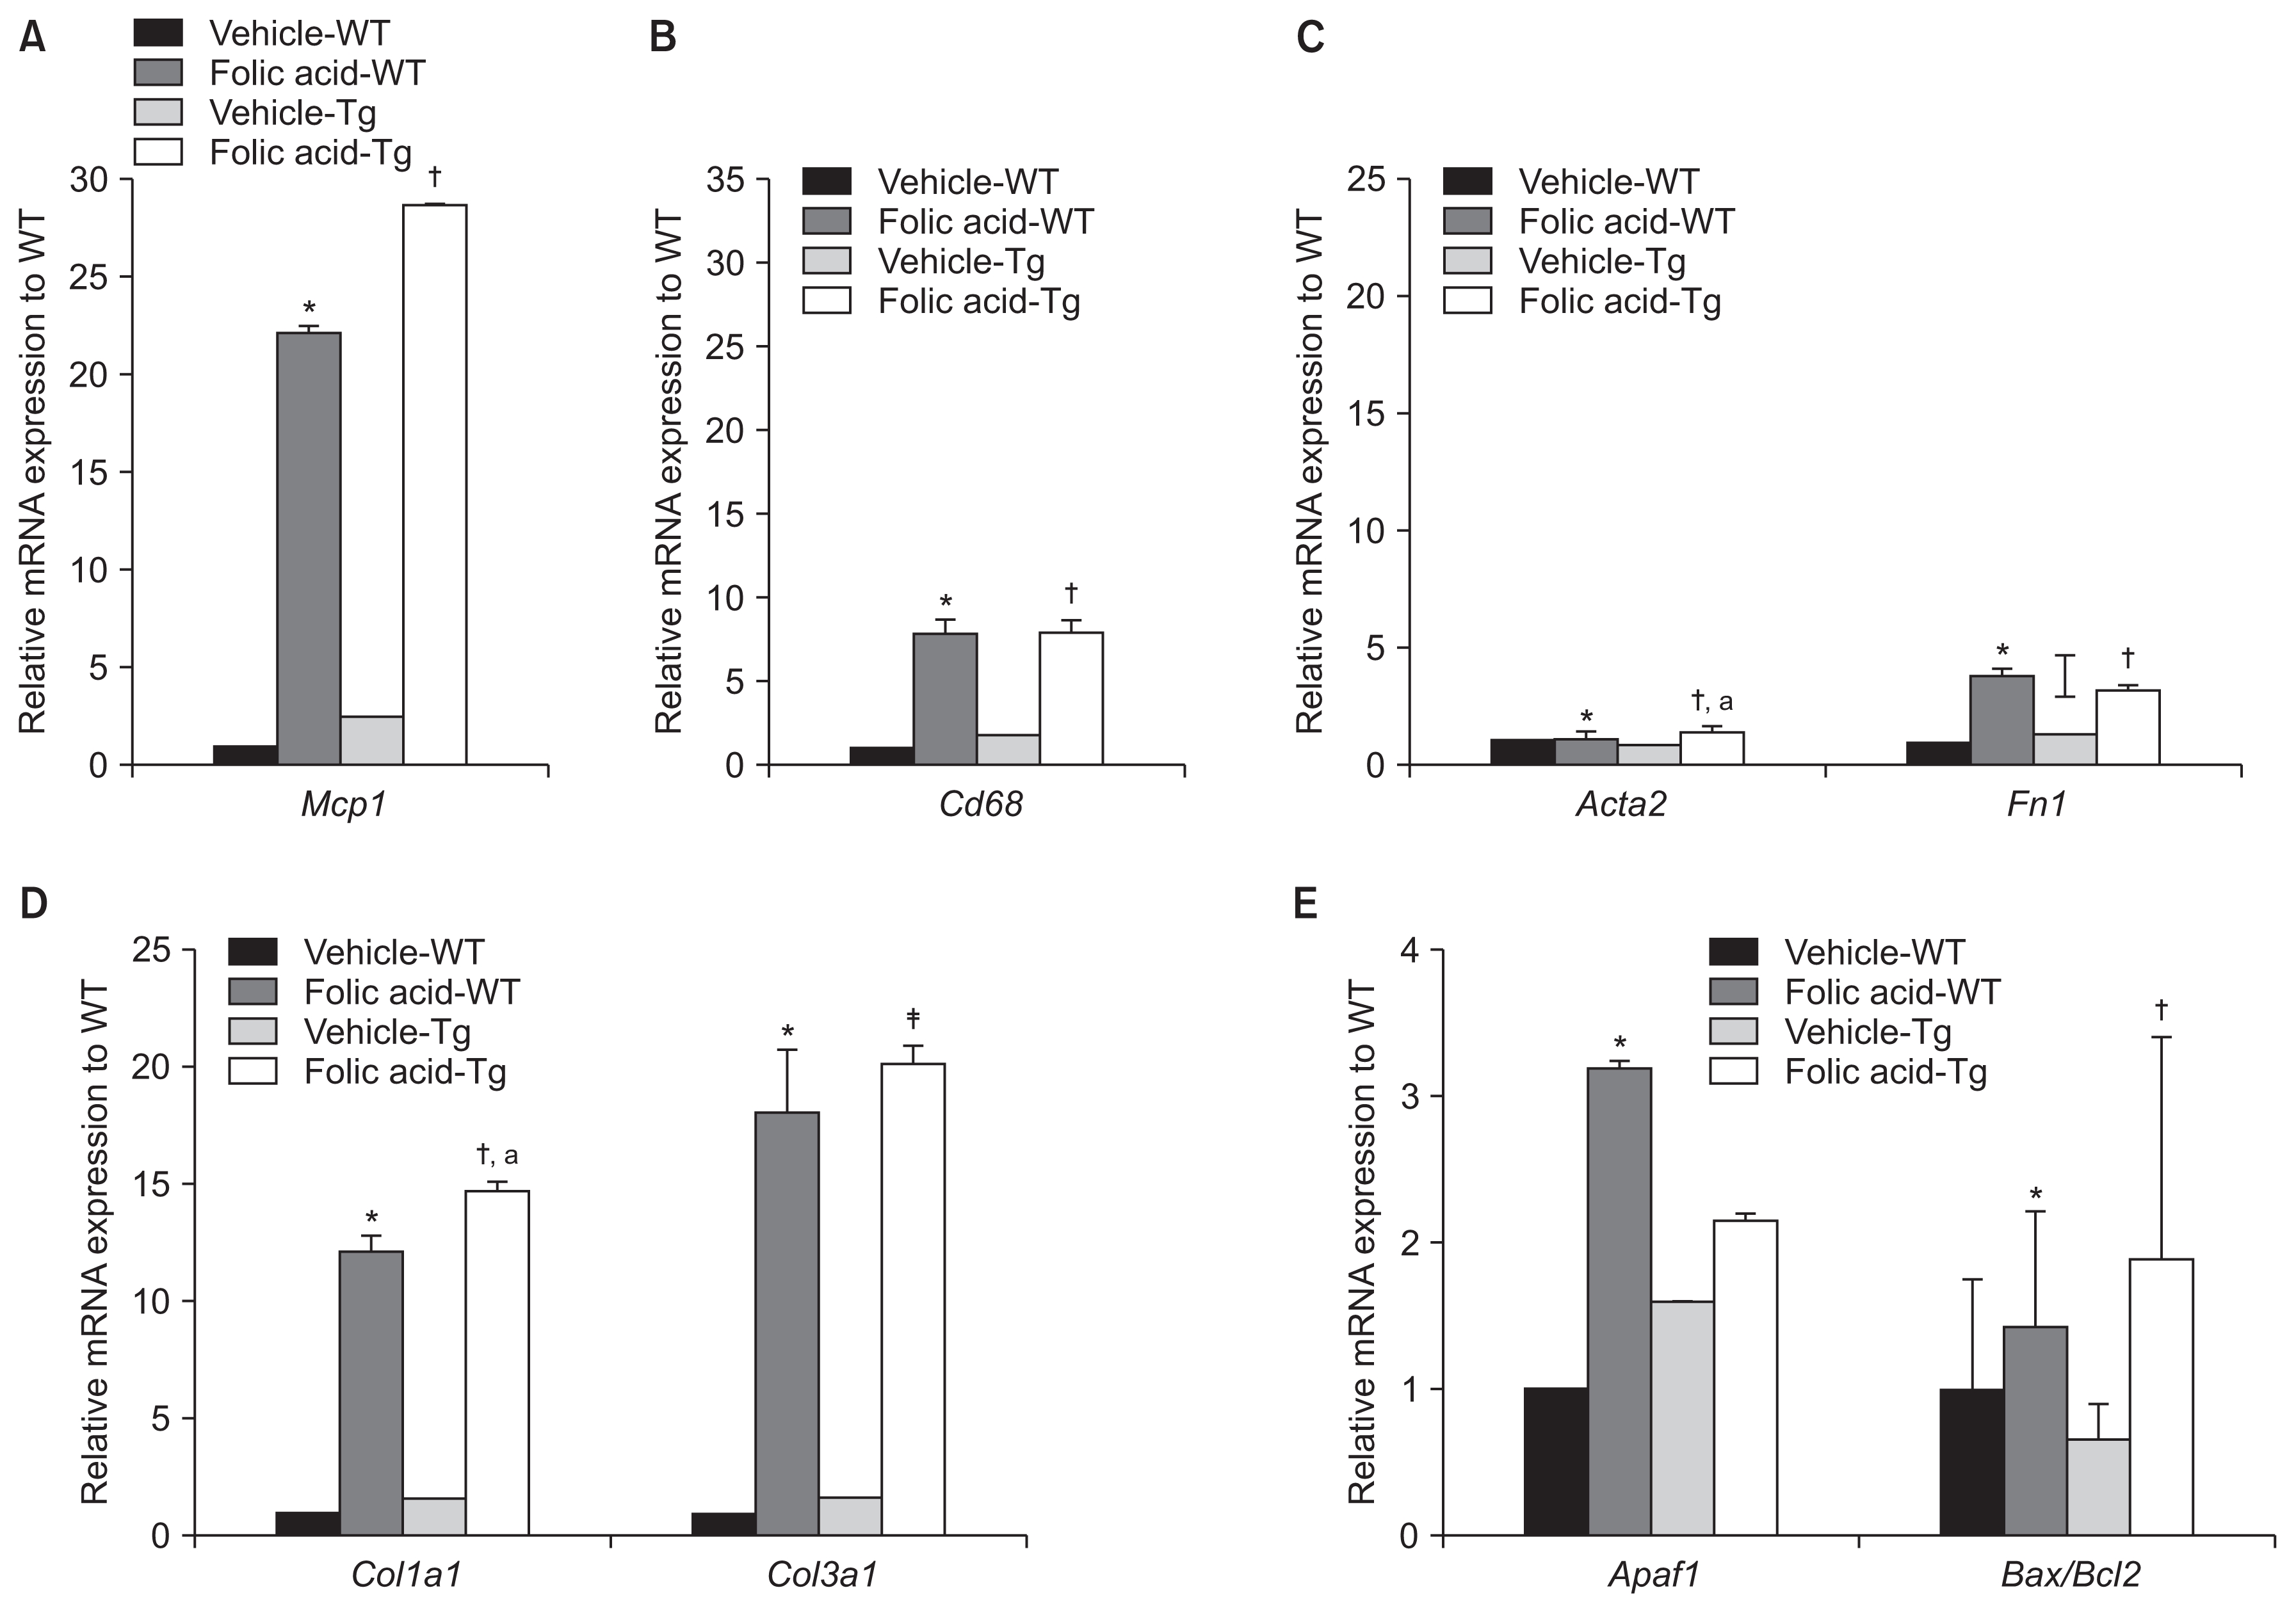
Relative Mcp1 mRNA levels were significantly higher in folic acid-treated Tg and WT mice than in vehicle-treated WT mice. Moreover, Mcp1 mRNA levels were significantly higher in folic acid-treated Tg mice than in vehicle-treated Tg mice (P < 0.05). However, Mcp1 mRNA levels were not significantly higher in folic acid-treated Tg mice than in folic acid-treated WT mice.
Cd68 is a transmembrane glycoprotein mainly expressed by macrophages [15]. Like MCP-1, Cd68 functions as a biomarker of acute inflammation or macrophages. Relative Cd68 mRNA levels were significantly higher in folic acid-treated Tg and WT mice compared to vehicle-treated WT mice (P < 0.05). Moreover, relative Cd68 mRNA levels were significantly higher in folic acid-treated Tg mice than in vehicle-treated Tg mice (P < 0.01). However, no significant difference was observed in relative Cd68 mRNA levels between folic acid-treated WT and Tg mice (Fig. 5A, B).
The renal fibrotic response increases in folic acid-treated Tg mice overexpressing hCD36
The mRNA levels of typical fibrotic genes, including α-SMA (Acta2), fibronectin (Fn1), collagen 3a1 (Col3a1), and collagen 1a1 (Col1a1), were analyzed to identify the association between hCD36 overexpression and EMT in folic acid-induced AKI.
No significant difference was observed in Acta2 mRNA expression in folic acid- and vehicle-treated WT mice. However, the Acta2 mRNA level was significantly higher in folic acid-treated Tg mice compared to vehicle-treated WT and Tg mice. However, we did not observe a significant difference in Acta2 mRNA expression between folic acid-treated Tg and WT mice (Fig. 5C).
There was a trend toward increased mRNA expression of Fn1 in all folic acid-treated mice compared with vehicle-treated WT mice. In addition, the mRNA expression of Fn1 in folic acid-treated Tg and WT mice was higher than that of vehicle-treated Tg mice. However, no significant difference was observed in Fn1 mRNA expression between folic acid-treated WT and Tg mice (Fig. 5C).
Col1a1 mRNA expression was significantly higher in folic acid-treated Tg and WT mice than in vehicle-treated Tg and WT mice. Moreover, Col3a1 mRNA expression was significantly higher in folic acid-treated Tg and WT mice than in vehicle-treated Tg and WT mice. Interestingly, the mRNA levels of Col1a1 and Col3a1 were prominently increased in folic acid-treated Tg mice compared with folic acid-treated WT mice, unlike the mRNA levels of other fibrotic markers. Moreover, Col3a1 mRNA expression was significantly higher in folic acid-treated Tg mice than in folic acid-treated WT mice (Fig. 5D).
Renal tubular apoptosis does not increase in folic acid-treated Tg mice overexpressing hCD36 compared with folic acid-treated WT mice
CD36 is associated with apoptosis. CD36 overexpression in renal proximal tubular epithelial cells, particularly under pathological conditions such as diabetic nephropathy and hyperlipidemia, aggravates their apoptosis [8,9]. Therefore, we analyzed the mRNA expression of several apoptotic genes, including apoptotic protease activating factor 1 (Apaf1) and B-cell lymphoma 2-associated X/B-cell lymphoma 2 (Bax/Bcl2), in folic acid-treated Tg mice to identify the relationship between hCD36 overexpression and apoptosis. BAX promotes apoptosis, whereas BCL2 exerts an antiapoptotic effect. Interestingly, the antiapoptotic effect of BCL2 is countered by combination with BAX protein [16].
We found that Apaf1 and Bax/Bcl2 mRNA expression was higher in folic acid-treated WT and Tg mice than in vehicle-treated WT mice (folic acid-treated WT mice vs. vehicle-treated WT mice: P < 0.05 and P = 0.07, respectively; folic acid-treated Tg mice vs. vehicle-treated WT mice: P = 0.052 and P < 0.05). Moreover, Bax/Bcl2 mRNA levels were significantly higher in folic acid-treated Tg mice than in vehicle-treated Tg mice. However, Apaf1 and Bax/Bcl2 mRNA levels were not significantly higher in folic acid-treated Tg mice than in folic acid-treated WT mice (Fig. 5E).
Discussion
Although the correlation between AKI and subsequent CKD or end-stage renal disease (ESRD) is unclear, AKI is a crucial risk factor of kidney disease progression [2,4,17]. AKI-associated proximal tubular epithelial cell damage may be a starting point for the progression of renal diseases, including diabetic nephropathy [8]. Renal tubular atrophy or interstitial fibrosis is a well-known risk factor of renal failure or renal disease progression, regardless of the etiology. Therefore, it is important to identify fibrotic changes or increased expression of fibrotic molecules in AKI-affected tissues to determine mechanisms or molecules associated with the progression of renal diseases after AKI.
Intraperitoneal treatment of mice with high doses (e.g., 250 mg kg−1) of folic acid may induce AKI [17]. Folic acid results in renal tubular flattening, crystal or cast formation within the renal tubular lumen, and acute tubular necrosis by inducing tubular epithelial cell damage in experimental mice [18]. In the present study, we determined the expression of molecules involved in the progression of renal diseases after AKI using a mouse model of folic acid-induced AKI.
As mentioned above, hCD36 is upregulated under specific conditions such as hyperglycemia, hyperlipidemia, and hypoxia. Moreover, because hCD36 overexpression is associated with renal tubular epithelial cell damage or renal fibrosis under specific pathological conditions such as diabetic nephropathy, fibrotic makers may be expressed early after folic acid administration because of hCD36 overexpression.
Analyses of the effect of hCD36 overexpression on renal disease progression after AKI showed significant histological differences between folic acid-treated Tg and WT mice (Fig. 4A, B, D). Albuminuria was significantly higher in folic acid-treated Tg mice than in folic acid-treated WT mice (Fig. 4C). These findings strongly suggest that hCD36 overexpression is associated with aggravation or progression of AKI in the mouse model of folic acid-induced AKI.
In rats or mice, folic acid-induced nephropathy is associated with the induction of apoptotic molecules, including Bax/Bcl2 and Apaf1, and inflammatory molecules associated with macrophages or monocytes, such as Mcp1 and Cd68 [13,15,16,18]. Folic acid-induced AKI may also result in the progression of renal diseases such as CKD and ESRD. Therefore, we analyzed the expression of fibrotic molecules such as α-SMA, FN1, COL1A1, and COL3A1 to identify their correlation with histological changes observed in the mouse model of folic acid-induced AKI. The qRT-PCR data showed a tendency to increase the mRNA expression of genes encoding fibrotic molecules (only Col1a1 and Col3a1) and an inflammatory molecule (only Mcp1) in folic acid-treated Tg mice compared with folic acid-treated WT mice. However, most results except mRNA analysis for COL3A1 unfortunately did not show statistically significant differences in mRNA analysis of several markers associated with apoptosis, inflammation, and renal fibrosis based on overexpression of hCD36.
Levels of serological markers, including creatinine and blood urea nitrogen, increase 1 day after folic acid administration. Moreover, abnormal levels of serological markers peak 2 days after folic acid administration and may return to normal within 7 days after folic acid administration. Thus, markers associated with folic acid-induced AKI may peak approximately 2 days after folic acid administration. However, levels of early fibrotic markers such as α-SMA, FN1, COL1A1, and COL3A1 may not increase until 7 days after the development of folic acid-induced kidney injury and tubular damage, including tubular dilatation, tubular epithelial cell damage, and tubular crystal formation, and may remain until 2 weeks after folic acid administration [17]. Similarly, the timing of expression of metabolic molecules after folic acid administration can vary according to time course after folic acid administration. The kidneys of experimental mice were harvested 2 days after folic acid administration because molecules associated with inflammation or apoptosis usually peak 2 days after folic acid administration.
Additional correlative data could have been obtained if the mouse kidneys were harvested on different days after folic acid administration (e.g., 7 or 14 days after folic acid administration). Moreover, the sample size used in this study was very small. Analysis of a larger number of Tg mice may have highlighted more significant differences between folic acid-treated Tg and WT mice. In addition, western blotting analysis of several molecules was not performed because of the negative results of relative mRNA analysis of samples obtained from hCD36-overexpressing mice with folic acid-induced AKI.
To date, very few studies have assessed the relationship between hCD36, a multi-ligand scavenger receptor in specific cells, and intracellular signaling during renal fibrosis under specific conditions. However, hCD36 over-expression during lipid metabolism in tubular epithelial cells showing diabetic nephropathy seems to play a crucial role in the development of renal fibrosis [8,9].
In conclusion, our results suggest that hCD36 overexpression in the presence of pathological conditions such as folic acid-induced nephropathy induces prominent histopathological changes. Although most molecular studies have yielded negative results, results of the present study showed that Col3a1 mRNA expression significantly increased in folic acid-treated Tg mice compared with folic acid-treated WT mice, suggesting that hCD36 overexpression potentially affects the progression of renal disease after AKI in a mouse model of folic acid-induced AKI.
Finally, our results suggest that hCD36 overexpression is a risk factor of folic acid-induced AKI and its progression to CKD. However, these results should be considered with caution because of the small sample size included in this study and because no significant differences were observed in the mRNA expression of several biomarkers associated with severe renal injury following AKI between folic acid-treated Tg and WT mice. However, the results of this study may provide a strong foundation for performing further molecular studies.


 PDF Links
 PubReader
 Full text via DOI
 Download Citation
 Print
Print


")


