Perirenal fat thickness is associated with metabolic risk factors in patients with chronic kidney disease
Article information
Abstract
Background
Adipose tissue accumulation in specific body compartments has been associated with diabetes, hypertension and dyslipidemia. Perirenal fat (PRF) may lead to have direct lipotoxic effects on renal function and intrarenal hydrostatic pressure. This study was undertaken to explore the association of PRF with cardiovascular risk factors and different stages of chronic kidney disease (CKD).
Methods
We studied 103 patients with CKD of different stages (1 to 5). PRF was measured by B-mode renal ultrasonography in the distal third between the cortex and the hepatic border and/or spleen.
Results
The PRF thickness was greater in CKD patients with impaired fasting glucose than in those with normal glucose levels (1.10 ± 0.40 cm vs. 0.85 ± 0.39 cm, P < 0.01). Patients in CKD stages 4 and 5 (glomerular filtration rate [GFR] < 30 mL/min/1.73 m2) had the highest PRF thickness. Serum triglyceride levels correlated positively with the PRF thickness; the PRF thickness was greater in patients with triglyceride levels ≥ 150 mg/dL (1.09 ± 0.40 cm vs. 0.86 ± 0.36 cm, P < 0.01). In patients with a GFR < 60 mL/min/1.73 m2, uric acid levels correlated positively with the PRF thickness (P < 0.05).
Conclusion
In CKD patients, the PRF thickness correlated significantly with metabolic risk factors that could affect kidney function.
Introduction
Chronic kidney disease (CKD) is defined as an abnormality of kidney structure or function, present for > 3 months, with implications for health [1,2]. CKD is often associated with chronic inflammatory processes, and is strongly associated with cardiovascular and metabolic risk factors [3]. Patients with CKD are at greater risk for cardiovascular events, hypertension, left ventricular hypertrophy and coronary artery disease than other populations at risk [4].
Metabolic risk factors have also been associated with CKD [5,6]. Several studies have revealed than an elevated body mass index (BMI) is associated with the progression of CKD. Hsu et al [7] observed this association even after adjusting for the presence of hypertension and diabetes mellitus. A meta-analysis including 247 studies revealed that obesity increased the risk of renal disease, and this relationship appeared to be stronger among women [8,9].
The presence of adipose tissue in specific body compartments has been linked to metabolic derangements. Fat deposition in the liver (or non-alcoholic fatty liver) or skeletal muscle has been demonstrated to increase cardiometabolic risk [10,11]. Additionally, epicardial adipose tissue is in close relationship with myocardial metabolism via endocrine and paracrine mechanisms [12,13]. Recent evidence has revealed increased morbidity and mortality in patients with greater epicardial adiposity [14,15]. Perirenal fat (PRF) has been associated with direct lipotoxic effects on the kidneys, such as increasing the glomerular hydrostatic pressure, activating the renin-angiotensin-aldosterone system and accelerating the progression to kidney disease [16–18].
Several non-invasive methods of measuring the distribution of body fat have allowed physicians to explore its association with specific conditions, especially via computed tomography (CT) and magnetic resonance imaging (MRI) [19–21]. However, exposure to radiation and high costs has hindered the use of these imaging strategies in larger-scale studies on this association. Armellini et al [22] demonstrated that ultrasonographic imaging is a feasible alternative to CT and MRI, considering that this imaging strategy entails no radiation exposure and is cheap and reproducible. Kawasaki et al [23] later expanded this approach by evaluating the use of an abdominal ultrasound to determine the amount of PRF. The association of PRF with abdominal obesity has been implicated in the microalbuminuria detected in obese patients [24]. Although some studies have described the association of PRF with the progression of CKD in type 2 diabetic patients, the presence of PRF has been poorly studied in patients with CKD [25].
The aim of this study was to evaluate the relationship between the PRF thickness and the presence of cardiometabolic risk factors in CKD patients.
Methods
Study patients
This cohort study included 103 patients with prior diagnoses of CKD with glomerular filtration rate (GFR) grades 1 to 5. All the patients were evaluated at the UNIRENAL Center, Puerto Odaz city in Venezuela from January to November 2015. Informed consent was obtained from all patients and was approved from the institutional review board of the institution. We used the Kidney Disease Improving Global Outcomes (KDIGO) 2012 definition of CKD: an abnormality of kidney structure or function, present for > 3 months, with implications for health. The CKD Epidemiology Collaboration (CKD-EPI) equation was used to calculate the estimated GFR (eGFR). We used the CKD classification guidelines introduced by the National Kidney Foundation (NKF) Kidney Disease Outcomes Quality Initiative (KDOQI) in 2002, which define a GFR (in mL/min/1.73 m2) of > 90 as CKD stage 1, of 60 to 89 as CKD stage 2, of 30 to 59 as CKD stage 3, of 15 to 29 as CKD stage 4, and of < 15 as CKD stage 5. Patients with an acute kidney injury, polycystic kidney disease or CKD requiring renal replacement therapy were excluded.
Arterial hypertension was defined as a systolic blood pressure (SBP) ≥ 140 mmHg, a diastolic blood pressure (DBP) ≥ 90 mmHg or the use of antihypertensive drugs. A diagnosis of diabetes mellitus was established when the fasting glucose level was ≥ 126 mg/dL or the patient used antidiabetic medications. Dyslipidemia was recognized as a low-density lipoprotein cholesterol (LDL-C) level ≥ 100 mg/dL, a total cholesterol level ≥ 200 mg/dL, a triglyceride level ≥ 150 mg/dL or the use of medications for dyslipidemia. Hyperuricemia was defined as a serum uric acid level ≥ 6.5 mg/dL.
Patients were evaluated after 8 to 12 hours of fasting and a 15-minute resting period. Blood samples were collected and stored at 4°C to 15°C. Samples were centrifuged for 15 minutes and processed by absorbent photometry and turbidometry on an automatized analyzer (MINDRAY® model: BS-240 China; Mindray Medical International Limited, Shenzhen, China).
Imaging
The thickness of the PRF was measured in centimeters (cm) through a B-mode ultrasound with a 3.5-MHz convex transductor (Alpinion® E-CUBE 9; Alpinion Medical Systems, Seoul, Korea). Patients underwent a bilateral renal ultrasound, and the kidneys were measured anterior-posteriorly, transversally and longitudinally. PRF was measured in the distal third between the cortex and the hepatic border and/or spleen (Fig. 1).
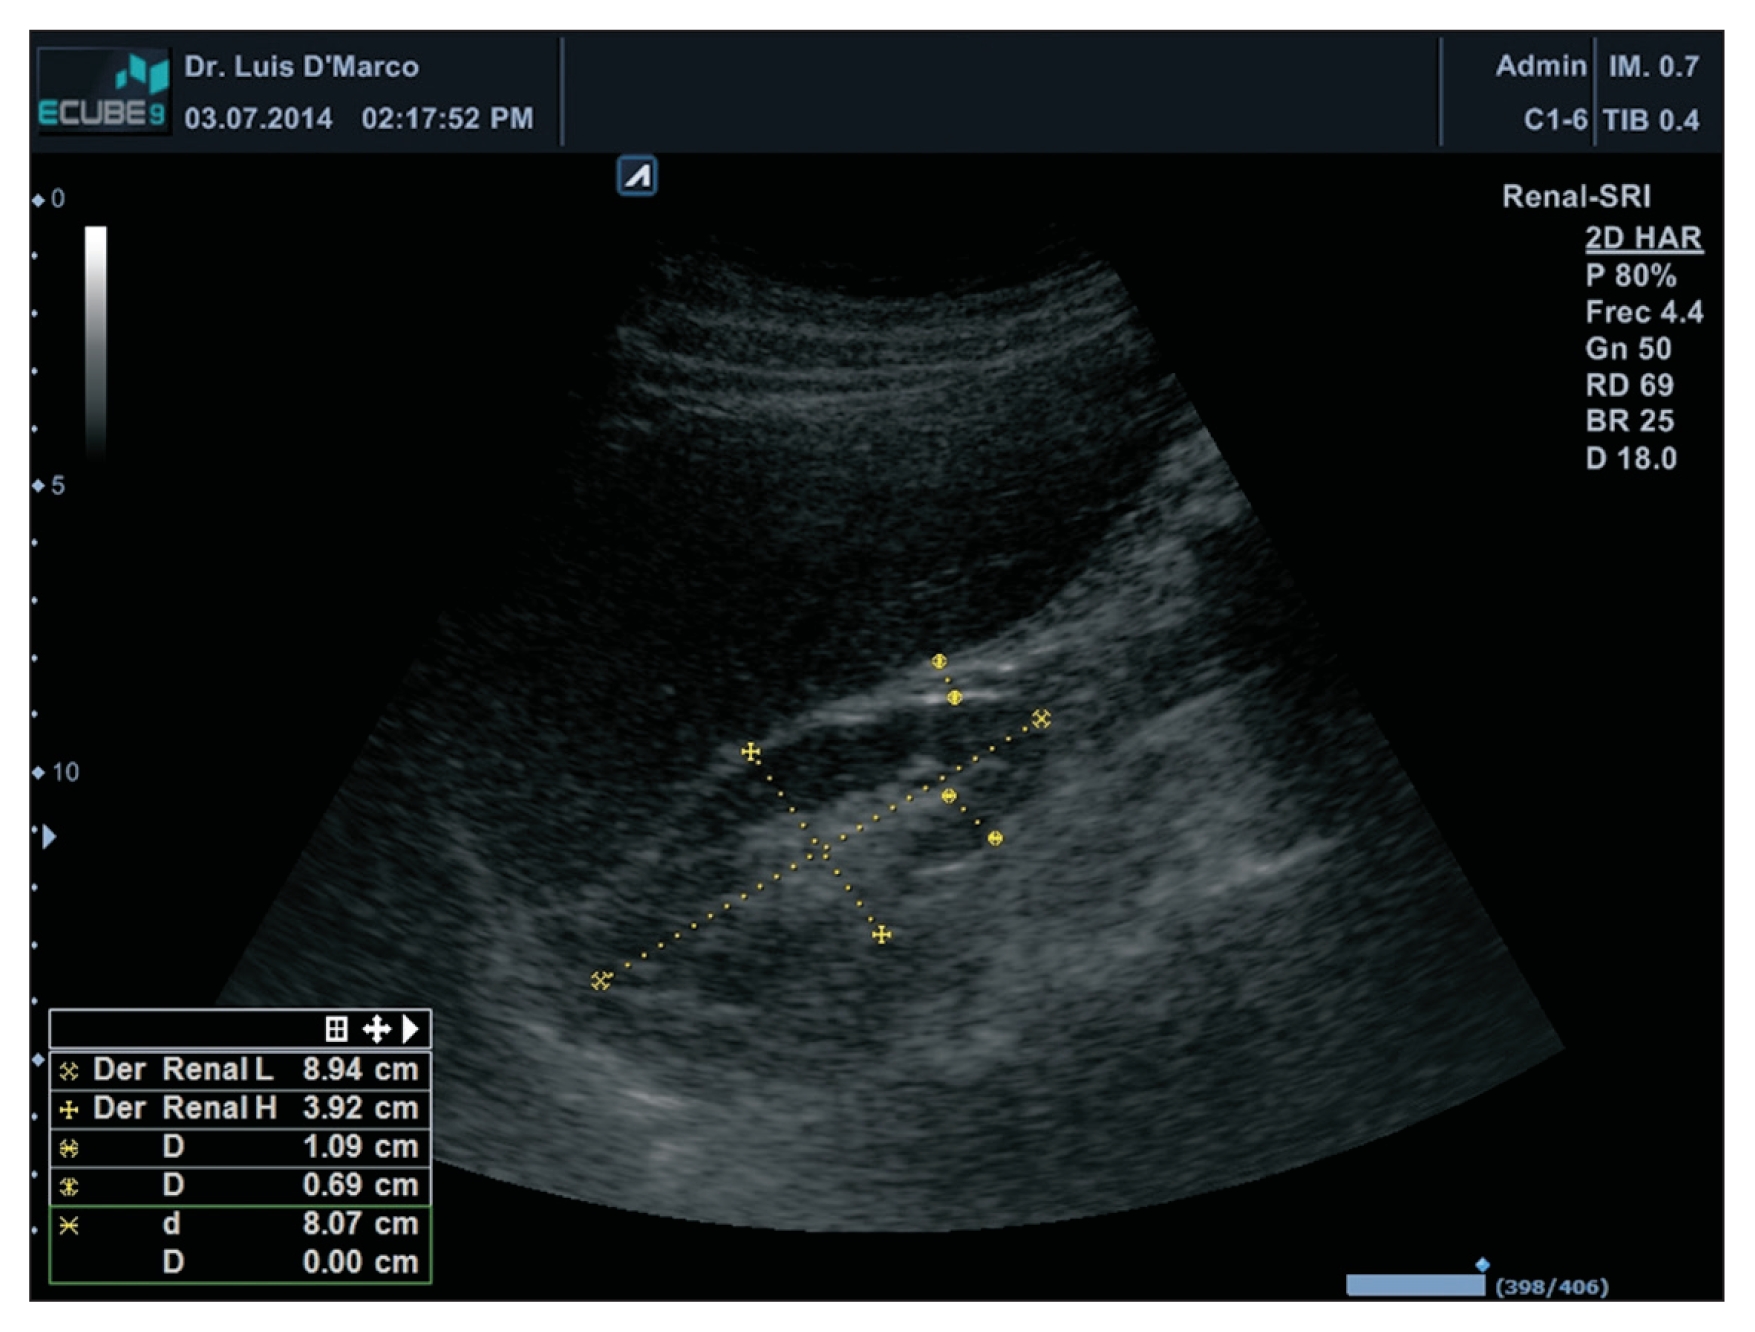
Perirenal fat thickness measurement.
Perirenal fat was measured in the distal third between the cortex and the hepatic border and/or spleen.
Statistical analysis
Qualitative variables are shown as absolute and relative frequencies. The chi-square (χ2) test was used to determine the association between variables. Quantitative variables are shown as the mean and standard deviation. A Kolmogorov–Smirnov normality test was used to determine normality, and non-normal variables were transformed to new logarithmic variables for analysis. We compared means using Student’s t test for two groups and one-factor analysis of variance (ANOVA) for three or more variables with Tukey’s post-hoc analysis. SPSS version 19.0 (IBM Corp., Armonk, NY, USA) for Windows was used for all statistical tests. A P value < 0.05 was considered significant.
Results
General characteristics and PRF thickness
We studied 103 patients (64.1% female [n = 66] and 35.9% male [n = 37]). The mean age was 55 ± 16 years. The DBP, urea, creatinine, high-density lipoprotein cholesterol (HDL-C) and PRF levels differed significantly between men and women (Table 1). The PRF thickness was significantly greater in men than in women (1.10 ± 0.45 cm vs. 0.86 ± 0.35 cm, P = 0.005; Table 1).

General characteristics and thickness of perirenal fat
Clinical and biochemical characteristics and PRF thickness
Fig. 2 displays the distribution of diabetic patients according to their eGFR values. Patients with diabetes mellitus had lower eGFR values than non-diabetic patients (P < 0.05). The patients in CKD stage 1 were significantly younger than those in CKD stages 2, 3, or 4 and 5 (P < 0.001, Table 2). The SBP was significantly higher in CKD stage 4 and 5 patients than in stage 1 patients (P < 0.001, Table 2). Uric acid levels were significantly higher in patients in CKD stages 2, 3 or 4 and 5 than in patients in CKD stage 1 (P < 0.001, Table 2). The thickness of the PRF tended to be greater in CKD stage 4 and 5 patients than in stage 1 patients; however, the difference did not reach statistical difference (Table 2).
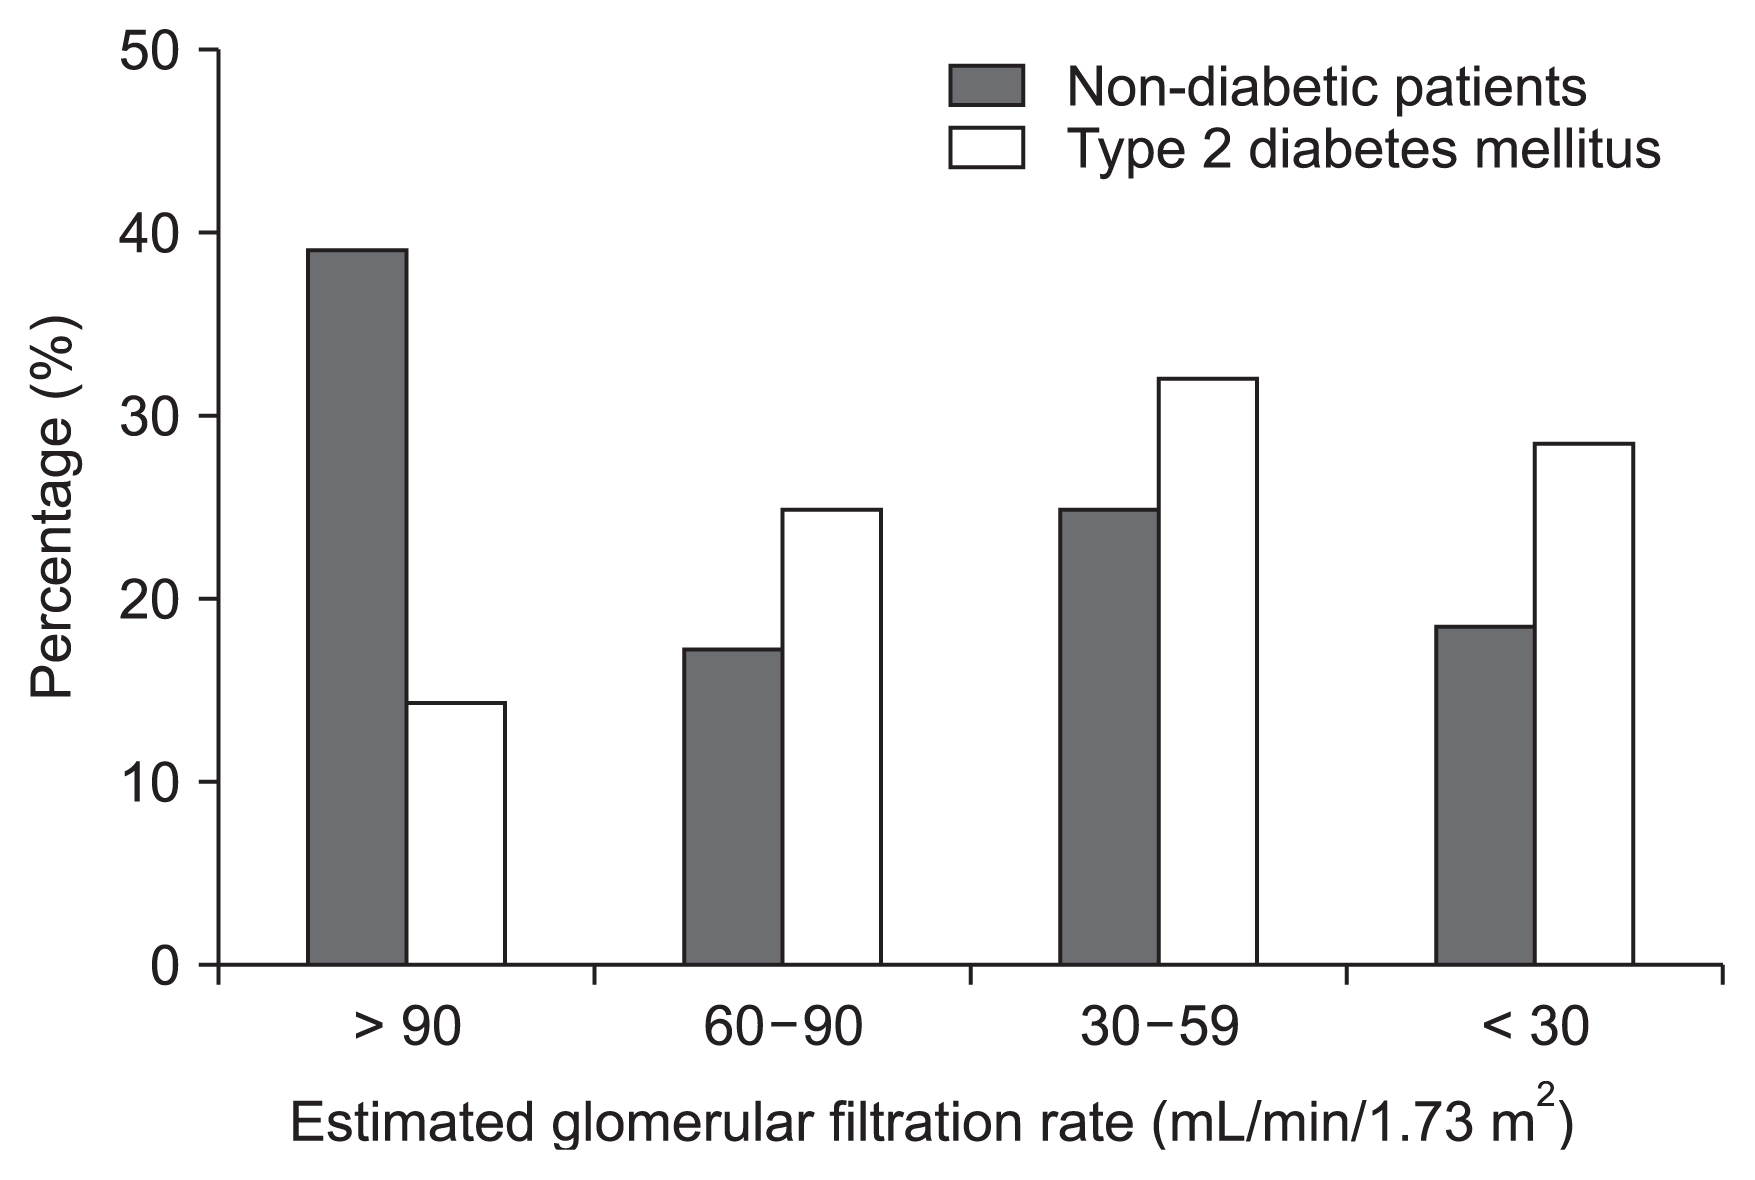
Distribution of diabetes mellitus patients according to the estimated glomerular filtration rate.

Clinical and biochemical characteristics and perirenal fat thickness according to the estimated glomerular filtration rate
Thickness of the PRF according to age and metabolic determinants
We found that the thickness of the PRF was associated with age, as shown in Table 3. The PRF thickness started to increase at age 45 (P = 0.02, Table 3). We also explored the relationship between PRF thickness and metabolic parameters such as fasting glucose levels, lipid profiles and blood uric acid levels (Table 4). The thickness of the PRF was significantly higher in the high fasting glucose group than in the low fasting glucose group (P < 0.01, Table 4). Patients with elevated triglyceride levels had a thicker PRF layer than those with lower triglyceride levels (1.09 ± 0.40 cm vs. 0.86 ± 0.36 cm; P < 0.01, Table 4). Patients with hyperuricemia also had a thicker PRF layer than their counterparts (1.13 ± 0.43 cm vs. 0.86 ± 0.36 cm, P = 0.02, Table 4).

Thickness of perirenal fat according to age and cardiovascular disease risk factors

Thickness of perirenal fat accoridng to metabolic determinants
Thickness of the PRF according to CKD stages and metabolic determinants
We next evaluated the differences in PRF thickness in patients grouped according to CKD stage and particular metabolic determinants. In CKD stage 1 patients, the PRF thickness was significantly greater in those with elevated fasting glucose and triglyceride levels than in those with lower glucose and triglyceride levels (Table 5).

Thickness of perirenal fat according to CKD stage and metabolic determinants
We also examined metabolic determinants after dividing patients into tertiles of PRF thickness. Hyperuricemia was associated with increased PRF levels (P = 0.03, Fig. 3).
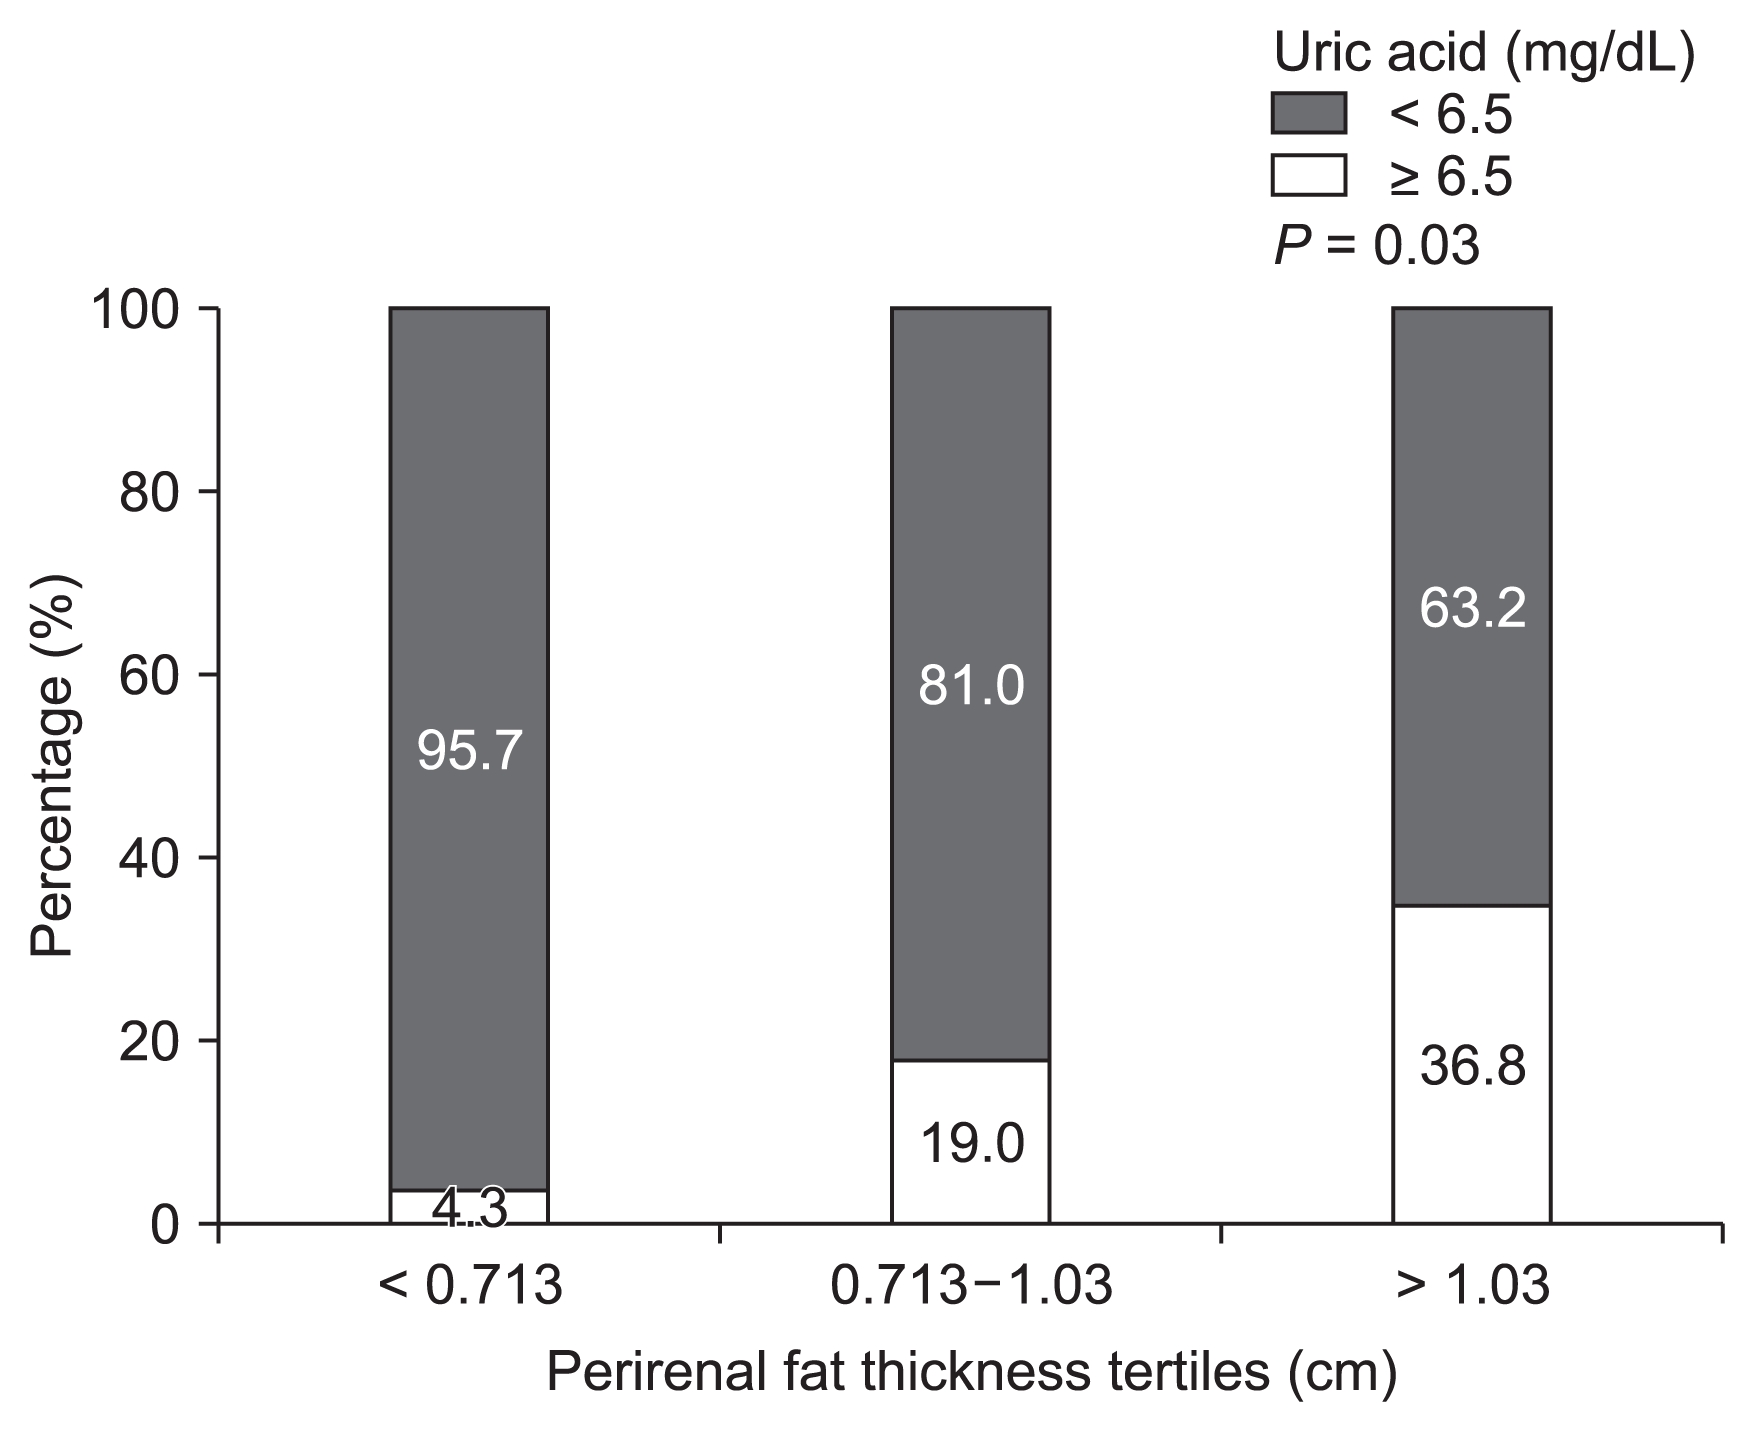
Distribution of patients according to tertile of perirenal fat and uric acid levels.
Discussion
The first report associating obesity with microalbuminuria came from Weisinger et al in 1974 [26]. More recent research has validated their results, demonstrating that de novo kidney disease can be induced by obesity. Visceral adipose tissue is a well-known risk factor for diabetes and hypertension, and these two diseases are the main causes of end-stage renal disease requiring renal replacement therapy [27–30].
Our study revealed that CKD patients with abnormal fasting glucose levels had thicker PRF layers than normoglycemic CKD patients. Patients in CKD stage 1 tended to have thicker PRF layers than other GFR groups; however, this finding was not statistically significant. Lamacchia et al [25] suggested that the PRF is an independent risk factor for a worsening GFR. Nonetheless, despite adjusting for BMI and using different calculation formulas to determine the GFR, these factors may represent possible confounders.
Common risk factors for coronary artery disease are highly prevalent in CKD patients. CKD patients exhibit increased rates of acute coronary events, and dyslipidemia is a common risk factor associated with reduced kidney function [31–33]. In CKD patients, the initial change in lipid metabolism is a reduction in HDL-C levels due to reduced ApoA and ApoA II levels, as well as an increase in triglyceride levels due to reduced clearance [34]. Paradoxically, patients with better kidney function had higher triglyceride levels. The small sample size may have impeded us from observing higher triglyceride levels among CKD patients; nonetheless, we did observe that those with triglyceride levels > 150 mg/dL had thicker PRF layers.
We did not observe significant differences in PRF thickness according to the total cholesterol, LDL-C or HDL-C level. Interestingly, animal models have demonstrated that statins reduce the PRF thickness [35].
Hyperuricemia is associated with increased cardiovascular risk [36–38] and has been identified as a marker of renal disease [39,40]. In our study, uric acid levels differed significantly across different stages of CKD. Those with a GFR < 60 mL/min/1.73 m2 exhibited elevated uric acid levels, along with thicker PRF.
The main limitation of our study was the small sample size and the lack of data on additional metabolic and inflammatory biomarkers, such as the erythrocyte sedimentation rate, C-reactive protein, cystatin C and asymmetric dimethylarginine levels. This may explain why we did not observe an association between CKD progression and PRF thickness. Nonetheless, our results revealed metabolic risk factors that correlated significantly with PRF thickness, which may affect kidney function. It remains to be determined whether there is a direct relationship between PRF and renal disease.
Notes
Conflicts of interest
All authors have no conflicts of interest to declare.
Authors’ contributions
All authors participated in the study design and coordination and helped to draft the manuscript. All authors read and approved the final manuscript.