Association between serum osteoprotegerin level and renal prognosis in nondialysis patients with chronic kidney disease in the Korean Cohort Study for Outcomes in Patients with Chronic Kidney Disease (the KNOW-CKD Study)
Article information

Abstract
Background
Osteoprotegerin is an important regulator of bone metabolism and vascular calcification. The association between serum osteoprotegerin level and chronic kidney disease (CKD) progression has not been elucidated. We investigated the prognostic value of serum osteoprotegerin levels in nondialysis CKD patients.
Methods
We analyzed 2,082 patients enrolled in the Korean Cohort Study for Outcomes in Patients with CKD between 2011 and 2016. Patients were divided into quartiles by their serum osteoprotegerin levels. The primary outcome was the occurrence of ≥1 of the following: dialysis initiation, kidney transplantation, a two-fold increase in serum creatinine level from baseline, or a 50% decrease in the estimated glomerular filtration rate (eGFR). Cox proportional hazard regression models were used to investigate the prognostic value of the serum osteoprotegerin level to CKD progression.
Results
The median follow-up period was 48.9 months, and 641 patients (30.8%) experienced the primary outcome. The hazard ratio of serum osteoprotegerin for renal progression in the full extended Cox proportional hazard model was 1.064 (95% confidence interval, 1.041–1.088). Subgroup analyses by age, presence of diabetes, and eGFR showed significant results consistent with the overall analysis results.
Conclusion
Serum osteoprotegerin level is independently associated with renal prognosis and could have prognostic importance in CKD progression.
Introduction
Chronic kidney disease (CKD) is an emerging public health problem worldwide [1]. Patients with CKD have an increased risk of all-cause mortality, particularly from cardiovascular disease [2–4]. In addition, the progression of CKD to end-stage renal disease causes a considerable decrease in patient quality of life [5] and a high socioeconomic burden on society. Therefore, it is important to identify risk factors for the deterioration of kidney function and delay the progression to end-stage renal disease.
Osteoprotegerin (OPG) is an osteoclastic marker that is mainly secreted by osteoblasts and the vascular endothelium [6]. It is a cytokine receptor of the tumor necrosis factor (TNF) receptor superfamily that inhibits the downstream signaling of the receptor activator of nuclear factor-κB ligand (RANKL) [7] and TNF-related apoptosis-inducing ligands to their receptors [8]. OPG is a marker of bone turnover via RANKL and is also involved in vascular inflammation, endothelial dysfunction, and vascular calcification [9–11]. Recent studies have shown an association between elevated OPG levels and various patients’ outcomes in patients with type 1 diabetes mellitus [12], CKD [13], heart failure [14], and acute coronary syndrome [15].
Although it is clinically important to identify whether OPG is a risk factor for CKD progression, few studies to date have investigated the relationship between OPG levels and renal prognosis. Altinova et al. [16] reported that OPG levels are inversely correlated with renal function in patients with type 2 diabetes mellitus. Lewis et al. [17] showed the possibility of rapid renal decline and renal-disease-related hospitalization or death in older women with elevated OPG levels. However, both those studies were small crossover studies, so additional studies are needed to clarify the association between OPG levels and renal prognosis.
Our purpose in this study was to investigate the prognostic value of the serum OPG level for renal prognosis in nondialysis patients with CKD.
Methods
Study participants
The Korean Cohort Study for Outcomes in Patients with CKD (KNOW-CKD) was a nationwide prospective cohort study in Korea that included nondialysis patients with CKD stages 1–5 (NCT01630486, http://www.clinicaltrials.gov). A total of 2,238 patients were enrolled between 2011 and 2016. The detailed study design, methods, and protocols for KNOW-CKD have been described previously [18]. All procedures performed in studies involving human participants were in accordance with the ethical standards of the institutional and/or the national research committees of the institutions at which the studies were conducted (Seoul National University Hospital, No. 1104-089-359; Seoul National University Bundang Hospital, No. B-1106/129-008; Yonsei University Severance Hospital, No. 4-2011-0163; Kangbuk Samsung Medical Center, No. 2011-01-076; Seoul St. Mary’s Hospital, No. KC11OIMI0441; Gachon University Gil Hospital, No. GIRBA2553; Eulji General Hospital, No. 201105-01; Chonnam National University Hospital, No. CNUH-2011-092; and Pusan Paik Hospital, No. 11-091) and with the 1964 Helsinki declaration and its later amendments or comparable ethical standards. Written informed consent was obtained from all patients at each center before enrollment. Among the participants of KNOW-CKD, 156 patients were excluded from this study because they had missing data on serum OPG levels and unclear renal events. Therefore, the present analysis included 2,082 patients (Fig. 1).
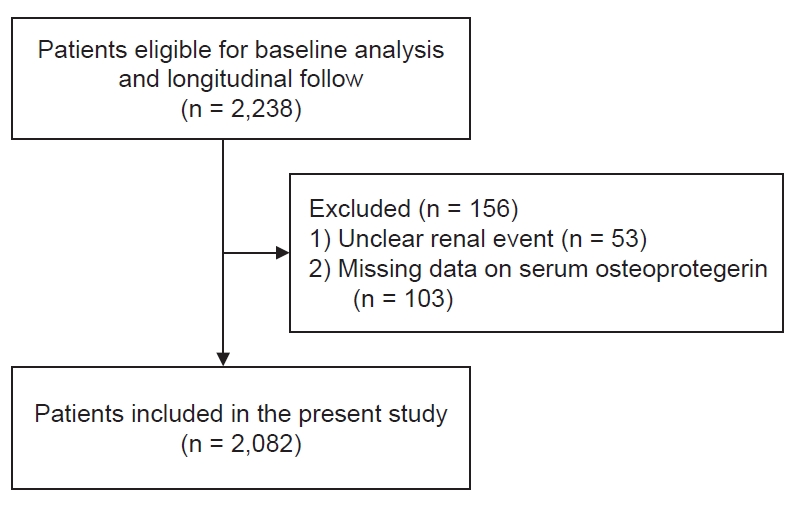
Flowchart of study population enrollment.
Flow diagram for patient enrollment.
Data collection, measurements, and definitions
The baseline demographic details and clinical data (age, sex, smoking history, cause of CKD, economic status, educational level, comorbidities, and medications) of all patients were collected by a well-trained research coordinator. Anthropometric data (height, weight, and waist and hip circumferences) were also collected. Body mass index was calculated by dividing the initial body weight (kg) by the square of the height (m2). Blood pressure was measured using an electronic sphygmomanometer in a clinic after 5 minutes of seated rest. Furthermore, all patients underwent collection of 10-mL blood samples for biochemical analyses, a first-voided urine sample, and a 24-hour urine sample. The collected samples were sent to a central laboratory (LabGenomics, Seongnam, Korea) for complete blood count and blood chemistry measurements. Serum creatinine levels were measured using the isotope dilution mass spectroscopy-traceable method. The estimated glomerular filtration rate (eGFR) was calculated using the four-variable CKD Epidemiology Collaboration equation [19]. Serum OPG and klotho levels were measured using an enzyme-linked immunosorbent assay kit (BioVendor R&D and IBL, Brno, Czech). Diabetes mellitus was defined as serum hemoglobin A1c of ≥6.5%, fasting glucose of ≥126 mg/dL, or a previous diagnosis of diabetes. CKD progression was defined as one or more of the following: initiation of dialysis, kidney transplantation, a two-fold increase in the serum creatinine level from baseline, or a 50% decrease in eGFR during the follow-up period.
Statistical analyses
Data are presented as the mean ± standard deviation for continuous variables with a normal distribution and as the median and interquartile range for continuous variables with nonnormal distribution. A Shapiro-Wilk normality test was used to test normality. Categorical variables are described as the number and percentage of patients. Continuous variables were compared using a one-way analysis of variance and the Kruskal-Wallis test. A Cochran-Armitage trend test was used to compare more than two categories. We applied a multiple imputation method for missing data using the “MICE” package [20] in R because missing values in clinical data are mostly missing at random [21]. Kaplan-Meier survival curves with the log-rank test and univariate Cox proportional hazard models were used to evaluate the association between serum OPG levels and CKD progression. We analyzed the mutual influence between variables using a collinearity test. The proportional hazard assumption of the Cox proportional hazard models was verified using a log-minus-log survival plot and the Schoenfeld residual test. If the proportional hazard assumption was violated, we could not estimate unbiased results using the Cox proportional hazard models. To solve that problem, we applied extended Cox proportional hazard models and measured the time-stratified effects of fixed baseline eGFR, which violated the proportional hazard assumption. We divided the entire follow-up duration into 150-day intervals. Hazard ratios (HRs) and 95% confidence intervals (CIs) were calculated to estimate the risk of CKD progression and determine independent risk factors. Data were analyzed and plotted using R language (version 4.0.2; The R Foundation for Statistical Computing, Vienna, Austria) [22]. All statistical tests were two-tailed, and p-values of <0.05 were considered statistically significant.
Results
Clinical characteristics of study participants
Among the 2,082 total patients, the median follow-up period was 48.9 months, the mean age was 53.5 years, and the number of women was 814 (39.1%). The number of patients with diabetes mellitus was 701 (33.7%), and the median baseline eGFR was 46.2 mL/min per 1.73 m2. The OPG levels measured at baseline were divided into quartiles (≤4.52, 4.52–6.02, 6.02–8.22, and ≥8.22 pmol/L). Significant differences in clinical characteristics were observed among the quartile groups. The highest quartile (Q4) was associated with older age and a higher prevalence of diabetes and hypertension compared with the others. Serum OPG level correlated inversely with baseline eGFR. Smoking history, body mass index, and serum klotho level showed no statistically significant differences among the OPG quartile groups. Serum albumin, total calcium, and low-density lipoprotein cholesterol levels were lower in patients in the highest quartile group than in the other groups, whereas the urine protein-to-creatinine ratio showed the opposite trend. The detailed results are summarized in Table 1. During the follow-up period, 641 patients experienced a renal event that was considered to indicate CKD progression. A significant difference was observed in the incidence of CKD progression according to serum OPG levels (Table 1): CKD progression occurred in 98 patients (18.8%) in the first quartile group, 120 (23.0%) in the second quartile group, 161 (30.9%) in the third quartile group, and 262 (50.3%) in the fourth quartile group (p < 0.001).

Clinical characteristics of the study population
Association between serum osteoprotegerin levels and renal prognosis
Serum OPG levels increased with increasing CKD stages (Fig. 2). The Kaplan-Meier survival curves show statistically significant differences in renal event probability among the quartiles of serum OPG level (Fig. 3). The highest quartile showed the poorest prognosis among the groups. The extended Cox proportional hazard model was adjusted for serum OPG level, age, sex, presence of diabetes mellitus and hypertension, low-density lipoprotein level, calcium level, proteinuria (protein-to-creatinine ratio), C-reactive protein, serum klotho level, and time-stratified eGFR. Both listwise deletion and multiple imputations were used to minimize bias caused by missing values, and those results showed no significant differences. Serum OPG level was independently associated with CKD progression (HR, 1.064; 95% CI, 1.041–1.088; p < 0.001).
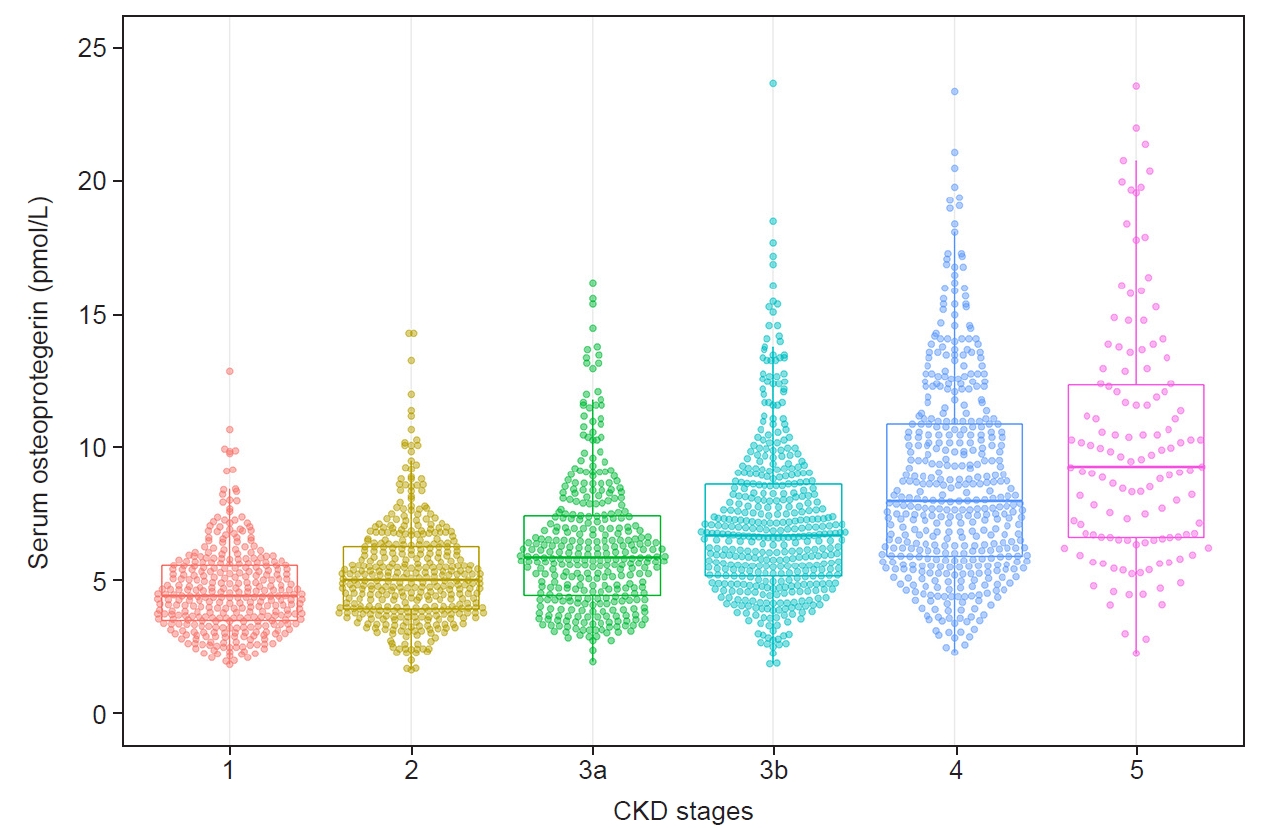
Changes in serum osteoprotegerin level according to CKD stage.
The association between serum osteoprotegerin level and CKD stage.
CKD, chronic kidney disease.

Kaplan-Meier curves for renal outcomes according to quartiles of serum osteoprotegerin level.
Patients with the highest quartile of serum osteoprotegerin showed the poorest renal outcomes.
Subgroup analyses
We performed subgroup analyses by age, CKD stage, and the presence of diabetes mellitus (Table 2). Statistically significant associations between serum OPG level and CKD progression were observed in all subgroups. The HR (CI) values for serum OPG level were 1.062 (1.033–1.091) in the eGFR of ≥60 mL/min per 1.73 m2 subgroup and 1.051 (1.011–1.093) in the age of <60 years subgroup. The results of all subgroup analyses were consistent with the overall results.

Hazard ratios of the serum osteoprotegerin level in the Cox proportional hazard models
Discussion
In this study, serum OPG level was found to be a significant prognostic marker of CKD progression. Subgroup analyses also showed robust and consistent results. Most patients with CKD eventually develop bone mineral disorder, which is related to vascular calcification [23,24]. Vascular calcification is a common complication and an important risk factor for major cardiovascular events [25]. Numerous biomarkers related to vascular calcification have been studied, and serum OPG level has received attention as an osteoclastic marker. Because serum OPG level is a marker of vascular damage, many recent studies have focused on the relationship between it and cardiovascular outcomes, including coronary artery calcification and cardiovascular disease-related mortality [12,13,26,27]. This disorder of the kidney-vascular-bone axis can be related to mineral metabolism; however, it can also result from local inflammation [28]. OPG is expressed in various organs and cell types, including the heart, kidney, liver, osteoblasts, and vascular smooth muscle cells, and it is related to many cytokines and growth factors, such as interleukin (IL)-1, IL-6, IL-11, IL-17, TNF-α, transforming growth factor-β (TGF-β), and platelet-derived growth factor [29–32]. The multifaceted direct or indirect effects of OPG via molecular pathways are believed to affect renal prognosis. In addition, serum klotho is a biomarker that is recognized to be closely related to CKD progression, and it did not differ statistically according to the serum OPG quartiles in this study, which implies that serum OPG and serum klotho work in different ways. Further research is needed to elucidate the relationship between serum klotho and serum OPG.
Several studies have reported an inverse correlation between the serum OPG level and eGFR [33–35], and our study shows a similar result. Considering that the elevated serum OPG level in CKD patients decreases after transplantation [36], it is possible that serum OPG level is dependent on renal function. As age increases, atherosclerosis of the vessels progresses, which could explain why OPG levels increase with age [37,38]. That could also explain why high OPG levels are observed in patients with a history of cardiovascular disease [37]. A previous study observed considerable medial calcification in the aorta and renal arteries of OPG–/– mice [39]; however, the protective role of OPG has not been confirmed in human studies. The serum OPG level tends to be considered a risk marker rather than a risk factor for renal function deterioration because of that evidence.
Bernardi et al. [40] reported that OPG delivery not only upregulated the gene expression of IL-6 and TGF-β but also increased the amount of protein nitrosylation in kidney tissues in an experimental mouse model. Considering that previous studies have shown that TGF-β [41] is related to renal fibrosis and IL-6 [42] is upregulated in diabetic nephropathy, OPG might directly induce kidney injury. However, there is still no consensus about whether the OPG level is a true risk factor. Given the inconsistent results of previous studies, we performed subgroup analyses to identify the effects of the serum OPG level on renal prognosis. We divided patients into subgroups based on factors associated with the serum OPG level: old age [43], presence of diabetes mellitus [43,44], and decreased eGFR [33–35]. Notably serum OPG level showed a statistically significant link with renal prognosis in all subgroups. The consistent and robust results of our study are important because they support the role of OPG as a risk factor for CKD progression.
Our study has many strengths, including its prospective observational design, robust data collection, large study population, minimization of omitted variable bias with the multiple imputation method, and nonviolation of the proportional hazard assumption, which make our results reliable. Despite those many strengths, our study also has a few limitations. First, we could not infer a causal relationship between the serum OPG level and CKD progression because of the inherent limitation of our observational design. However, observational studies are powerful tools for assessing epidemiologic relationships, and we used complementary analytic methods to robustly examine the effects of the serum OPG level on relevant clinical outcomes [45]. Second, despite the wide range of risk adjustments, the problems of hidden bias, confounders, and omitted variables cannot be completely solved. Third, because serum OPG levels were measured only at baseline, we could not assess the effect of variability in serum OPG levels.
In conclusion, our findings support the hypothesis that serum OPG level might be associated with renal prognosis and thus has prognostic value for the progression of CKD. Further studies are needed to determine causality between the serum OPG level and CKD progression.
Notes
Conflicts of interest
All authors have no conflicts of interest to declare.
Funding
This research was supported by the research program of the Korea Centers for Disease Control and Prevention (grants 2011E3300300, 2012E3301100, 2013E3301600, 2013E3301601, 2013E3301602, 2016E3300200, 2016E3300201, 2016E3300202, 2019E320100, 2019E320101, and 2019E320102), and a grant of the Korea Health Technology R&D Project through the Korea Health Industry Development Institute (KHIDI) funded by the Ministry of Health & Welfare, Republic of Korea (grant number: HR20C0021).
Authors’ contributions
Conceptualization: TRO, CM, SWK
Formal analysis: TRO, CM, SWK
Funding acquisition: KHO, SWK
Investigation: TRO, HSC, SH Song, EHB, WC, KHC, KHO, SWK
Writing–original draft: TRO, CM, SH Song, SH Suh
Writing–review & editing: TRO, CM, SH Song, SH Suh
All authors read and approved the final manuscript.