


Introduction
Chronic kidney disease (CKD) is a major public health issue worldwide [1]. Due to the high rate of premature death and cardiovascular disease (CVD) in patients with CKD, its increasing prevalence has become an enormous socioeconomic burden [2,3]. Therefore, the early detection and management of CKD is an important strategy to delay the decline in kidney function and reduce the impact of CKD on healthcare resources [4]. Thus, screening and risk stratification are recommended by measuring the estimated glomerular filtration rate (eGFR) and albuminuria in individuals at risk for CKD [5].
Since the Chronic Kidney Disease Epidemiology Collaboration (CKD-EPI) creatinine equation was first published in 2009, it has become the most popular method to assess kidney function [6]. Although Korean patients were not included in the CKD-EPI equation, the equation has been validated in the Korean population with good performance for estimating glomerular filtration rate (GFR) [7–9]. Therefore, the CKD-EPI equation without the Black race coefficient and the CKD-EPI cystatin C equations [10] have been widely used in clinical practice for Korean patients with CKD.
Recently, CKD-EPI researchers proposed new equations with creatinine and both markers (creatinine and cystatin C) without race coefficients to account for racial diversity in the United States [11]. The new equations with modified coefficients also showed good performance in estimating GFR; however, these equations overestimated measured GFR and yielded a lower prevalence of CKD in non-Black individuals. Thus, it would be meaningful to test whether the new CKD-EPI equations perform well in Korean patients before adopting them in real clinical practice. In this study, we evaluated the impact of the new equations on eGFR differences and compared their predictive performance for kidney failure with replacement therapy (KFRT) to that of the current equations used in Korean patients with CKD.
Methods
Study population
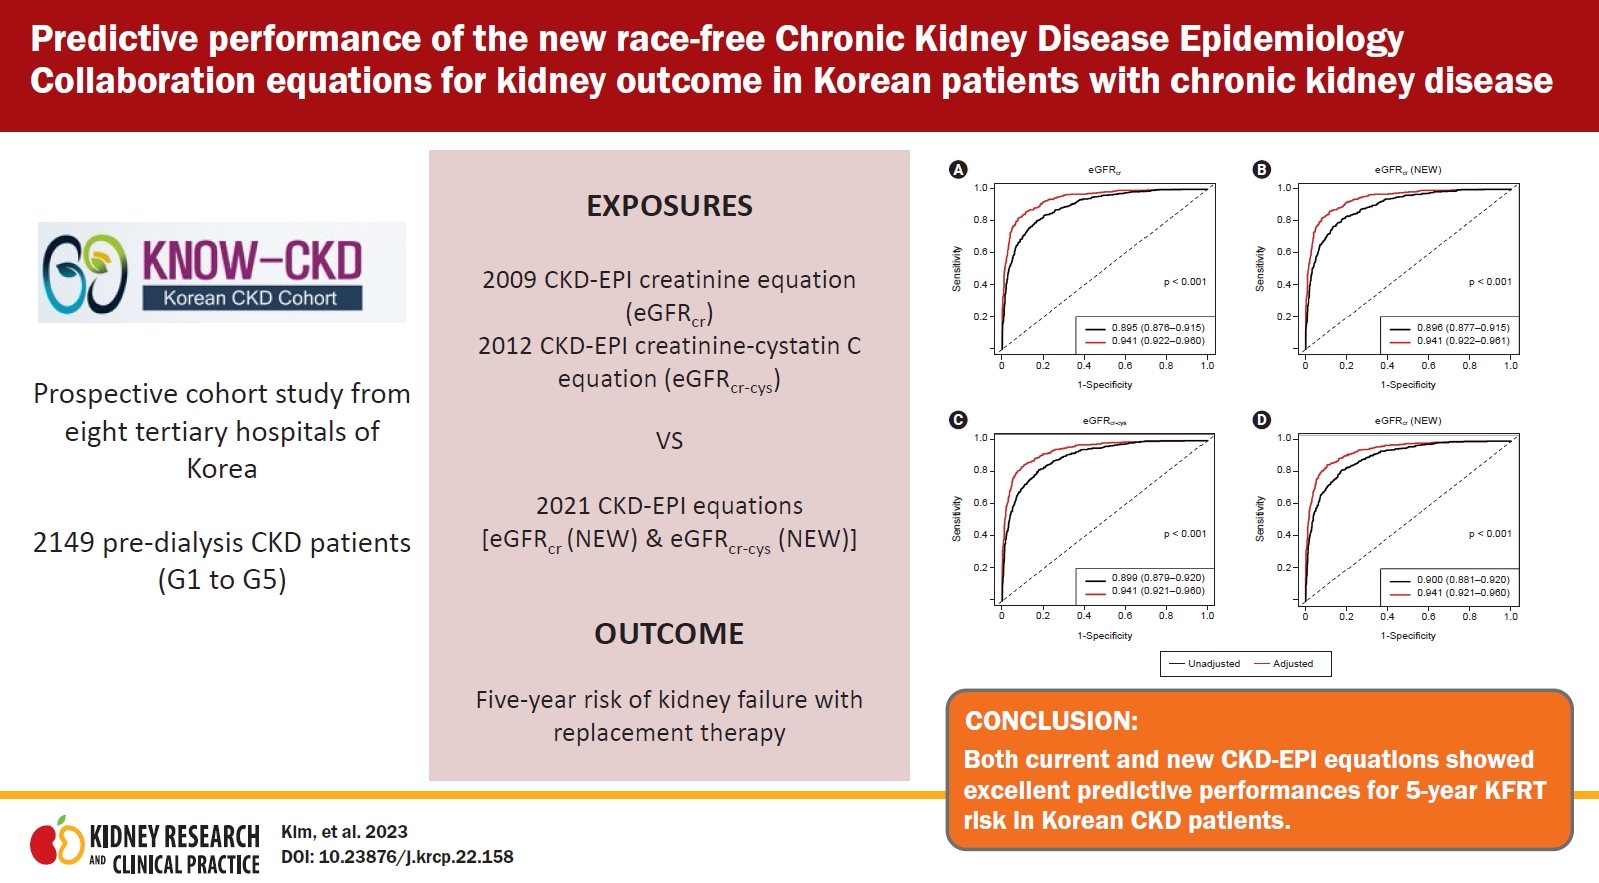
This study was conducted using data from the Korean Cohort Study for Outcome in Patients with Chronic Kidney Disease (KNOW-CKD). The KNOW-CKD was a nationwide, multicenter, prospective cohort study. The detailed design and methods of the KNOW-CKD have been previously described (NCT01630486 at http://www.clinicaltrials.gov) [12]. Patients aged 20 to 75 years with CKD of various causes were recruited from 2011 to 2016. As a result, 2,238 patients from CKD G1 to G5ND were included in the KNOW-CKD. After excluding 89 patients without measurement of serum cystatin C levels, a total of 2,149 patients were included. CKD severity was defined according to the Kidney Disease: Improving Global Outcomes guidelines [13]. This study was performed in accordance with the Declaration of Helsinki, and the study protocol was approved by the Institutional Review Board of the participating centers; Seoul National University Hospital (1104-089-359), Seoul National University Bundang Hospital (B-1106/129-008), Severance Hospital (4-2011-0163), Kangbuk Samsung Medical Center (2011-01-076), The Catholic University of Korea, Seoul St. Mary’s Hospital (KC11OIMI0441), Gachon University Gil Hospital (GIRBA2553), Eulji Medical Center (201105-01), Chonnam National University Hospital (CNUH-2011-092), and Inje University Pusan Paik Hospital (11-091).
Data collection
Baseline socioeconomic data, anthropometric measurements, and medical histories were obtained by trained healthcare providers using a standardized protocol. These data were extracted from the electronic data management system of KNOW-CKD. A history of CVD was defined as a composite of history of coronary artery disease, ischemic stroke, hemorrhagic stroke, or peripheral vascular disease. All blood samples were obtained after overnight fasting and centrifuged within 1 hour. The following laboratory parameters were measured: complete blood count, serum calcium, phosphate, albumin, total cholesterol, high-sensitive C-reactive protein (hsCRP), and parathyroid hormone levels. Proteinuria was determined using spot urine protein-to-creatinine ratio (PCR).
Calculation of estimated glomerular filtration rate
Serum creatinine and cystatin C levels were measured at the central laboratory of KNOW-CKD (Lab Genomics). Serum creatinine levels were measured using the Jaffe method (ADVIA Chemistry XPT System; Siemens) and a coefficient of variation (CV) of creatinine was 5.1%. Serum cystatin C levels were measured using a particle-enhanced nephelometric immunoassay (BN II System; Siemens) and CV of cystatin C was 4.3%. Serum creatinine level was standardized using the isotope-dilution mass spectrometry-traceable method. eGFR was calculated based on serum creatinine and both markers (creatinine and cystatin C). We used the current CKD-EPI equations based on creatinine (eGFRcr) and both markers (eGFRcr-cys) without the Black race coefficient [10], as well as eGFR based on creatinine [eGFRcr (NEW)] and both markers [eGFRcr-cys (NEW)] with the newly developed race-free CKD-EPI equations [11] as follows:
eGFRcr (NEW) = 142 × min (creatinine/κ, 1)α × max (creatinine/κ, 1)–1.2 × 0.9938age × 1.012 (if female) [α = –0.241 (female), –0.302 (male); κ = 0.7 (female), 0.9 (male)]
eGFRcr-cys (NEW) = 135 × min (creatinine/κ, 1)α × max (creatinine/κ, 1)–0.544 × min (cystatin C/0.8, 1)–0.323 × max (cystatin C/0.8, 1)–0.778 × 0.9961age × 0.963 (if female) [α = –0.219 (female), –0.144 (male); κ = 0.7 (female), 0.9 (male)].
Outcome assessment
The primary outcome of this study was the onset of KFRT, defined as maintenance of long-term kidney replacement therapy (KRT; hemodialysis or peritoneal dialysis) for over three months or kidney transplantation during the follow-up period.
Statistical analysis
Continuous variables are expressed as mean ± standard deviation and were compared using a one-way analysis of variance. Categorical variables are expressed as numbers and percentages and were compared using the chi-square test. Data with skewed deviations are presented as median and interquartile ranges (IQRs) and compared using the Jonckheere-Terpstra test. The linear-by-linear association among CKD grades was evaluated and presented as a p for trend. Agreement between eGFRs based on the current and new equations was visualized using a Bland-Altman plot [14]. In addition, we assessed the predictive performance of eGFRs for the 5-year risk of KFRT. We compared the prediction performances of the eGFRs based on the current and new equations using the time-dependent area under the receiver operating characteristic curve (AUC). Moreover, reclassification and discrimination improvement by the new eGFRs compared to the current eGFRs were assessed using the continuous net reclassification index (NRI) and integrated discrimination improvement (IDI) statistics. To compare predictive performances by AUC, NRI, and IDI, we adjusted for the following variables: age, sex, history of CVD, diabetes mellitus, body mass index, systolic blood pressure, serum total cholesterol, calcium-phosphate product, urine PCR, use of renin-angiotensin system (RAS) blockade, and statin use. Furthermore, we compared the predictive performance of each eGFR for 2-year and 8-year KFRT risk, and performed subgroup analysis based on age (<60 and ≥60 years), sex, and cause of CKD. Finally, we calculated the four-variable Kidney Failure Risk Equation (KFRE) score [15], which included age, sex, eGFR, and urine albumin-to-creatinine ratio, and compared predictability of eGFR equations using this score. All analyses were conducted using the R language (version 3.6.2; R Foundation for Statistical Computing).
Results
Baseline characteristics
The baseline characteristics of the patients according to CKD severity based on eGFRcr (NEW) are presented in Table 1. The mean age was 53.8 years, and 61.2% were men. Among 2,149 patients, 33.9%, 95.9%, and 13.4% had type 2 diabetes mellitus, hypertension, and a prior history of CVD, respectively. The Charlson comorbidity index was higher in higher CKD grades (p for trend < 0.001). The most common cause of CKD was glomerulonephritis (35.7%), followed by diabetic nephropathy (23.3%), hypertensive nephropathy (18.5%), and polycystic kidney disease (16.4%). As expected, hemoglobin and serum calcium levels gradually decreased in advanced CKD grades (p for trend < 0.001, both). In addition, there were graded increases in serum phosphate, hsCRP, and parathyroid hormone levels in more severe CKD (p for trend < 0.001, all). Median urine PCR was 0.5 g/g (IQR, 0.1–1.5 g/g), and 85.5% of patients used RAS blockade at baseline.
Differences between current and new estimated glomerular filtration rates and reclassification of chronic kidney disease grades
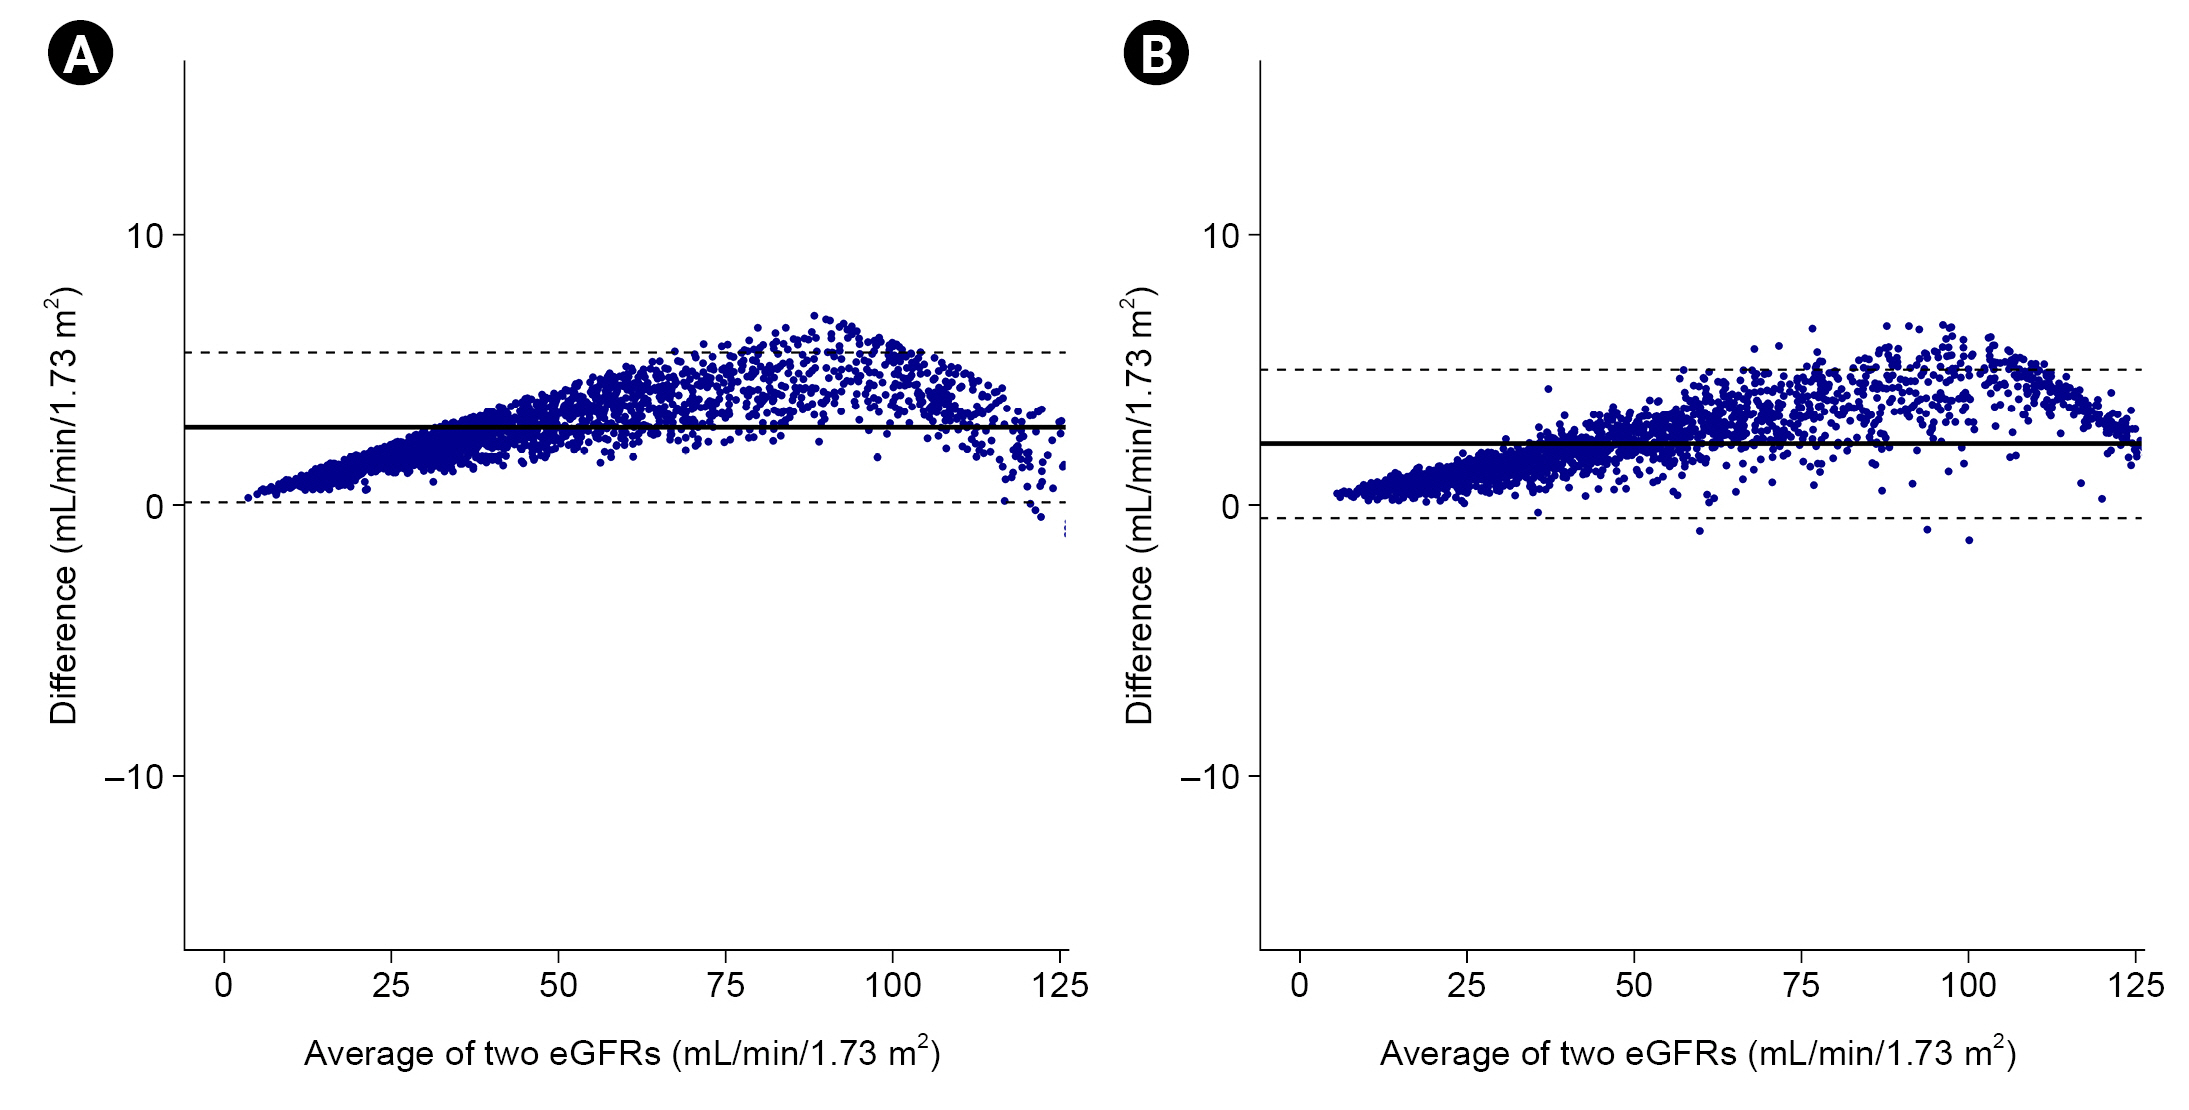
The mean eGFRcr and eGFRcr (NEW) of the whole cohort were 53.2 ± 30.8 and 56.0 ± 31.6 mL/min/1.73 m2, respectively. Thus, the difference between the two eGFRs was 2.90 mL/min/1.73 m2 (95% confidence interval [CI], 2.82–2.94 mL/min/1.73 m2). The difference between the current and new eGFRs was more likely to be larger in early CKD (Fig. 1A). Based on CKD severity with the current eGFRcr, the difference was largest in CKD G2 (4.2 ± 1.0 mL/min/1.73 m2) and decreased in CKD G3 or greater (p for trend < 0.001) (Table 2). Of the 2,149 patients, 303 (14.1%) were reclassified as having lower CKD grades. In patients with CKD G3a based on eGFRcr, 81 (23.1%) were reclassified as G2 based on eGFRcr (NEW). Therefore, the number of patients with eGFR of <60 mL/min/1.73 m2 decreased from 1,393 (64.8%) to 1,312 (61.1%) in the entire cohort (Supplementary Fig. 1, available online).
With regard to eGFR with both markers, the mean eGFRcr-cys and eGFRcr-cys (NEW) were 52.3 ± 32.1 and 54.6 ± 33.1 mL/min/1.73 m2, respectively. The difference between the two eGFRs was 2.3 mL/min/1.73 m2 (95% CI, 2.20–2.32 mL/min/1.73 m2). There was a similar pattern in the difference between the current and new eGFRcr-cys across CKD severity as observed in analysis with eGFRcr. The difference was greater in CKD G1 and G2 (Fig. 1B). Among the 326 patients classified as CKD G3a based on eGFRcr-cys, 53 (16.3%) were reclassified as G2 based on eGFRcr-cys (NEW), and one patient originally classified as CKD G2 was regrouped to G3 (Table 3). Therefore, the number of patients with eGFR of <60 mL/min/1.73 m2 decreased from 1,413 (65.8%) to 1,361 (61.1%) (Supplementary Fig. 1, available online).
In subgroup analysis, the difference in eGFRcr between the current and new equations was significantly higher in men than in women across all CKD grades (Supplementary Table 1, Supplementary Fig. 2; available online). Accordingly, 200 men (15.2%) were reclassified into lower CKD grades, and 103 women (12.4%) were reclassified (Supplementary Table 2, available online). In contrast, the difference in eGFRcr-cys between the two equations was slightly higher in women than in men; 138 men (10.5%) and 82 women (9.8%) were reclassified (Supplementary Table 3, available online). In subgroup analysis by age, eGFR differences between the current and new equations were significantly higher in patients aged ≥60 years than those aged <60 across all CKD grades (Supplementary Table 4, Supplementary Fig. 3; available online). Therefore, patients aged ≥60 years were reclassified into lower CKD grades than those aged <60 years, regardless of eGFR equation (Supplementary Table 5, 6; available online).
Predictive performance of estimated glomerular filtration rate equations for kidney failure with replacement therapy
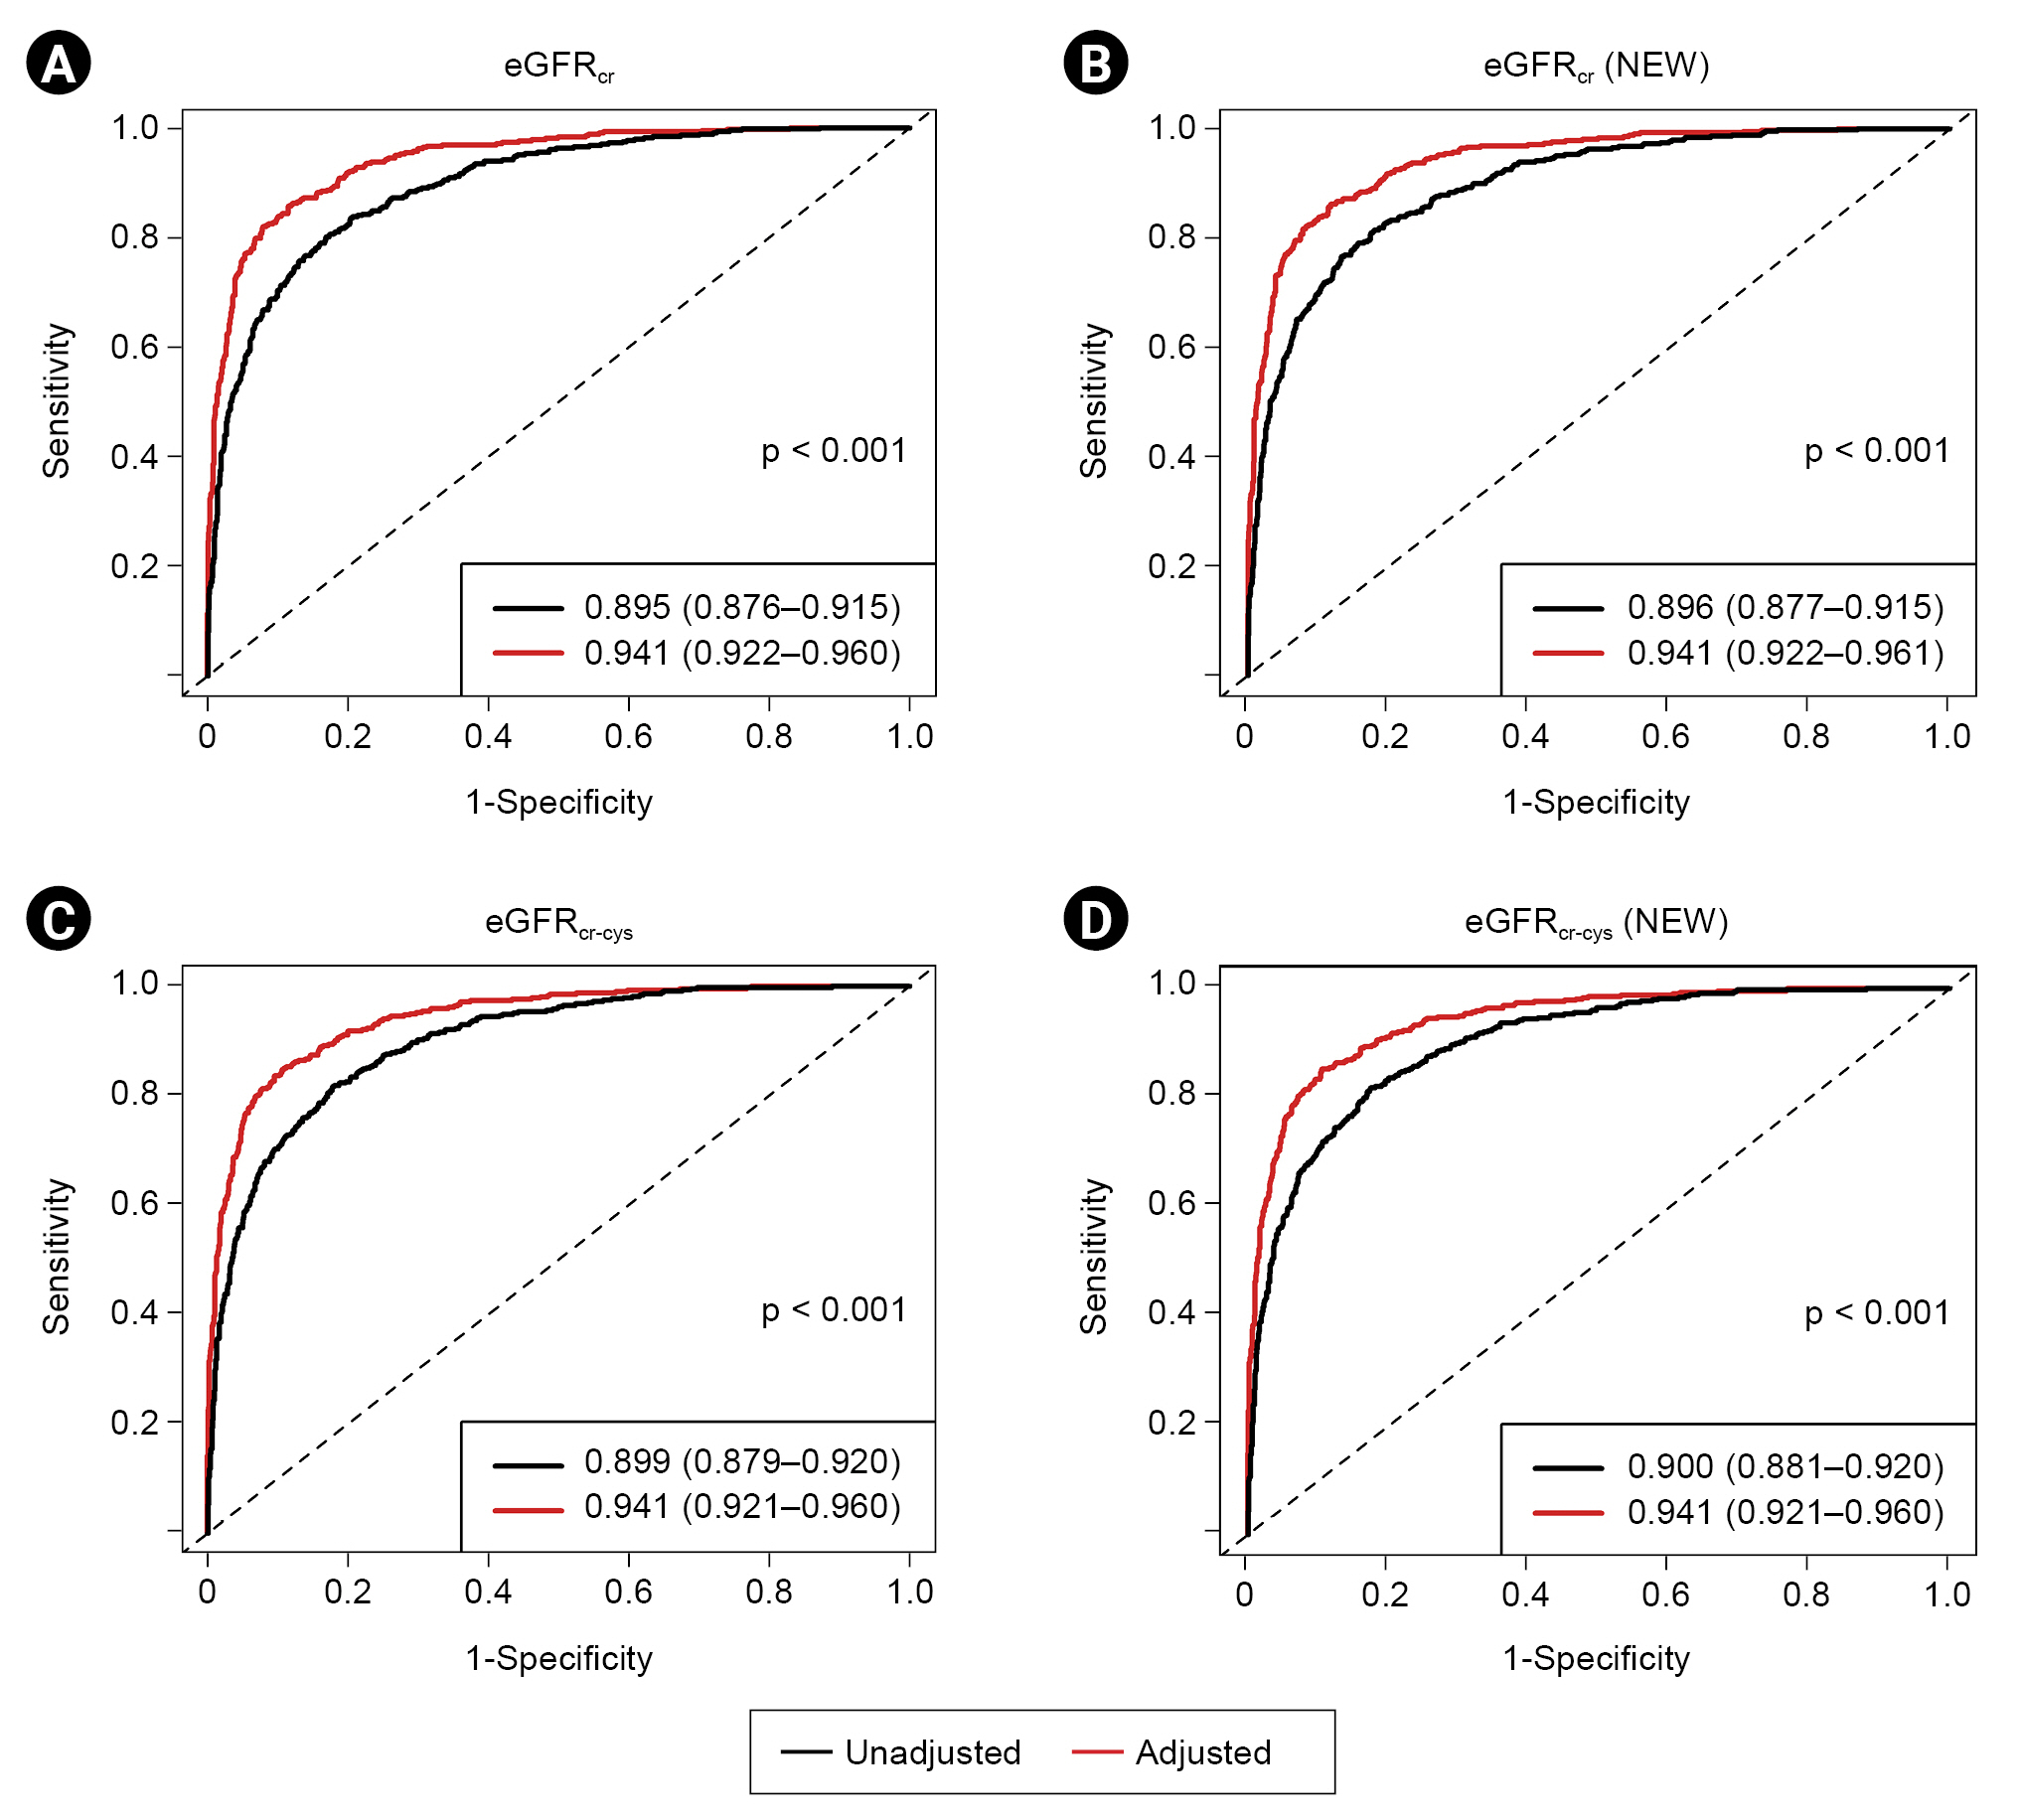
During a median of 5.6 years of follow-up, 624 KFRT events (29.0%) occurred. The AUC of eGFRcr (NEW) for the 5-year KFRT risk was 0.896 (95% CI, 0.877–0.915), which was slightly higher than that of eGFRcr (0.895; 95% CI, 0.876–0.915) (Table 4; Fig. 2A, B). The AUCs were similar between eGFRcr and eGFRcr (NEW) after adjusting for covariables. The IDI and continuous NRI showed that eGFRcr (NEW) had slightly better discrimination and reclassification abilities than eGFRcr. Without adjusting for covariables, eGFRcr-cys (NEW) showed slightly superior predictive performance compared to eGFRcr-cys (Table 4; Fig. 2C, D). However, in the adjusted model, all AUC, IDI, and continuous NRI analyses indicated that eGFRcr-cys and eGFRcr-cys (NEW) had similar predictive performance. We further analyzed the 2-year and 8-year risks of KFRT. The results showed that the predictability of KFRT by AUC was similar between the current and new eGFR equations across all adjusted models (Supplementary Table 7, available online). In the adjusted models of IDI and continuous NRI analyses, eGFRcr (NEW) outperformed eGFRcr for 2-year KFRT risk but not for 8-year risk (Supplementary Table 8, available online). Meanwhile, eGFRcr-cys and eGFRcr-cys (NEW) showed similar performance across all time-point KFRT risk in the adjusted models. When we calculated four-variable KFRE score, all scores showed higher AUCs than eGFR alone in all analyses (Supplementary Fig. 4, 5; available online). However, we found no significant differences in KFRE scores between current and new eGFR equations for both 2-year and 5-year KFRT risk.
In subgroup analysis, IDI and continuous NRI statistics showed that eGFRcr (NEW) had slightly better performance than eGFRcr in both sexes, but AUCs were similar between eGFRs (Supplementary Table 9, available online). eGFRcr-cys and eGFRcr-cys (NEW) performed similarly in both sexes. In addition, eGFRcr (NEW) showed superior predictive performance in all analyses compared with eGFRcr in patients aged <60 years, whereas these were similar in those aged ≥60 years (Supplementary Table 10, available online). The predictive performance of eGFRcr-cys and eGFRcr-cys (NEW) was similar in patients aged <60 years. However, IDI and continuous NRI showed inferior discrimination and reclassification ability for eGFRcr-cys (NEW) compared to eGFRcr-cys. We further compared the AUCs of eGFR equations by CKD cause. We found that all eGFRs showed excellent performance for predicting 5-year KFRT risk in all subgroups (Supplementary Fig. 6, available online). However, there was no significant difference in AUCs between the current and new equations.
Finally, we compared the predictive performance of the new eGFR equations. There was no difference in the AUC between eGFRcr (NEW) and eGFRcr-cys (NEW) across all time points of KFRT risk (Supplementary Table 11, available online). Moreover, IDI and continuous NRI also indicated that the predictive performance was similar between eGFRcr (NEW) and eGFRcr-cys (NEW) (Supplementary Table 12, available online).
Discussion
In this study, we tested the clinical performance of the new race-free CKD-EPI equations in 2,149 Korean patients with CKD. A substantial proportion of patients were reclassified into early CKD grades. When we compared the clinical performance of the current and new equations, all equations showed an excellent ability to predict KFRT risk. eGFRcr (NEW) performed slightly better in terms of discrimination and reclassification for KFRT risk than eGFRcr, but eGFRcr-cys and eGFRcr-cys (NEW) performed similarly. Moreover, the predictive performance did not differ between the new equations [eGFRcr (NEW) vs. eGFRcr-cys (NEW)].
The currently used CKD-EPI equation was mostly developed based on Caucasian, African American, and Hispanic populations, with Asian participants accounting for only 1% to 2%. Thus, the CKD-EPI equation with a four-level race coefficient was later developed [16]; however, this equation did not show significantly better performance than the original equation for Asians. In Korea, the original CKD-EPI equation showed the smallest bias for measured GFR among the various equations [8,9]. Previously, Jeong et al. [7] proposed a Korean version of the CKD-EPI equation, which showed similar performance to the original version. In addition, because almost all people living in Korea are of a single ethnicity, the original CKD-EPI equation without the Black race coefficient has been widely used to estimate GFR in Korea.
In this study, the mean difference between the eGFRcr (NEW) and eGFRcr was 2.9 mL/min/1.73 m2. Notably, this difference was more significant for higher eGFR values. Therefore, a substantial proportion of patients were reclassified from CKD G3a to G2. The proportion of patients with eGFR of <60 mL/min/1.73 m2, which is a critical threshold for determining CKD, decreased from 64.8% to 61.1% after applying eGFRcr (NEW) in our cohort. These findings suggest that using eGFRcr (NEW) may significantly change the prevalence of CKD in Korea. A previous study reported that the prevalence of CKD in Korean adults aged ≥20 years was 8.2% [17]. CKD-EPI researchers reported that the estimated prevalence of CKD in the United States would decrease by 1.5% in non-Black people when the eGFRcr (NEW) was used [11]. Therefore, the prevalence of CKD in Korea will also be lower than the current estimate if the new equation is implemented. In particular, we identified that the difference between the existing and new equations was prominent in elderly and male patients. Changes in the diagnosis of CKD would affect not only the distribution of medical resources for individual patients but also the national healthcare plan for CKD. Therefore, if there is no significant difference in the accuracy of the current and new equations, the socioeconomic impact of the new equations should also be considered before employing them. In particular, lowering the prevalence of CKD using the new equation would help to reduce unnecessary use of medical resources and socioeconomic burden in low-risk individuals without albuminuria. Meanwhile, early detection and intervention is important for those at risk of progression. Therefore, further expert discussion and studies are needed to reach a consensus regarding adoption of the new equations in Korea.
We could not validate the accuracy of the new race-free equations because we did not measure GFR in our cohort. However, accurate estimation of GFR does not always lead to precise prediction of kidney outcomes. Previous studies have reported conflicting results. Some studies showed that measured GFR predicted KFRT better than eGFR [18,19], while others did not [20,21]. We also showed that eGFR calculated using the current CKD-EPI equation had excellent performance for predicting KFRT in our cohort. eGFRcr (NEW) outperformed eGFRcr in the unadjusted model. However, eGFRcr (NEW) had only slightly better discriminating and reclassifying abilities than eGFRcr after adjusting for confounding factors. In addition, eGFRcr-cys (NEW) provided no additional benefit over the current eGFRcr-cys. Thus, from the perspective of KFRT prediction, physicians can use both the existing and new creatinine-based equations in clinical practice. Moreover, because we showed that the AUC of eGFRcr-cys (NEW) for KFRT was comparable to those of eGFRcr-cys and eGFRcr, further measurement of serum cystatin C may be redundant for KFRT prediction. As mentioned above, the difference between the current and new equations was smaller in advanced CKD. In fact, it was less than 1 mL/min/1.73 m2 in CKD G5. Accordingly, adoption of the new equation is unlikely to have a significant impact on clinical decision-making regarding initiation of KRT in the future. The National Kidney Foundation and American Society of Nephrology Task Force recommended the immediate implementation of eGFRcr (NEW) in all laboratories in the United States [22]. In terms of KFRT prediction, this recommendation is acceptable in Korea based on our study. However, our findings contradict other recommendations for making cystatin C measurement easier because eGFRcr-cys (NEW) did not perform better than eGFRcr (NEW). Thus, the accuracy of eGFR based on cystatin C and its clinical performance for other outcomes need to be further tested in Korean patients with CKD.
This study had several limitations that should be discussed. First, all participants in our cohort had CKD by definition at enrollment, which was confirmed by nephrologists at each center. Moreover, these patients were followed and managed in tertiary hospitals across the country. Therefore, our results may not be generalizable to all Koreans. Second, among the many factors that led to KRT initiation, residual kidney function was generally evaluated using creatinine-based eGFR, and the role of cystatin C-based eGFR was relatively underrated. Accordingly, the clinical practice patterns of nephrologists might have affected the predictive performance of cystatin C in our study. Third, because we measured serum creatinine using the Jaffe method, not the enzymatic method, creatinine measurement might have been biased. Fourth, there is no solid international consensus on measuring serum cystatin C. Thus, our results for eGFRcr-cys and eGFRcr-cys (NEW) should be further validated in other Korean cohorts. Finally, because we did not have data for measured GFR, we could only suggest the predictive performance of eGFR equations and not the accuracy of the equations. Further studies are needed to evaluate the accuracy of the new CKD-EPI equations in Koreans.
Nevertheless, our study has several strengths. The KNOW-CKD included many patients with CKD G2 and G3a; therefore, we could clearly show a significant shift in CKD grades when the new CKD-EPI equations were used. In addition, we measured serum creatinine and cystatin C levels in the central laboratory of the KNOW-CKD; thus, we could avoid inter-center bias.
In conclusion, the new CKD-EPI equations significantly reclassified patients into lower CKD grades in our cohort. In addition, the existing and new CKD-EPI equations showed excellent predictive performance for KFRT in Korean patients with CKD. However, estimating GFR based on both creatinine and cystatin C levels showed no additional benefit over creatinine-based eGFR alone in terms of predicting KFRT risk. Further studies are needed to confirm our findings and evaluate the accuracy of these new equations and their predictive performance for other clinical outcomes.
 PDF Links
 PubReader
 ePub Link
 Full text via DOI
 Download Citation
 Supplement table 1
 Print
Print


")


