


Introduction
The Korean Society of Nephrology (KSN), an association of scholars and clinicians, has the largest and continuous project in which patients are enrolled by all society members; this project is called the End-Stage Renal Disease (ESRD) Patient Registry. The first Korean nationwide registry of ESRD patients was reported in 1977 by the late professor Byung Suk Min, who was assassinated by a North Korean terrorist while working as a physician for the Korean president in 1983. The KSN launched an official registry program, the Insan Prof Min Memorial ESRD Patient Registry, in 1985.
The objectives and importance of the patient registry and statistical evaluation of ESRD can be summarized as follows: first, to estimate the numbers and distributions of target therapy patients by a dialysis specialist group (KSN); second, to know the characteristics of ESRD and dialysis therapy and its complications or results based on scientific evidence; and third, to improve quality of dialysis therapy and provide information for socioeconomic health administration and the future health plan. Recently, because of the increase in the number of elderly and diabetic patients in the Korean population, the prevalence of ESRD and number of hemodialysis machines in Korea have increased more rapidly than those in other developed countries [1], [2].
Methods
The ESRD registry committee of KSN has collected data on dialysis centers and patients through an online registry program on the KSN Internet website (http://www.ksn.or.kr) since 2001. The program also has a graphic evaluation function of dialysis adequacy (Kt/V, nPCR) and a peritoneal equilibrium test. For ensuring the security of the patient's personal information, the program was accessible only to designated dialysis staff with a hospital code and password. Information regarding non-responding dialysis centers was collected through mail questionnaires.
Data on dialysis therapy in Korea
Prevalence and incidence of end stage renal disease in Korea
At the end of 2010 in Korea, the overall ESRD patient number was 58,860, and the number of ESRD patients under maintenance hemodialysis (HD), peritoneal dialysis (PD), and with functioning transplanted kidney (KT) were 39,509, 7,309, and 12,042, respectively. The prevalence per million population (PMP) was 768.1 for HD, 142.1 for PD, 234 for KT, and 1144.4 for overall ESRD (Fig. 1A and B). These ESRD prevalence rates are similar to those in most European countries but are about 50% of those in the United States and one-third of those in Japan according to the international comparison data of the annual United States renal data report [2], [3], [4]. The annual increase in the rate of prevalence was about 10–12% during 2000–2010.
The number of new patients undergoing renal replacement therapy in 2010 was 9,335 (181.5 PMP) (Fig. 1C). The number of new ESRD patients with HD, PD, and KT were 7,204 (140.1 PMP), 867 (16.9 PMP), and 1,264 (24.6 PMP), respectively. The new PD patient number has been decreasing since 2007, whereas those of HD and KT have been increasing; this is consistent with the trend in the United States [2].
The most common causes of ESRD in new patients were diabetic nephropathy, hypertensive nephrosclerosis, and chronic glomerulonephritis (45.2%, 19.2%, and 11.3%, respectively). This is shown in Table 1. Among these three underlying diseases, the incidence of diabetic nephropathy increased quite rapidly during 1990–2000 (Fig. 1D). The proportion of diabetic nephropathy in ESRD patients in Korea was one of the highest in the world with some Asian countries and the United States [2].
Renal replacement therapy modalities
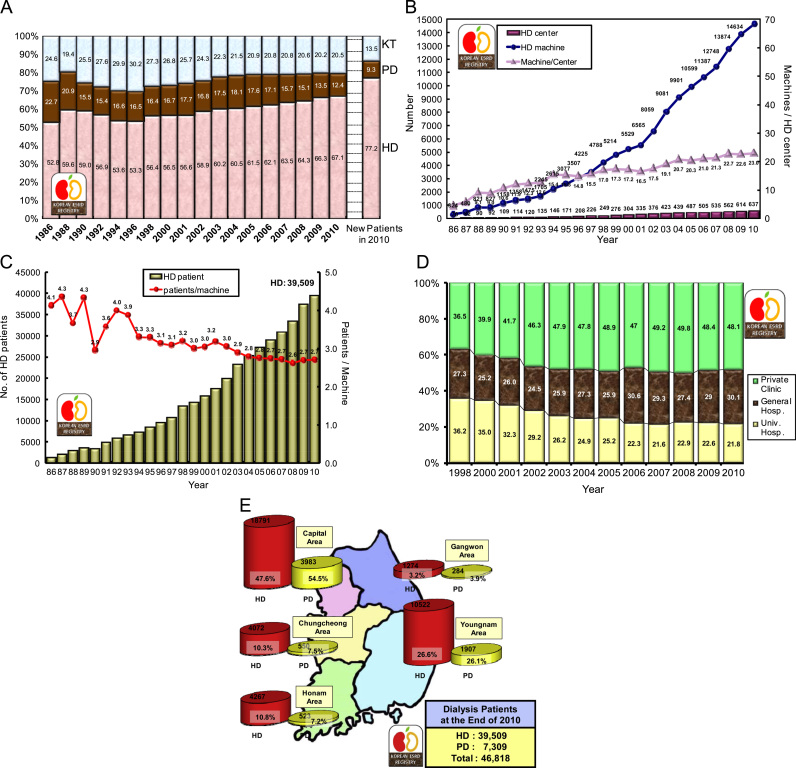
Approximately 77.2% of new ESRD patients in 2010 started renal replacement therapy with HD, whereas approximately 9.3% of patients started PD. The prevalence rates of HD, PD, and KT were 67.1, 12.4, and 20.5, respectively (Fig. 2A).
The number of HD centers and HD machines has also been increasing rapidly in Korea. At the end of 2010, Korea had 637 HD centers and 14,634 HD machines (Fig. 2B). The ratio of machines per center was 23.0, and the ratio of patients per machine was 2.7 (Fig. 2C).
Approximately one-third of maintenance HD patients were admitted in university hospitals in the late 1990s, but currently about 50% of HD patients are treated in private dialysis clinics (Fig. 2D).
Analysis of the distribution of ESRD patients according to the zones in Korea showed that approximately 50% of HD patients and more than 50% of PD patients were located in the capital area (Fig. 2E).
Dialysis patient demographics
The sex ratio of men to women was 57.6% vs. 42.4% in HD therapy and 55.6% vs. 44.2% in PD therapy (Fig. 3A).
The mean age of dialysis patients was 58.0±13.7 years. The age distribution of dialysis patients showed two peaks: One peak at the age of 50 years and another peak at the age of 65 years (Fig. 3B), indicating that at least two or more different disease groups are present among ESRD patients. The age distribution according to year since 1986 showed that the peak age has been shifting to older age and the current peak age is in the 60s (Fig. 3C). The percentage of dialysis patients aged more than 65 years increased to up to 35.0% of overall dialysis patients in 2010.
The age distribution according to underlying disease showed that the peak age of chronic glomerulonephritis was 52.1 years and that of diabetic nephropathy was 61.0 years (Fig. 3D).
About 43% of HD patients and 41% of PD patients had been undergoing dialysis for more than 5 years; these percentages had increased from 30% and 14%, respectively, in 2001 (Fig. 3E).
Approximately 51% of non-diabetic HD patients had been undergoing dialysis for more than 5 years, whereas only 29% of diabetic HD patients had been undergoing dialysis for more than 5 years. Similarly, approximately 42% of non-diabetic PD patients and 28% of diabetic PD patients had been undergoing dialysis for more than 5 years (Fig. 3F).
The mean body mass index (BMI) was 21.86±3.2 kg/m2 in HD patients and 23.51±3.6 kg/m2 in PD patients; this showed a steady increase in both HD and PD groups. In HD patients, the mean BMI was 22.35±3.3 kg/m2 in diabetic patients and was 21.54±3.1 kg/m2 in non-diabetic patients (Fig. 3G).
The mean blood pressures were similar between HD patients and PD patients (101.7±12.2 mmHg and 99.1±12.5 mmHg, respectively), but the pulse pressure was much higher in HD patients than in PD patients (63.4 vs. 53.0 mmHg). These results are shown in Fig. 3H and I. Although the blood pressure of dialysis patients is decreasing, the pulse pressure of HD patients is increasing, and this is associated with the risk of cardiovascular morbidity.
Characteristics of erythropoietin, HD, and PD therapies
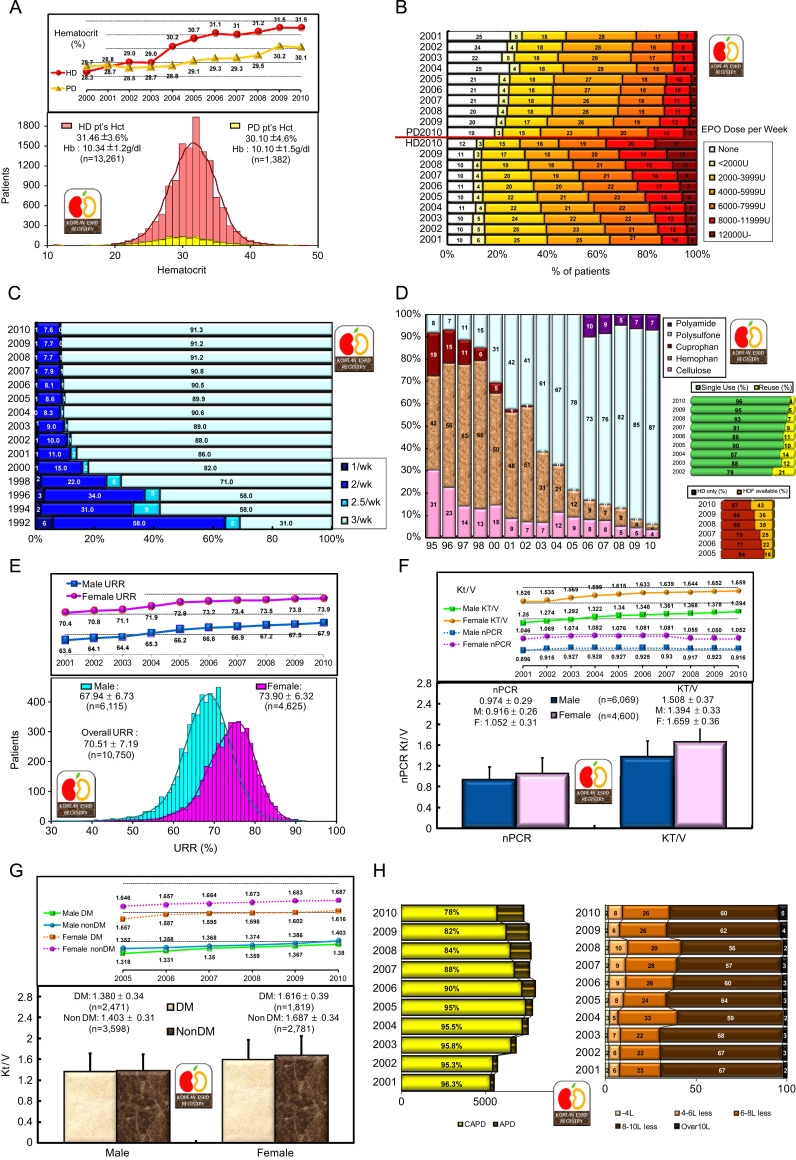
In 2010, the mean hematocrit was 31.5% in HD patients and 30.1% in PD patients; this was a relative reversal of the values from 2001 (Fig. 4A). Although PD patients theoretically have a lower prevalence of anemia than HD patients, the recent use of erythropoietin therapy has increased hematocrit values in HD patients more than PD patients. This therapeutic results is shown quite clearly in Fig. 4A and B: 31% of HD patients were injected with 8000 or more units of erythropoietin per week, whereas only 15% of PD patients were injected with this level of erythropoietin and 20% of PD patients were not injected with erythropoietin. The increase of both dialysis patients' hematocrit values in 2004 and 2005 was due to the increase in the reimbursement level of erythropoietin therapy.
Recently, most HD patients (91.3%) received dialysis three times per week (Fig. 4C). Most HD centers (87%) used polysulfone dialyzer, whereas approximately 4% of centers used a reusable dialyzer; hemodiafiltration therapy was available in 43% of dialysis centers in Korea (Fig. 4D).
The urea reduction ratio was 67.9% in male HD patients and 73.9% in female HD patients (Fig. 4E). This sex difference of dialysis adequacy resulted from the use of similar dialysis dose in men and women in spite of body mass difference between the genders. The overall mean urea reduction ratio was 70.5±7.2%; this showed a steady increase.
The average normalized protein catabolic rates and Kt/V were 0.974±0.29 and 1.508±0.37, respectively. Similar to the urea reduction ratio, both these values were higher in women than in men (Fig. 4F). Kt/V was higher in non-diabetic patients than in diabetic patients, presumably because of the quality of vascular access for dialysis (Fig. 4G).
The annual quality improvement in HD therapy is shown in Fig. 4E–G. However, the recent protein catabolic rate showed a slight decrease, presumably because of the increase in the proportion of elderly dialysis patients.
The percent of automated PD patients had increased to 22% in 2010, but the overall PD dose (dialysate amount) did not increase (Fig. 4H).
Morbidities, causes of death, and survival rates of dialysis patients
The most common complication (51%) in HD patients was vascular diseases, which included hypertension, cerebrovascular accident, and other vascular diseases (Table 2). Furthermore, 46.5% of PD patients had vascular disease, and the infection complication rate was higher in PD patients (19.1%) than in HD patients (6.5%).
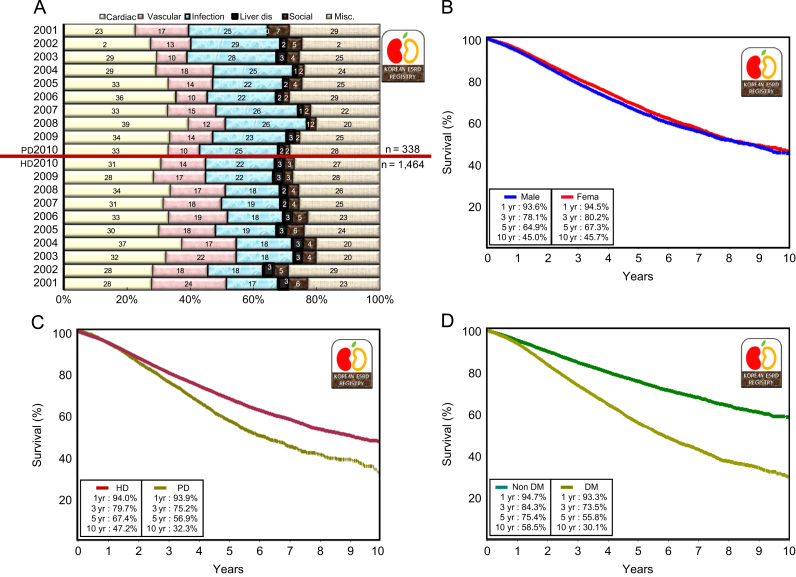
The causes of death in dialysis patients in descending order of frequency were cardiac causes, infection, and vascular disease. The cause of death was unknown or miscellaneous in one-quarter of dialysis patients (Table 3 and Fig. 5A). Some year-to-year variation was observed because of limitations in death reports.
The overall 1- and 5-year survival rates of dialysis patients were 94% and 66%, respectively (Fig. 5B). These survival rates were higher than those in the United States and Japan [2], [3], but the Korean survival rate was calculated only from registered dialysis patients from 2001. The Korean ESRD registry covers only about two-thirds of all dialysis patients in Korea because registry enrollment is voluntary.
Kidney transplantation
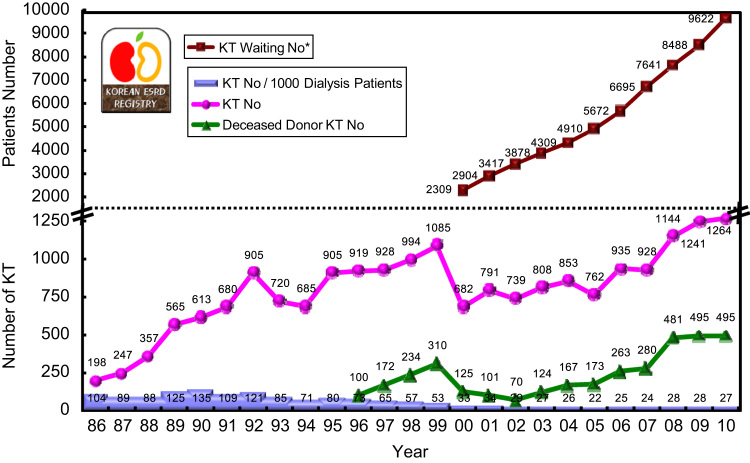
In 2010, kidney transplantation was performed in 1,264 cases, which included 495 deceased donors (Fig. 6). The kidney transplantation rate was 27 cases per 1000 dialysis patients, which was below the world average [2]. However, the waiting number has been increasing sharply, and 9,622 surviving dialysis patients were enrolled in the Korean Network of Organ Sharing waiting list at the end of 2010.
Discussion
The increasing proportion of elderly and diabetic patients in the population has resulted in a rapid increase in the number of ESRD patients, which reached 1,144 PMP at the end of 2010. A high proportion of diabetic ESRD patients (45%) and a decrease in the proportion of PD patients were recently observed. Among ESRD patients, the HD proportion has increased to 77.2% and the PD proportion has decreased to 9.3%. The adequacies of dialysis and anemia therapy have been steadily improving in Korea.


 PDF Links
 PubReader
 Full text via DOI
 Download Citation
 Print
Print


")


