Association of sarcopenia and its components with clinical outcomes in patients undergoing peritoneal dialysis
Article information

Abstract
Background
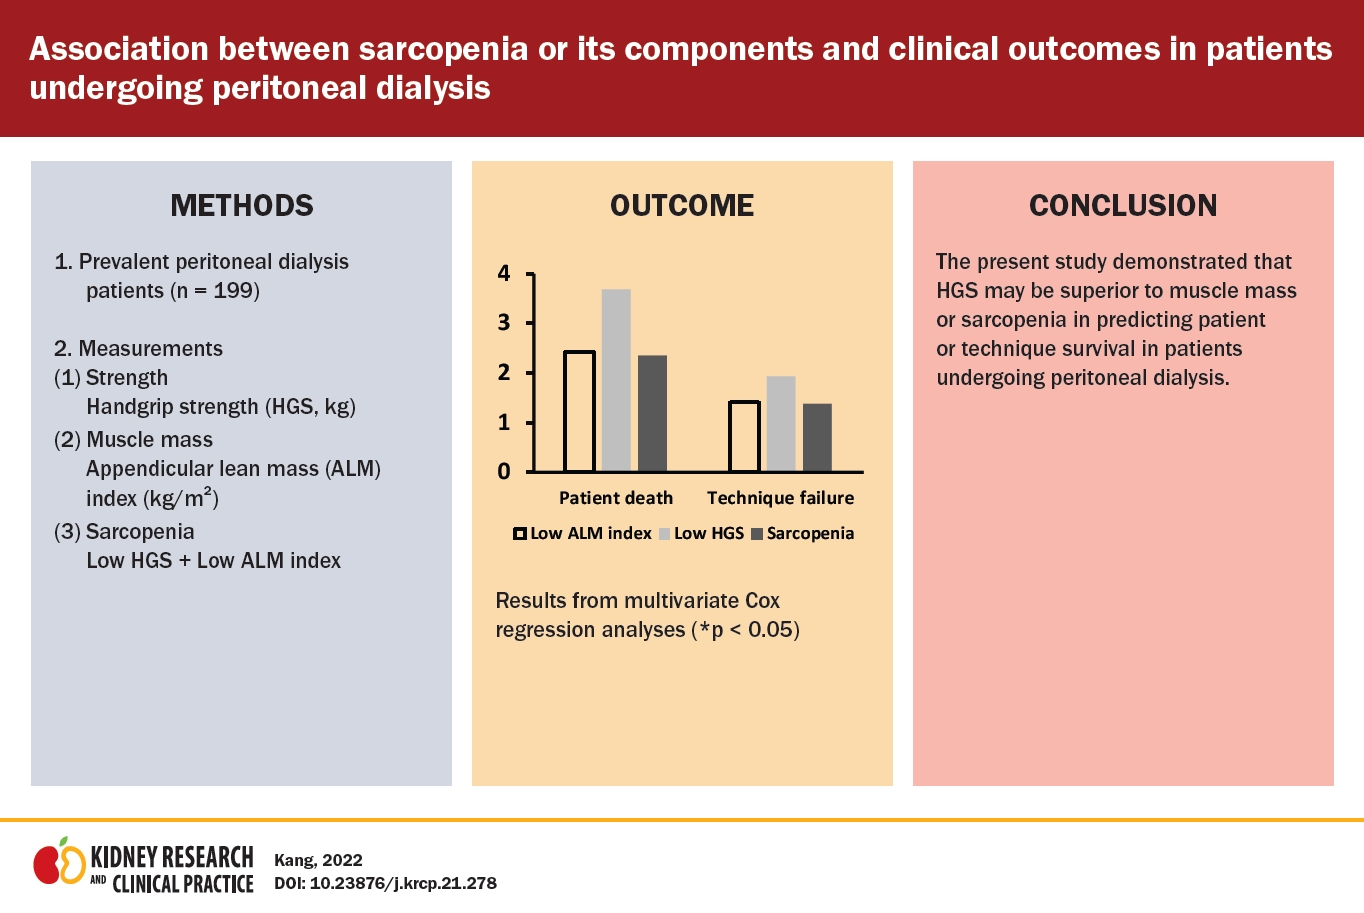
Further studies are needed to identify whether muscle mass, muscle strength, or sarcopenia is the best indicator of survival in patients undergoing peritoneal dialysis (PD). We aimed to compare the association of sarcopenia and its components with survival in patients undergoing PD.
Methods
We identified all patients with PD (n = 199). We routinely recommended handgrip strength (HGS) and lean mass measurements using dual energy X-ray absorptiometry in all patients with PD. Sarcopenia was defined using cutoff values from the Asian Working Group for Sarcopenia. We evaluated the patient and technique survival rates.
Results
The number of patients with low HGS was 95 (47.7%). The median follow-up interval was 17 months (interquartile range, 13–21 months). Kaplan-Meier curve analysis showed that patients with low HGS or sarcopenia had poorer patient and technique survival compared with patients with normal HGS or without sarcopenia. Cox regression analysis showed that patients with low HGS had greater hazard ratios for patient death and technique failure compared with those with normal HGS. However, patients with low muscle mass were not significantly higher hazard ratios for patient death or technique failure compared with those with normal muscle mass. Patients with sarcopenia had significantly greater hazard ratios for patient death or technique failure than those without sarcopenia only in univariate analysis.
Conclusion
The present study demonstrated that HGS may be superior to muscle mass or sarcopenia for predicting patient or technique survival in patients undergoing PD.
Introduction
Chronic kidney disease is a major global health concern [1]. It can progress to end-stage renal disease requiring renal replacement therapy, such as hemodialysis, peritoneal dialysis (PD), or kidney transplantation. PD is a classically important dialysis modality despite being used in only a small proportion of patients undergoing dialysis [2,3]. The survival of patients undergoing PD has continuously improved with advances in management such as volume control and exit-site or peritonitis care [2,3]. However, the improvement in long-term survival in patients undergoing PD can lead to the development of chronic complications with increasing dialysis vintage. Among the various complications in patients undergoing PD, sarcopenia is an important condition associated with high rates of disability, mortality, and morbidities [4].
Sarcopenia is diagnosed on the basis of muscle mass, muscle strength, or physical performance. The evaluation and criteria for the diagnosis of sarcopenia have been defined according to studies conducted in the general or elderly population [5]. However, it may be difficult to apply the diagnostic criteria for sarcopenia used in a general population to patients undergoing dialysis. The guidelines recommend measuring muscle mass using bioimpedance analysis (BIA) or dual energy X-ray absorptiometry (DEXA); however, these methods are influenced by volume status in patients undergoing dialysis [5,6]. Muscle mass measurements using these methods in the post-dialysis period can be applicable in patients undergoing hemodialysis; however, dry-weight measurements may be more difficult in patients undergoing PD than in those undergoing hemodialysis. Some studies have evaluated the predictive ability for mortality of muscle mass, muscle strength, and sarcopenia as composite diagnostic indicators in patients undergoing dialysis [7,8]. However, most studies have not primarily focused on identifying optimal measurements through comparison among these indicators in patients undergoing PD. Therefore, further studies are needed to identify whether muscle mass, muscle strength, or sarcopenia is the best indicator of survival in patients undergoing PD. We aimed to compare the association of sarcopenia and its components with survival in patients undergoing PD.
Methods
Study population
This retrospective longitudinal study covered the period between September 2017 and November 2020. We identified all patients with PD from a tertiary medical center. We routinely recommended handgrip strength (HGS) and lean mass measurements in all patients with incident or prevalent PD between September 2017 and November 2020. This study included 214 patients who provided informed consent and underwent the two measurements. Among these patients, nine were excluded because of missing data and six were excluded because of inability to ambulate or having an amputated limb. Therefore, 199 patients undergoing PD were finally included. Baseline parameters including HGS and lean mass index were evaluated on the same day during a peritoneal membrane equilibration test. The end point of follow-up was October 2021. This study received ethical approval from the Institutional Review Board of Yeungnam University Medical Center (No. 2021-01-033) and was conducted in accordance with the principles of the World Medical Association Declaration of Helsinki.
Baseline variables
We collected baseline data including age, sex, presence of diabetes mellitus (DM), dialysis modality (continuous ambulatory PD or automated PD), dialysis vintage (months), body mass index (kg/m2), weekly Kt/Vurea, C-reactive protein level (mg/dL), 4-hour dialysate-to-plasma creatinine ratio ( DP4Cr), urine volume (mL/day), edema index, serum calcium level (mg/dL), phosphorus level (mg/dL), sodium level (mEq/L), potassium level (mEq/L), albumin level (g/dL), normalized protein equivalent of total nitrogen appearance (nPNA, g/kg/day), and geriatric nutritional risk index (GNRI). DM was defined as a patient-reported history of DM and a DM diagnosis on medical records or use of DM medications. Weekly Kt/Vurea was calculated using 24-hour urine and dialysate collections, as previously described [9]. DP4Cr was evaluated using a modified 4.25% peritoneal equilibration test, and the ratio was calculated by dividing the creatinine level in the drained dialysate at 4 hours after infusion by the blood creatinine level. The edema index was defined as extracellular water/total body water from BIA measurements (InBody 770; Biospace, Seoul, Korea). The nPNA and GNRI levels were evaluated using equations from previous studies [10–13]. GNRI was calculated using the equation from a previous study as follows: GNRI = [14.89 × albumin (g/dL)] + [41.7 × (body weight/ideal body weight)] [11]. Ideal body weight was calculated using the Lorentz equation derived from height [11].
Assessment of sarcopenia components and outcome
Lean mass was measured using DEXA. The measurements were performed after dialysate drainage, with the patients in the supine position and wearing a light gown. Images were obtained using a Discovery QDR Series bone densitometer (Hologic, Madison, WI, USA) and analyzed using the Hologic Discovery Wi software version 13.3. Appendicular lean mass (ALM) index (kg/m2) was defined as the sum of the lean mass in the upper and lower extremities divided by height squared.
HGS was measured in all patients using a digital dynamometer (Takei 5401; Takei Scientific Instruments Co., Ltd, Niigata, Japan). Each patient performed three trials with the dominant hand. In our study, sarcopenia was defined as having both a low ALM index and low HGS. The cutoff values for a low ALM index or low HGS were defined using those from the Asian Working Group for Sarcopenia consensus [5], with low ALM defined as an ALM index of <7.0 kg/m2 for male patients and <5.4 kg/m2 for female patients, as measured using DEXA, and low HGS defined as <26 kg for male and <18 kg for female.
We evaluated patient and technique survival rates. Patient death was defined as death regardless of cause until the end point of follow-up. Data for patients with kidney transplantation, conversion to hemodialysis (for ≥90 consecutive days), cessation of dialysis owing to renal recovery, loss to follow-up, or transfer to another hospital were considered censored data. Technique failure was defined as patient death or conversion to hemodialysis for ≥90 consecutive days [14].
Statistical analysis
Data were analyzed using the statistical software SAS version 9.4 (SAS Institute, Cary, NC, USA). Categorical variables are expressed as counts (percentages) and were analyzed using Pearson chi-square test or Fisher exact test. Continuous variables were evaluated for distribution using the Kolmogorov-Smirnov test. These variables are presented as mean ± standard deviation for those with a normal distribution and median (interquartile range, IQR) for those with a non-normal distribution. Continuous variables with a non-normal distribution were compared using the Mann-Whitney U test and those with a normal distribution were compared using Student t test. Kaplan-Meier analysis was used to plot survival curves among the groups, and the log-rank method was used to determine statistical significance. Survival estimates were calculated using Cox regression analyses. Multivariate analyses were performed with age, sex, presence of DM, urine volume, serum albumin level, dialysis vintage, and edema index as covariates. We performed multivariate Cox regression analyses using the enter method. The proportional hazard assumption was satisfied for all variables. The area under the receiver operating characteristic curve (AUROC) was calculated to determine the ability of each indicator to predict mortality. Following the methodology of Pencina et al. [15,16], we further calculated the integrated discrimination improvement (IDI) and net reclassification improvement (NRI) values, with a category-free option among the models.
Because of differences in the baseline characteristics of the participants between the low and normal HGS groups, a propensity analysis was performed to minimize bias. To balance the baseline characteristics between low and normal HGS groups, we estimated propensity scores using logistic regression models and the following variables: age, sex, and DM. Participants in the low HGS group were matched with participants in the normal HGS group using 1:1 nearest neighbor matching without replacement and with a matching tolerance (caliper) of 0.2; the nearest neighborhood matching was based on propensity scores. Before the groups were matched, the standardized mean difference was 0.734, and after matching, the standardized mean difference was 0.105. The level of statistical significance was set at p < 0.05.
Results
Participant clinical characteristics
The number of patients with low HGS was 95 (47.7%), and the HGS in the normal and low HGS groups was 29.0 kg (IQR, 23.0–33.9 kg) and 17.2 kg (IQR, 13.9–20.8 kg), respectively. The HGS values in the normal and low HGS groups were 32.4 kg (IQR, 29.0–36.8 kg) and 21.0 kg (IQR, 18.3–23.2 kg) in male participants and 20.7 kg (IQR, 19.4–23.2 kg) and 14.1 kg (IQR, 12.8–16.5 kg) in female participants (p < 0.001 for both sexes). The mean age in the normal and low HGS groups was 52.8 ± 11.9 and 58.6 ± 11.9 years, respectively (Table 1). The male patient proportion, serum albumin level, and ALM index were greater in the normal HGS group than in the low HGS group. The edema index was greater in the low HGS group than in the normal HGS group. No significant differences were observed in the proportion of patients with DM, use of automated PD, dialysis vintage, weekly Kt/Vurea, C-reactive protein level, DP4Cr, urine volume, calcium level, phosphorus level, sodium level, potassium level, or nPNA between the two groups. The number of patients with low muscle mass was 122 (61.3%) and that of patients with sarcopenia was 64 (32.2%). The number of incident PD patients with PD durations of <3 months was eight (4.0%). We did not perform subgroup analyses with incident or prevalent PD patients due to the small number of incident PD patients.

Participants’ clinical characteristics
Association between sarcopenia components and survival
The number of patient deaths and technique failures was 26 (13.1%) and 41 (20.6%), respectively. The number of patient deaths and incidence of technique failure was 4 (3.8%) and 13 (12.5%) in the normal HGS group and 22 (23.2%) and 28 (29.5%) in the low HGS group (p < 0.001 for patient deaths and p = 0.005 for technique failure). The causes of patient death were cardiovascular disease (12 patients, 46.2%), infection (10 patients, 38.5%), malignancy (two patients, 7.7%), cachexia (one patient, 3.8%), and cerebral hemorrhage (one patient, 3.8%). The reasons for technique failure were patient death (26 patients, 63.4%), PD peritonitis (nine patients, 22.0%), catheter malfunction (two patients, 4.9%), malignancy (two patients, 4.9%), tunnel infection (one patient, 2.4%), and uremic symptom (one patient, 2.4%).
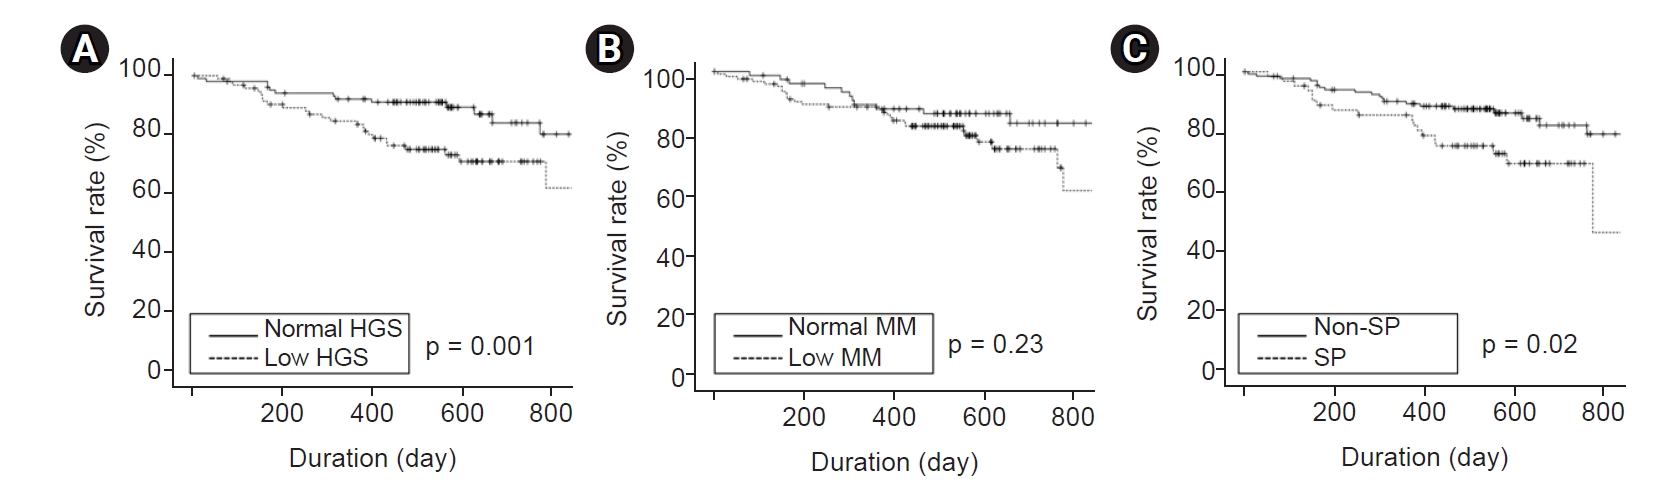
The median follow-up interval was 17 months (IQR, 13–21 months). Kaplan-Meier curve analysis showed that patients with low HGS or sarcopenia had poorer patient and technique survival compared with patients with normal HGS or without sarcopenia (Fig. 1, 2). However, there were no significant differences in patient or technique survival between patients with low muscle mass and those with normal muscle mass.

Kaplan-Meier curves of patient survival according to SP components.
(A) The patient survival rates in patients with normal and low HGS were 98.0% and 93.4% at 200 days and 96.9% and 75.4% at 600 days, respectively. (B) The patient survival rates in patients with normal and low MM were 98.7% and 94.0% at 200 days and 92.6% and 82.5% at 600 days, respectively. (C) The patient survival rates in patients without and with SP were 97.7% and 91.8% at 200 days and 93.4% and 73.0% at 600 days, respectively.
HGS, handgrip strength; MM, muscle mass; SP, sarcopenia.
Kaplan-Meier curves of technique survival according to SP components.
(A) The technique survival rates in patients with normal and low HGS were 94.1% and 89.2% at 200 days and 89.3 and 71.0% at 600 days, respectively. (B) The technique survival rates in patients with normal and low MM were 96.0% and 89.1% at 200 days and 86.1% and 76.7% at 600 days, respectively. (C) The technique survival rates in patients without and with SP were 94.0% and 87.2% at 200 days and 86.2% and 69.3% at 600 days, respectively.
HGS, handgrip strength; MM, muscle mass; SP, sarcopenia.
Univariate Cox regression analysis showed that patients with low HGS had a hazard ratio of 7.45 (95% confidence interval [CI], 2.55–21.73; p < 0.001) for patient death compared with those with normal HGS (Table 2). Multivariate analyses showed the same trends as univariate analysis, and technique failure showed similar trends to patient death. However, patients with low muscle mass did not show significant hazard ratios for patient death or technique failure compared with those with normal muscle mass on univariate and multivariate analyses. Patients with sarcopenia had significantly greater hazard ratios for patient death or technique failure than those without sarcopenia only in univariate analysis.

Cox regression analyses for patient death or technique failure according to sarcopenia components
Cox regression analyses by sex (Supplementary Table 1, available online) showed that patient survival was associated with low HGS in male patients and low HGS and sarcopenia in female patients. Technique survival was associated with low HGS in women. However, multivariate analyses did not show statistical significance between patient or technique survival rates and the three indicators in either sex.
In addition, we performed survival analysis with propensity score matching. There were no significant differences in age, sex, or presence of DM (Supplementary Table 2, available online). Kaplan-Meier curves also showed that patients with normal HGS had better patient and technique survival rates compared to those with low HGS (Supplementary Fig. 1, available online). Furthermore, we performed Cox regression analysis using a propensity score-matched cohort (Supplementary Table 3, available online). Although statistical significance was weak compared to analysis using the total cohort, the trends were similar.
Comparison of other indices for outcomes
In male patients, the AUROC of the indicators for patient death at the end point of follow-up was 0.61 (95% CI, 0.52–0.70) for the ALM index, 0.62 (95% CI, 0.53–0.71) for GNRI, and 0.71 (95% CI, 0.62–0.79) for HGS (Fig. 3). In female patients, the AUROC was 0.59 (95% CI, 0.48–0.70) for the ALM index, 0.70 (95% CI, 0.59–0.79) for GNRI, and 0.89 (95% CI, 0.80–0.95) for HGS. No significant differences in AUROC were observed among the three indicators in male patients; however, HGS was superior to the ALM index or GNRI in female patients (in male: ALM index vs. GNRI, p = 0.93; ALM index vs. HGS, p = 0.45; GNRI vs. HGS, p = 0.40; in female: ALM index vs. GNRI, p = 0.22; ALM index vs. HGS, p < 0.001; GNRI vs. HGS, p = 0.01).
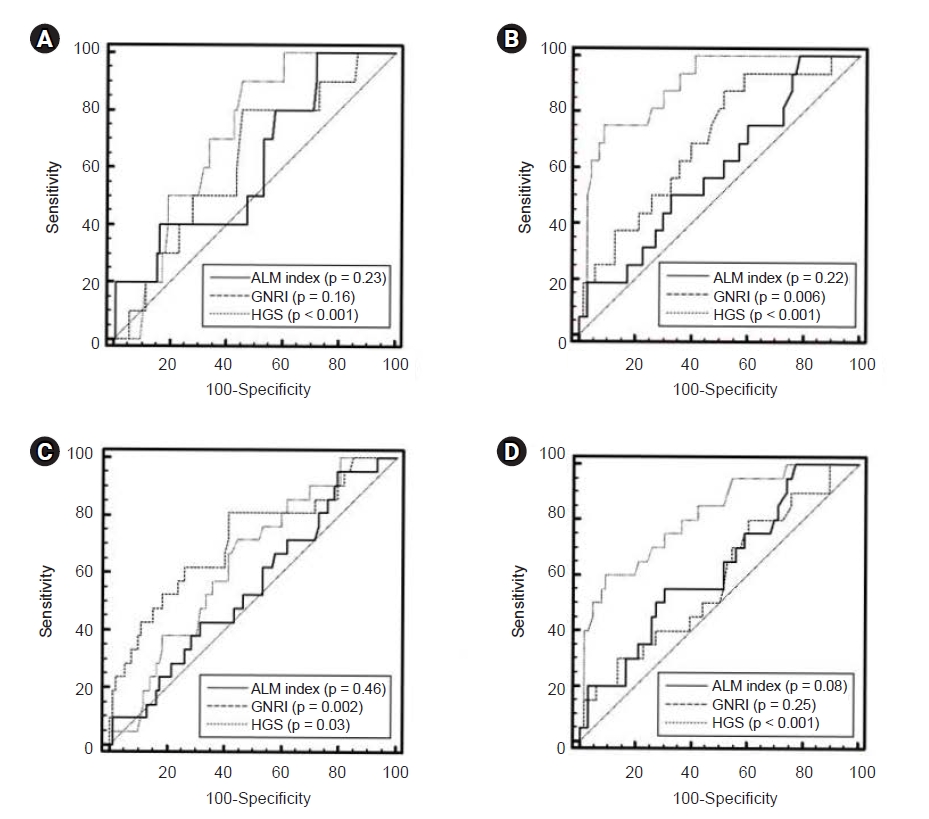
Receiver operating characteristic curves of indicators used to predict patient death or technique failure at the end point of follow-up.
Curves of indicators for predicting patient death in male (A) and female patients (B). Curves of indicators for predicting technique failure in male (C) and female patients (D).
ALM, appendicular lean mass; GNRI, geriatric nutritional risk index; HGS, handgrip strength.
In male patients, the AUROC of the indicators for technique failure at the end point of follow-up was 0.55 (95% CI, 0.45–0.64) for the ALM index, 0.71 (95% CI, 0.62–0.79) for GNRI, and 0.64 (95% CI, 0.54–0.73) for HGS. In female patients, the AUROC was 0.62 (95% CI, 0.51–0.73) for the ALM index, 0.59 (95% CI, 0.48–0.69) for GNRI, and 0.82 (95% CI, 0.72–0.89) for HGS. No significant differences in AUROC were found among the three indicators in male patients; however, HGS was superior to the ALM index and GNRI in female patients (in male: ALM index vs. GNRI, p = 0.05; ALM index vs. HGS, p = 0.29; GNRI vs. HGS, p = 0.23; in female: ALM index vs. GNRI, p = 0.69; ALM index vs. HGS, p = 0.03; GNRI vs. HGS, p = 0.002).
In order to estimate the incremental value of low HGS in terms of its association with patient death or technique failure, the probability of events and non-events in models using relative IDI and category-free NRI values was compared (Supplementary Table 4, available online). For patient deaths, the AUROCs in the models without or with low HGS were 0.811 and 0.836, respectively. The difference between AUROCs was 0.025 and were the greatest among those with low HGS, low muscle mass, and sarcopenia. The relative IDI and category-free NRI values were 0.176 and 0.776, respectively, and statistical significance was observed between the two models. The models revealed that the addition of low HGS in the multivariate model was associated with greater predictability of patient death than models excluding low HGS. In terms of technique failure, the statistical significance in the difference between the AUROCs was weak, but the trend was similar to that of patient death.
Discussion
Our study included patients with prevalent or incident PD. We evaluated two indicators of sarcopenia (HGS as an indicator of muscle strength and muscle mass index measured using DEXA) and assessed the patient and technique survival rates according to muscle mass, HGS, or sarcopenia. We performed Kaplan-Meier curve, univariate and multivariate Cox regression, and AUROC analyses. The results of our analyses mostly showed that HGS was a better predictor of patient or technique survival than low muscle mass or sarcopenia.
Previous studies have evaluated the association between sarcopenia and its components and mortality in patients undergoing PD or patients with other comorbidities. Kim et al. [8] enrolled 131 patients undergoing PD and showed that low HGS had lower predictive ability for mortality than change in the lean or fat tissue index. However, they evaluated muscle mass using BIA and multivariate analysis included coronary artery disease and peripheral artery disease as covariates. The proportions of these problems were very small, which may have led to statistical bias. Isoyama et al. [7] enrolled 330 patients undergoing dialysis and showed that low HGS was more strongly associated with mortality than low muscle mass. However, their study did not include data on dialysis modality. Some studies have evaluated various indices of muscle mass and showed the association between these indices and mortality in patients undergoing PD; however, they did not include data on HGS [17–22]. Kamijo et al. [23] evaluated sarcopenia using muscle mass and strength and showed a positive association between the presence of sarcopenia and mortality, but did not perform analyses of sarcopenia components. Vogt et al. [24] enrolled 265 patients undergoing dialysis and showed the association between HGS and mortality; however, their study did not include data on muscle mass. Other studies enrolled patients with chronic liver disease, reduced ejection fraction heart failure, or older age and showed that low HGS was superior in predicting mortality [25–27]. Previous studies evaluated the association between sarcopenia or its components and mortality in various populations. However, few studies have compared sarcopenia components in terms of predicting mortality in patients undergoing PD. Moreover, muscle measurements using DEXA can also be considered a strength of this study compared with previous studies.
The difference between HGS and muscle mass in statistical significance may be related to two issues. First, inaccuracy in muscle mass measurements may be associated with this discrepancy in patients undergoing PD. Although muscle mass measurements using DEXA are recommended in patients undergoing PD, the measurements can be influenced by volume overload [6], which results in overestimation of muscle mass and thereby underestimation of the proportion of patients with low muscle mass [28]. Furthermore, HGS was superior to sarcopenia in predicting mortality in our study. Muscle mass in patients with low HGS may be overestimated in the presence of volume overload, which can lead to misdiagnosis in patients with sarcopenia. Second, patients undergoing dialysis are prone to insulin resistance, potentially leading to fatty infiltration within muscles [4]. Fatty infiltration in muscle in patients undergoing PD compared with the general population can result in overestimation of the functional units of muscle mass.
A sex difference in mortality prediction was an important finding of our study. Our results showed a clearer superiority of HGS in predicting mortality in female patients than in male patients. Female patients have relatively low muscle mass, and muscle strength can be more greatly influenced by neural activation or muscle architecture than muscle mass [29,30]. Therefore, the decline in muscle mass is limited in female patients compared with male patients, and factors other than muscle mass may lead to decline in strength. Consequently, HGS per se and these causal factors together may lead to high mortality.
In our study, sarcopenia was defined using the Asian Working Group for Sarcopenia consensus. Most of the diagnostic measurements and cutoff values for diagnosis of sarcopenia were derived from the general population. These guidelines suggest the use of muscle mass measurements using DEXA or BIA; however, muscle mass measurements using these are not accurate in dialysis patients [5,31–33]. Previous studies showed that these two measurements were influenced by volume status; thus, it would be difficult to apply the diagnostic criteria from the general population [28,34]. Nevertheless, there are no specific diagnostic criteria for sarcopenia in dialysis patients. Previous studies have defined sarcopenia according to diagnostic criteria from the general population and showed a positive association between clinical outcomes and sarcopenia, despite limitations in muscle mass measurements [35]. Furthermore, the guidelines from the Asian Working Group for Sarcopenia, which were derived from Asian populations, may be better criteria regarding the ethnic characteristics of Asian dialysis patients [5].
In the general population, DEXA is the gold standard for the estimation of muscle mass. Validation studies showed that BIA is an alternative method with considerable agreement compared to DEXA. However, volume overload is associated with overestimation of muscle mass measurements. Measurement during dry weight would attenuate overestimation of muscle mass measurements. Recent Kidney Disease Outcomes Quality Initiative (KDOQI) guidelines noted that body composition measurements using BIA can be applicable in hemodialysis patients at the time of dry weight after hemodialysis [6]. In addition, Raimann et al. [36] evaluated the accuracies of extracellular and intracellular water using BIA compared to gold standard methods such as the dilution method in hemodialysis patients. Their study showed that errors in accuracy exist but are comparable in magnitude to the errors found in measurements using dilution methods. The accuracy of BIA in the volume assessment of PD patients would be similar to that for hemodialysis patients. However, the guidelines did not suggest the use of BIA for body composition measurements in PD patients. Regression equations for the estimation of muscle mass are derived from the general population, and muscle mass measurements using these equations would be not accurate, despite accurate volume estimations. The KDOQI guidelines suggest that DEXA is a reasonable method for assessing body composition, as the method is the gold standard for measuring body composition, despite being influenced by volume [6]. Therefore, muscle mass index was estimated using DEXA in our study.
In our study, Fig. 3 shows the AUROCs for predicting patient death or technique failure according to ALM index, HGS, and nutritional indicator values. We used the GNRI as the nutritional index. The GNRI originated from the nutritional risk index, which includes serum albumin and weight loss values as opposed to body weight values [11]. However, it is difficult to measure usual body weight in geriatric patients. Weight changes were replaced by changes in ideal body weight that were derived from height. Rather than single markers such as albumin or body mass index, composite nutritional indices using various indicators would be better for predicting nutritional status or clinical outcomes [6]. Many composite nutritional indices have been introduced, and indices using three or more indicators may be better at predicting nutritional statuses or clinical outcomes than those using only one or two indicators. The KDOQI guidelines recommend the use of subjective global assessment (SGA) values or malnutrition inflammation scores (MIS) among many composite nutritional indices in chronic kidney disease patients [6]. SGA and MIS include 7 and 10 components, respectively, and many studies have proven their validity and reliability [6]. However, the GNRI includes only two components and has not been validated as thoroughly as the other two indices. In our center, composite nutritional indices were not routinely evaluated. In addition, our study was a retrospective study. Therefore, our study did not include data for SGA or MIS as well-validated methods. Although the use of the GNRI was not strongly recommended in the KDOQI guidelines, GNRI values can be calculated using three variables, including participants’ current serum albumin, body weight, and height. Furthermore, GNRI values may be better indicators in patients with volume overload compared to serum albumin levels alone [37,38]. Volume overloading can lead to underestimation of serum albumin levels; however, underestimation of serum albumin levels by volume may be attenuated due to overestimation of actual body weight. Although there were insufficient data regarding the changes in GNRI values by volume overload, previous studies have shown that the GNRI is a prognostic and nutritional indicator in dialysis patients [12,13]. On the other hand, the GNRI was originally developed for geriatric participants aged ≥65 years [11]. However, some studies have evaluated the clinical usefulness of the GNRI in dialysis patients aged <65 years. Park et al. [39] enrolled hemodialysis patients with a mean age of 56.2 years, and two studies enrolled PD patients with mean ages of 52.5 and 50.2 years [13,40]. All three studies showed an association between GNRI values and mortality.
In our center, both body composition measurements and HGS were annually evaluated. As the KDOQI guidelines point out, HGS is useful for identifying protein energy wasting and functional status [6]. Muscle mass measurements using DEXA or BIA are influenced by volume status, and changes in muscle strength may develop before changes in muscle mass occur. Therefore, if muscle mass measurements are evaluated exclusively, patients with early changes in muscle composition or with volume overloading would be misdiagnosed as normal. In our center, if patients exhibit decreasing trends in HGS compared to baseline, clinicians advise them of the clinical importance of low HGS and recommend nutritional support and exercise. Furthermore, our clinicians evaluate whether there are other possible etiologies responsible for decreasing HGS, such as infection.
There is no agreement on a uniform definition of technique failure in PD patients. Technique failure can be defined as conversion to hemodialysis alone or a composite of patient death (regardless of cause) and conversion to hemodialysis [14]. In our study, technique failure was defined as the composite of patient death or conversion to hemodialysis. Lan et al. [14] commented that censoring for patient death can lead to overestimation of risk event estimates and suggested the use of technique failure defined as a composite of patient death or conversion to hemodialysis. However, patient death-censored technique failure should also be reported separately. Our study did not present results for patient death-censored technique failure. Kaplan-Meier curves using patient death-censored technique failure might not completely coincide with those from patient death or technique failure based on our definition. However, considering the similar trends in patient survival curves and technique survival curves obtained with our definition, the patient death-censored technique failure curve would likely show a similar trend.
Our study had inherent limitations, including its single-center and retrospective nature. Muscle mass measurement using DEXA can be influenced by volume status despite being a gold standard method, and our data did not include information on muscle architecture or neural factors associated with strength. In addition, we did not collect data on repeated or longitudinal measurements and the follow-up interval was relatively short. Furthermore, our study did not include physical performance parameters such as gait speed. Weak statistical significance in some analyses, such as Cox regression analyses by sex, also limited the strength of our study. Despite favorable trends in low HGS, statistical non-significance could be associated with a small sample size. Analyses using a larger sample size may be useful to identify statistically significant indicators in multivariate analyses. A prospective longitudinal study including volume-independent muscle measurement, repeated measurements, or physical performance data and with a larger number of patients is warranted to overcome these limitations.
The present study demonstrated that HGS may be superior to muscle mass and sarcopenia in predicting patient or technique survival in patients undergoing PD. The routine evaluation of HGS may allow clinicians to identify risk of sarcopenia and provide patients with proper intervention before progression to severe sarcopenia.
Notes
Conflicts of interest
The authors have no competing interests to declare.
Funding
This work was supported by a 2020 Yeungnam University Research Grant (220A480015). The funder had no role in the study design; collection, analysis, and interpretation of data; writing of the report; or the decision to submit the article for publication.
Authors’ contributions
Conceptualization: SHK, JYD
Formal analysis: SHK
Methodology: SHK, AYK
Project administration: SHK, JYD
Writing–original draft: SHK, AYK
Writing–review & editing: SHK, AYK
All authors read and approved the final manuscript.
Supplementary Materials
Supplementary data are available at Kidney Research and Clinical Practice online (https://doi.org/10.23876/j.krcp.21.278).