The effects of socioeconomic status on major adverse cardiovascular events: a nationwide population-based cohort study
Article information

Abstract
Background
Although multiple factors influence the risk of major adverse cardiovascular events (MACE), the effects of socioeconomic status on MACE in the presence and absence of renal dysfunction (RD) have not been comprehensively explored in Korea.
Methods
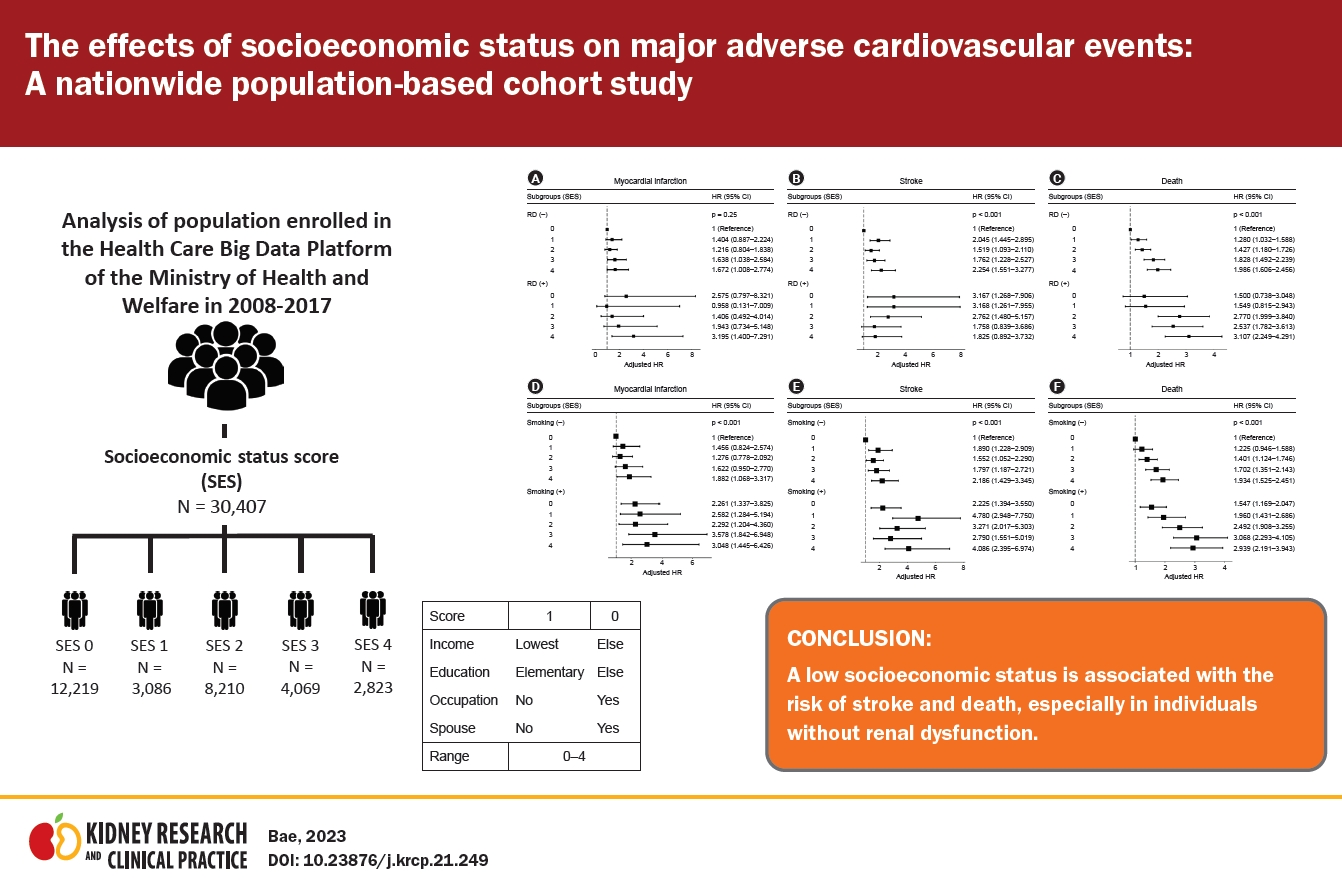
We examined the effects of socioeconomic status on MACE in individuals with and without RD. The data of 44,473 Koreans from 2008 to 2017 were obtained from the Health Care Big Data Platform of the Ministry of Health and Welfare in Korea. Their socioeconomic status was assessed using a socioeconomic score (SES) based on marital status, education, household income, and occupation. The incidence of myocardial infarction (MI), stroke, and death was compared according to SES level (0–4). Multiple linear regression analysis was used to evaluate the hazard ratios and 95% confidence intervals for outcomes based on participant SES.
Results
MI risk was only affected by education level. The participants’ income, education, and SES affected their stroke risk, whereas death was associated with all four socioeconomic factors. The incidence of stroke and death increased as SES worsened (from 0 to 4). SES was positively related to risk of stroke and death in participants without RD. SES did not affect MI, stroke, or death in participants with RD.
Conclusion
A low socioeconomic status is associated with risk of stroke and death, especially in individuals without RD.
Introduction
Sociologists have long known that social integration [1,2] and socioeconomic status [3] are the strongest predictors of human mortality risk. Equitably delivering high-quality care is an important goal of a high-performing health system. Disparities related to socioeconomic status are of particular concern in the field. Several studies have identified sociodemographic disparities in the incidence of diseases, prevalence of risk factors, and life expectancy [4–7]. In developed countries, a low socioeconomic status tends to increase the risk of cardiovascular disease in men and women [8,9]. However, the results for individual socioeconomic factors have been inconsistent. Moreover, the complex relationships between socioeconomic factors (e.g., household income, education level, marital status, and occupation) and major adverse cardiovascular events (MACE) have not been fully elucidated. Most previous studies have focused on specific socioeconomic factors and not on the combined effects of socioeconomic factors [10].
In addition, simultaneous analysis of the underlying relationships between the complex effects of socioeconomic status and MACE will provide important information on the different pathways through which socioeconomic status, social support, and social network influence public health. Ultimately, the findings of such an analysis would provide evidence that could help in the development and testing of further intervention strategies for reducing public health disparities. Therefore, this study aimed to verify the relationships between mixed socioeconomic factors and MACE in individuals with and without renal dysfunction (RD).
Methods
Study design and database
Public institutions related to health care each store and manage data in their own domains. In Korea, the Health Insurance Review and Assessment (HIRA) service is in charge of drug prescriptions and treatment details, and health checkups are handled by the National Health Insurance Service (NHIS) and the Korea National Health and Nutrition Examination Survey (KNHANES) of the Korea Centers for Disease Control and Prevention. Although large amounts of data are available, it would be very difficult to conduct a comprehensive study linking data dispersed by different institutions. The Ministry of Health and Welfare publicly launched the “Health Care Big Data Platform” in 2020. This platform is owned by the public institutions NHIS, HIRA, Korea Centers for Disease Control and Prevention, and the National Cancer Center to help medical research and policy improvement by linking big data. As the data involve sensitive health and medical information, they are encrypted before transmission on an administrative network between public institutions. To minimize the risk of leakage of personal information, technical (de-identification) measures have been taken to protect and anonymize personal information.
In this study, data from the Health Care Big Data Platform of the Ministry of Health and Welfare in Korea were used. Data from KNHANES 2008–2017 were combined with the medical records and death data from the HIRA and NHIS. The KNHANES consists of health checkups, health interview surveys, and nutrition surveys conducted by trained investigation team members (examiners and interviewers) [11]. A total of 44,473 participants participated in the KNHANES 2008–2017. We excluded 4,772 participants who were <40 years old; 1,768 with previous myocardial infarction (MI); 2,766 with previous stroke; and 4,760 participants with missing data. Thus, data from a total of 30,407 participants were analyzed in this study (Fig. 1).
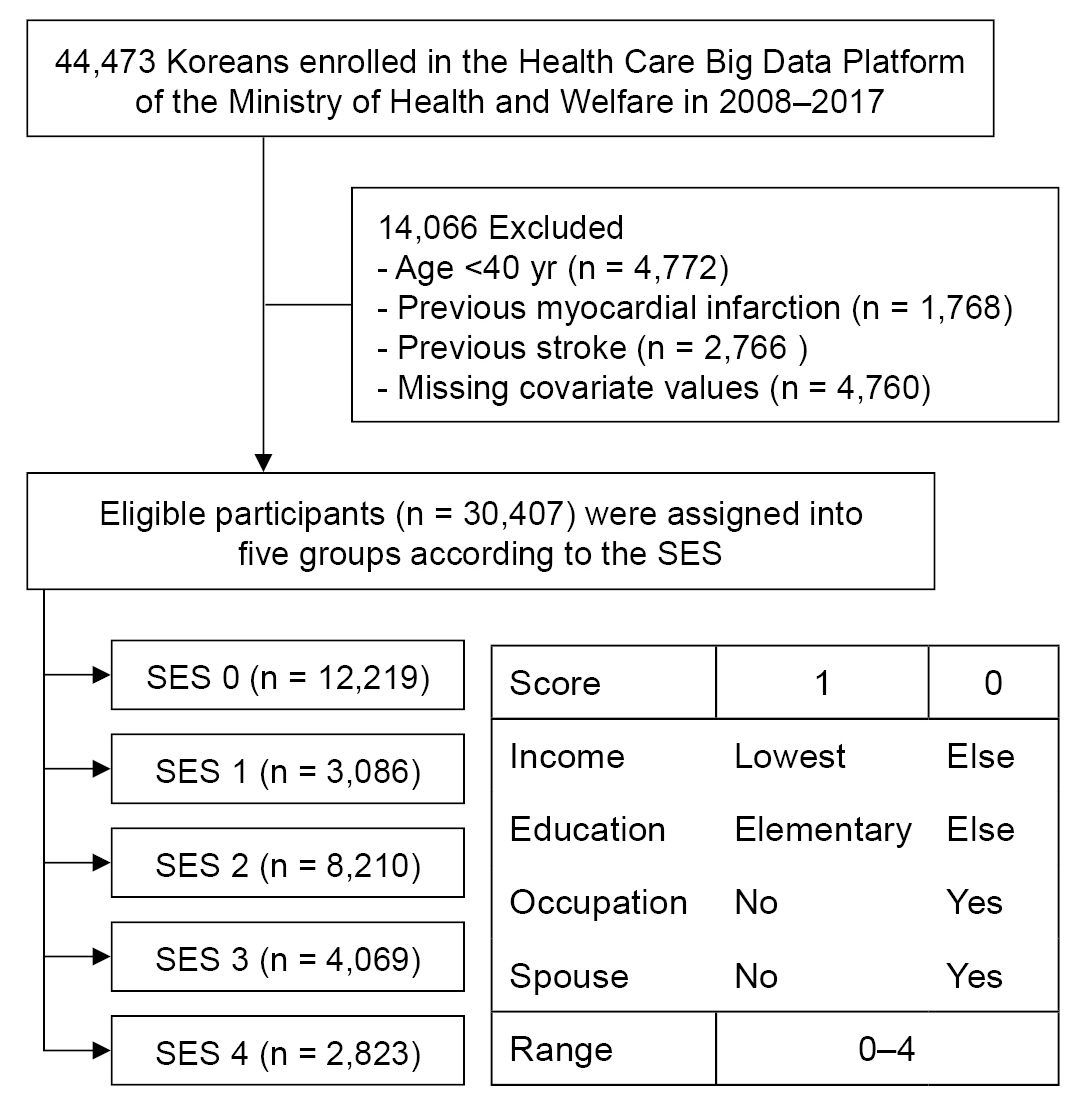
Flow diagram of the study and definition of the socioeconomic status score (SES).SES was defined as a score incorporating income, education, occupation, and marital status, ranging from 0 to 4.
This study was approved by the Institutional Review Board of Chonnam National University Hospital in Korea (No. CNUH-EXP-2019-299) and by the Institutional Review Board of the National Evidence-based Healthcare Collaborating Agency (No. NECAIRB20-016-1), and informed consent was waived. This study meets the ethical principles of the Helsinki Declaration for medical research involving human participants.
Data collection
Information on household income, education level, marital status, and occupation was collected. Household income was classified into two groups, with the baseline set at the lowest quartile. Education level was classified into two groups: 0–6 years of education (baseline) and >6 years of education. Information on marital status (living with or without a spouse) and occupation status (with or without occupation) was also collected. For baseline characteristic evaluation, the education level was classified into four groups: years of education ≤6 (elementary), ≤9 (middle), ≤12 (high), or ≥12 (college). Economically inactive populations, such as the unemployed, students, and housewives, were classified as unemployed. In the KNHANES data, occupational classification is divided into 10 major classifications based on the International Standard Occupational Classification (ISCO-08).
Data on general health behaviors, such as current smoking status, alcohol consumption, and physical exercise, were collected using a self-report questionnaire. Smoking status was classified into three categories: never smoker, former (ex-) smoker, and current smoker. Alcohol consumption status was classified into three categories: none, mild, and heavy (drinking ≥30 g/day). Physical exercise was classified into two categories based on a modified form of the International Physical Activity Questionnaire for Koreans [12]: regular walking and non-regular walking. Regular walking was defined as walking more than five times a week for >30 minutes per session.
Participant height, weight, and waist circumference (WC) were measured in casual clothes. Height was measured with an accuracy of 0.1 cm using a portable stadiometer (Seca 225; Seca GmbH), and weight was measured to the nearest 0.1 kg using an electronic scale (GL-6000–20; CASKOREA). WC was measured to the nearest 0.1 cm at the end of expiration at the midpoint of the lower margin of the ribcage and the iliac crest in the participant’s mid-axillary line using a measuring tape (Seca 200; Seca GmbH). Body mass index (BMI) was calculated by dividing weight in kilograms by height in meters squared (kg/m2) [13].
Definitions of chronic diseases
The socioeconomic score (SES) was defined as a score incorporating income, education, occupation, and marital status, ranging from 0 to 4 (Fig. 1). Chronic disease was defined based on a doctor’s diagnosis or a history of treatment for the following diseases: cardiovascular disease (e.g., angina pectoris, MI, and stroke), diabetes mellitus (DM), hypercholesterolemia, and hypertension (HTN). RD was defined as an estimated glomerular filtration rate (eGFR) of <60 mL/min/1.73 m2, calculated using KNHANES data in the Modification of Diet in Renal Disease equation [12, 14].
Study outcomes
The endpoints of the study were newly diagnosed MI, stroke, or death. MI was defined as International Classification of Diseases, 10th edition (ICD-10) (Supplementary Table 1, available online) codes I21 or I22 during hospitalization or the presence of at least two records of these codes. Stroke was defined by ICD-10 codes I63 or I64 during hospitalization with claims for brain magnetic resonance imaging or brain computed tomography. Although it was difficult to clearly define the stroke subtype (ischemic vs. hemorrhagic), we attempted to exclude cerebral hemorrhage. The study population was followed from baseline to the date of death or cardiovascular event or until December 31, 2018. Participants without MI or stroke during the follow-up period were considered to have completed the study at the date of death or the end of follow-up.
Statistical analysis
Baseline characteristics are presented as mean ± standard deviation or number (percentage). The incidence rate of primary outcomes was calculated by dividing the number of incident cases by the total follow-up duration (person-years). Hazard ratios (HRs) and 95% confidence intervals (95% CIs) for MI, stroke, and death were analyzed using the Cox proportional hazards model for SES. The multivariate-adjusted proportional hazards model was applied, in which model 1 was not adjusted; model 2 was adjusted for age and sex; and model 3 was further adjusted for smoking, alcohol drinking, regular walking, DM, HTN, and dyslipidemia. In subgroup analyses for RD, the HR (95% CI) of SES was compared with SES of 0 as the reference. Statistical analyses were performed using SAS version 9.4 (SAS Institute Inc.), and p-value of <0.05 was considered to indicate statistical significance.
Results
Baseline characteristics
Table 1 shows the baseline characteristics of the participants with respect to the occurrence of MI, stroke, and death. In total, 245 participants (0.8%) developed MI, 483 (1.6%) experienced stroke, and 1,517 (5.3%) died. The mean age of the participants who developed MI, experienced stroke, or died was higher than that of those who did not. The proportion of participants with a low income was higher in the event group than in the non-event group. Comorbidities such as DM, HTN, dyslipidemia, and RD were more prevalent in the event group than in the non-event group. The WC, systolic blood pressure, and glucose levels of the event group were higher than those of the non-event group, but the former’s eGFR was lower. As an outcome, the death group showed a lower BMI than the survival group; however, the event group, including MI and stroke, showed a higher BMI than the non-event group (Table 1).

Baseline characteristics of subjects according to the incident myocardial infarction, stroke and death
The characteristics of the participants as per their SES are presented in Table 2. Participants with the highest SES (SES of 4) were older; more likely to be female, nonsmokers, and nondrinkers; exercised less; and displayed a higher prevalence of DM, HTN, dyslipidemia, and RD (Table 2). The blood pressure, fasting glucose, and total cholesterol levels of the highest SES group were higher but their eGFR levels were lower than the reference group (Table 2).

Baseline characteristics of subjects according to the social economic status
Association of socioeconomic score and risk of myocardial infarction
The lowest income group showed the highest risk of MI. However, it was not statistically significant after adjustment. Education was associated with MI risk, but having an occupation or a spouse did not affect the risk of MI. Finally, SES was not associated with the risk of MI after adjusting for covariates (Table 3). The type of medical insurance also did not affect the development of MI (Supplementary Table 2, available online).

IRs and HRs of myocardial infarction according to the socioeconomic status and score
Association of socioeconomic score and risk of stroke
The lowest income group showed the highest risk of stroke after adjusting for covariates. Education was also associated with stroke risk. However, having an occupation or spouse did not affect the risk of stroke. Finally, SES showed a linear relationship with stroke after adjusting for covariates (Table 4). The medical aid group showed a higher HR for stroke compared to groups with other types of medical insurance (Supplementary Table 2, available online).

IRs and HRs of stroke according to the socioeconomic status and score
Association of socioeconomic score and risk of death
All four socioeconomic factors (income, education level, marital status, and occupation) were associated with risk of death after adjusting for covariates. Finally, SES showed a linear relationship with death after adjustment for covariates (Table 5). The risk of death was significantly higher in the medical aid group (Supplementary Table 2, available online).

IRs and HRs of death according to the socioeconomic status and score
Effects of renal dysfunction on the associations of socioeconomic score and risk of myocardial infarction, stroke, and death
Subgroup analyses that investigated the effects of RD and smoking history on the association between SES and the risk of MI, stroke, and death were performed. RD did not affect the development of MI after adjusting for covariates (Fig. 2A). SES was associated with risk of stroke and death in participants without RD. However, SES did not affect stroke and death risk in participants with RD (Fig. 2B, C). Smoking was a risk factor for MI, stroke, and death (Fig. 2D–F) but did not affect the association between MI risk and SES (Supplementary Fig. 1D, available online). Stroke risk was associated with SES for nonsmokers but not for smokers (Supplementary Fig. 1E, available online). With regard to death risk, SES was a strong risk factor regardless of smoking status (Supplementary Fig. 1F, available online).
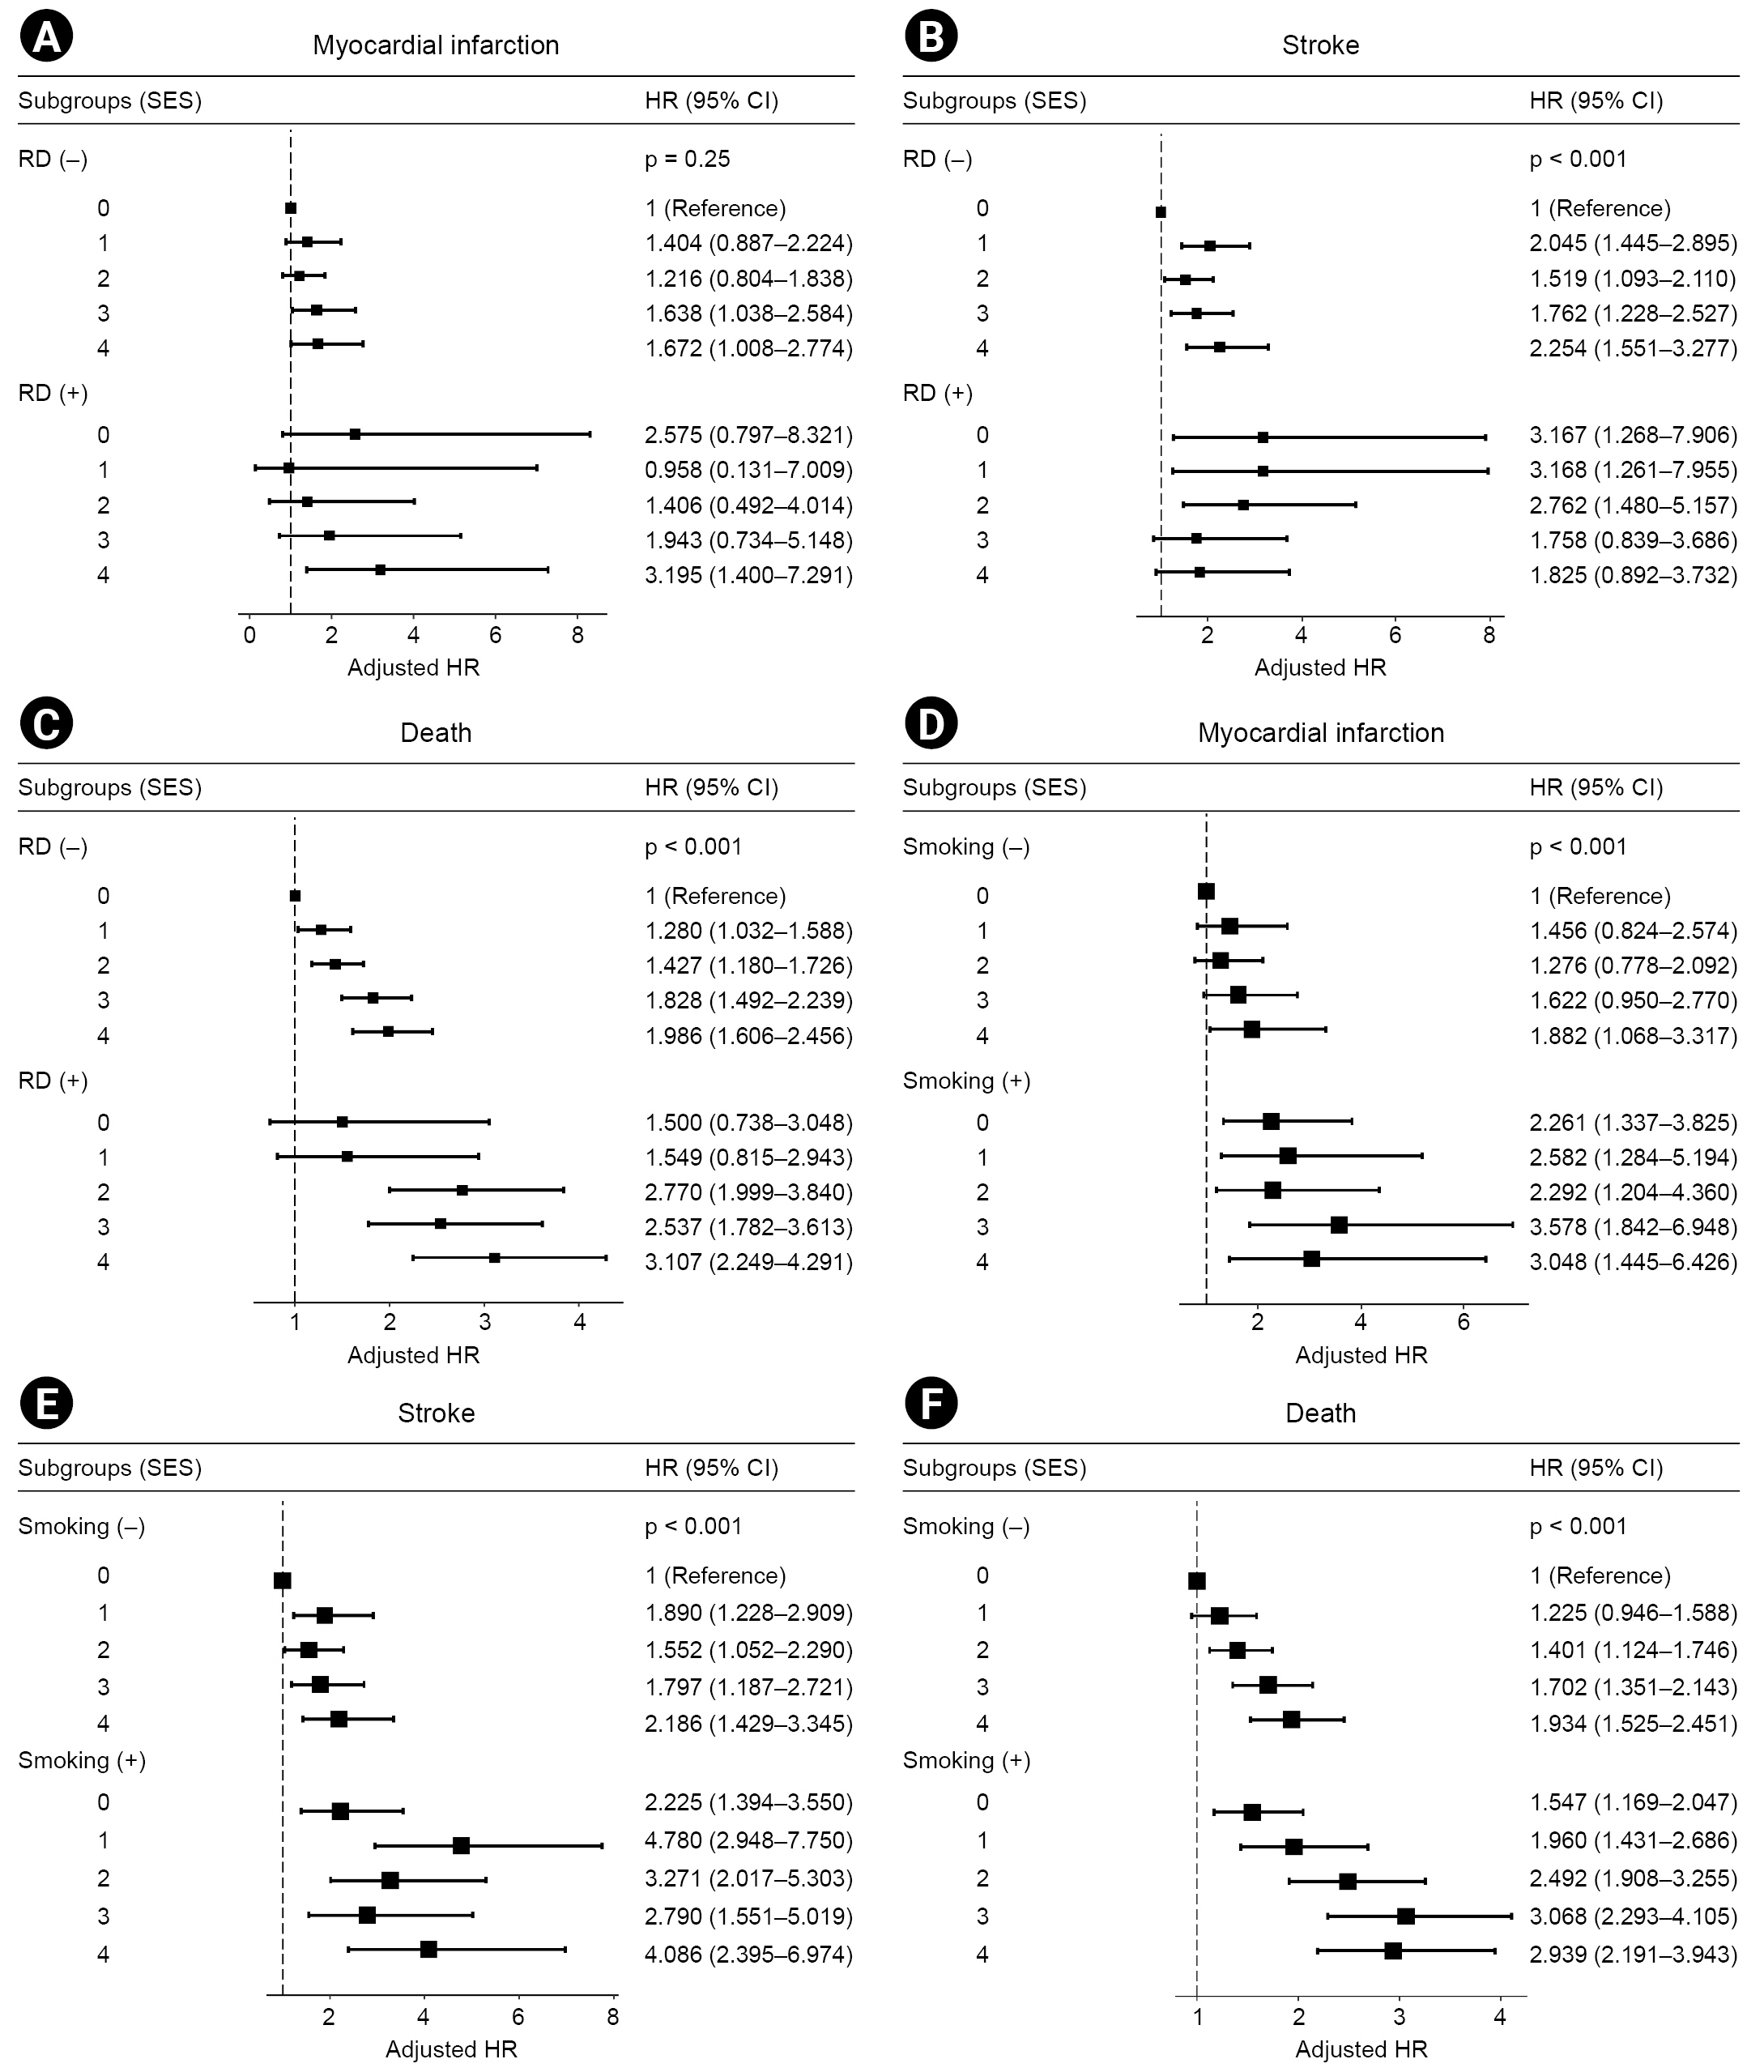
Forest plots of subgroup analyses according to the presence or absence of RD or smoking, with the SES 0 group as the reference.
(A, D) Risk of myocardial infarction, (B, E) stroke, and (C, F) death.
CI, confidence interval; HR, hazard ratio; RD, renal dysfunction; SES, socioeconomic status score.
Discussion
In the present study, the participants’ level of education was associated with the risk of MI, stroke, and death. The participants’ income level was associated with risk of stroke and death. All four socioeconomic factors were associated with risk of death. SES, a combined measure of the four investigated socioeconomic factors, also showed a relationship with stroke and death. However, the relationships between the effects of SES and risk of stroke or death were attenuated in participants with RD.
Among other sociodemographic factors, lower educational levels have been reported to be associated with limited access to health care, worsening socioeconomic status, and unhealthy lifestyle behaviors [15,16], all of which may considerably contribute to the risk of poor outcomes. Our study also showed that, among the investigated socioeconomic factors, only education level was associated with MI, stroke, and death. Previous data showed that individuals with a primary school education or lower had a 1.7-fold higher incidence of MI in comparison to those with a senior high school, college, or postgraduate education [17]. Studies from Europe and America have reported an inconsistent association between education and adverse cardiovascular outcomes among patients with acute MI based on educational status [7,18–21]. Some of these discrepancies arise from the use of inconsistent assessment methods and inclusion of important cardiovascular risk factors, such as HTN, dyslipidemia, smoking, and preexisting heart diseases, in the assessment of differences [19,20,22]. The mechanisms that support the association between a lower education level and a higher risk of MACE remain unclear. Individuals with higher educational attainment may be more proficient in self-management after discharge and may be more proficient in finding the optimal standard of care [23]. Additionally, they may have better health knowledge and lower financial barriers to access to health care, which may improve their access to follow-up health services. Dedicated studies should focus on the roles of follow-up care, medication adherence, and utilization of rehabilitation services to understand education-based differences in cardiovascular outcomes.
Subsequently, future interventions for less educated individuals could focus on improving the most challenging aspects of post-discharge care and performing a more rigorous follow-up for such vulnerable patients. These findings also stimulate policy and public health discussions, which would facilitate the development of practical and sustainable strategies such as providing targeted populations with more convenient health access and initiating close and active treatment coordination to create appropriate educational materials for them.
A low household income is associated with a variety of indicators of low health status, which include low birth weight, early childhood mortality, and adult mortality [22, 24]. Moreover, because individuals with lower income have limited resources, they also have a limited range of food choices or lack the economic ability to engage in health-enhancing activities. Meanwhile, they have been reported to have a high degree of psychosocial stress [25], which increases sympathetic nerve activity and induces left ventricular hypertrophy, resulting in poor chronic kidney disease (CKD) outcomes [26]. As access to health-related activities may be determined by income level, individuals with a higher income are reported to have a higher ability to control their health conditions [27,28].
SES showed a positive relationship with the risk of stroke and death in participants without RD. In contrast, SES did not affect the occurrence of MI, stroke, or death in participants with RD. There are several possible explanations for this phenomenon. As RD is a known powerful risk factor for MACE, and RD patients have a higher prevalence of MACE risk factors such as DM and HTN, individuals with RD may be more influenced by their RD status than by their health habits or other external factors. The prevalence of CKD increases with age, and the difficulty of accurately measuring the income level of older individuals owing to their changing work status and income might have influenced the results in the CKD group [29]. In addition, relatively older participants with CKD may find it difficult to maintain healthy living habits [30]. Subgroup analysis on smoking showed similar results to RD subgroup analysis. In MI and stroke, SES had a significant effect on outcomes in the nonsmokers group, but SES did not significantly affect MI or stroke in the smoking group. These results suggest that the effect of smoking on the occurrence of MI or stroke is higher than that of SES. Therefore, it can be concluded that smoking cessation is necessary to prevent MI and stroke.
Unexpectedly, we did not observe any association between the status of MI and household income or occupation, which contradicts the results of previous studies [31]. Although we do not have a clear explanation for this finding at this time, the wide coverage of the national health insurance and the nationwide management program for coronary artery disease provided by public health centers in Korea might have lowered the barriers to treatment and provided individuals from all walks of life with equal access to treatment for MI. However, further studies that examine various factors that affect MI outcomes (e.g., treatment modality, adherence to treatment, and medical cost) are warranted.
The results of this study should be interpreted with cognizance of its various limitations. First, this study utilized household income, education, occupation, and marital status as indices to represent socioeconomic status. However, these indices may be insufficient for precise evaluation of socioeconomic status. Second, the small event size in the RD group might have introduced an unreliability bias. Third, participants living in rural areas had lower access to healthcare services than those living in cities, but we did not account for the features of the local communities to which the participants belonged. Last, the measurement of serum creatinine using the isotope dilution mass spectrometry-traceable method was introduced in Korea during the research data extraction period from 2008 to 2017. As a result, the serum creatinine measurement method and the eGFR calculation formula may differ across institutions.
Although the prediction of outcomes with a single socioeconomic indicator may be insufficient, there has been no attempt to predict outcomes as a composite indicator by tying these indicators together. As the results show, death and MI were better predicted by the composite variables. A weakness of this study is that, although each indicator may have different effects, they were all combined to acquire a single score.
In conclusion, low socioeconomic status is associated with increased risk of stroke and death, especially in individuals without RD. Therefore, these results suggest not only the need for preventive management of individuals with low socioeconomic status but also that RD is a strong factor in the development of MACE.
Notes
Conflicts of interest
All authors have no conflicts of interest to declare.
Funding
This research was supported by a grant from the Korea Health Technology R&D Project through the Korea Health Industry Development Institute funded by the Ministry of Health & Welfare, Korea (grant no. HI18C0331) and by the Chonnam National University Hospital Biomedical Research Institute (grant no. BCRI 21046, 20025 & 22040).
Data sharing statement
The data presented in this study are available on request from the corresponding author.
Authors’ contributions
Conceptualization: EHB, SYL, SWK
Data curation: EHB, SYL, BK
Formal analysis: TRO, BK, KDH
Funding acquisition: HSC, SWK
Methodology: EHB, TRO, BK, KDH
Project administration, Resources: SWK
Software: TRO, BK, KDH
Supervision: SWK, KDH
Validation: EMY, HSC, CSK, SKM
Visualization: EMY, HSC, CSK
Writing–original draft: EHB
Writing–review & editing: SKM, SWK
All authors read and approved the final manuscript.
Supplementary Materials
Supplementary data are available at Kidney Research and Clinical Practice online (https://doi.org/10.23876/j.krcp.21.249).