Kidney injury molecule-1: A potential marker of renal recovery after laparoscopic sleeve gastrectomy
Article information

Abstract
Background
Bariatric surgeries were reported to improve diabetes and hypertension; however, the effect on renal recovery has not been fully explored. The aim of this study was to evaluate the effect of laparoscopic sleeve gastrectomy (LSG) in morbidly obese patients on renal function, degree of albuminuria, and kidney injury molecule-1 (KIM-1) level.
Methods
This was a prospective observational study conducted at Mansoura University Hospitals from January to June 2017. Forty-four morbidly obese patients (29 females and 15 males) who met the 1991 WHO criteria for obesity surgery were included. Patients underwent surgical LSG for treatment of morbid obesity, and all were followed for 6 months after surgery. Demographic, clinical, and laboratory data were collected and compared before and after surgery. Primary endpoints were the differences of albuminuria, estimated glomerular filtration rate (eGFR) and serum KIM-1 between baseline (pre-surgery) and 6-month post-surgery values.
Results
Six-month post-surgery data showed significant reduction of body mass index, HbA1c, microalbuminuria, and serum KIM-1, and a significant increase in eGFR (all, P < 0.001). The serum KIM-1 level positively correlated with microalbuminuria and serum creatinine (r = 0.596, P = 0.001 and r = 0.402, P = 0.034, respectively). Postoperative data showed that patients with microalbuminuria had significantly lower eGFR and higher KIM-1 values than those without microalbuminuria (P = 0.003 and 0.049, respectively).
Conclusion
We showed potential benefits of LSG against obesity-associated kidney damage. This is evidenced by improving eGFR and reducing levels of both KIM-1 and microalbuminuria. The serum level of KIM-1 may be a potential marker for renal recovery after LSG.
Introduction
Laparoscopic sleeve gastrectomy (LSG) has been approved by the American Society for Metabolic and Bariatric Surgery (ASMBS) and the American College of Surgeons (ACS) as a treatment for obesity and its related comorbidities. Sleeve gastrectomy involves removal of approximately 80% of the stomach by transecting the greater curvature of the stomach, which creates a gastric “sleeve” tube in continuity with the esophagus and duodenum. When other conservative measurements failed, bariatric surgery offered substantial and sustainable weight loss and a reduction in obesity-related comorbidities [1].
LSG is a restrictive procedure in which gastric volume is reduced to 60 to 100 mL. This permits intake of only small amounts of food, resulting in a feeling of early satiety during a meal [2]. The effect of LSG on endogenous ghrelin level may also explain LSG success. Ghrelin, a hunger-regulating peptide hormone, is produced by P/D1 cells found mainly in the fundus of the stomach. By resecting the fundus in LSG, the majority of ghrelin-producing cells is removed. This will reduce plasma ghrelin level and subsequently, will alleviate hunger sensation, that aid to weight loss [3].
LSG has various advantages that include its technical simplicity, shorter operative time, preservation of the pylorus, and maintenance of normal continuity of bowel [4]. Long-term weight loss after LSG is equal to that of laparoscopic Roux-en-Y gastric bypass (LRYGB), which has been suggested to be the gold standard procedure for morbid obesity [5,6].
As recently determined, LSG not only treats obesity, but also is associated with improvement in type 2 diabetes mellitus (DM) and hypertension (HTN). Both of these conditions are independent risk factors for development of chronic kidney disease (CKD), especially in patients with poorly controlled diabetic state. The major indices of kidney damage and dysfunction are serum creatinine, glomerular filtration rate (GFR), and urinary albumin/creatinine ratio, which are affected by glucose metabolism and insulin resistance even prior to development of diabetes [7]. These markers have some limitations when used as early biomarkers for kidney damage, as they reflect an already existing underlying kidney disease. To better identify individuals with increased risk for kidney disease, there is a need for biomarkers that represent early signs of kidney damage [8]. Several biomarkers such as neutrophil gelatinase-associated lipocalin, kidney injury molecule-1 (KIM-1), and liver-type fatty acid-binding protein were recently evaluated in their abilities to detect renal insults earlier than is currently possible with traditional biomarkers [9-12].
KIM-1 is a membrane protein expressed at minute level in the healthy kidney. After kidney injury, the extracellular portion of the KIM-1 protein is cleaved, rapidly enters the tubular lumen, and then is detectable in the urine. KIM-1 is considered by some researchers a sensitive biomarker of tubular damage and is strongly associated with tubulointerstitial inflammation and fibrosis. Compared to any of the conventional diagnostic markers, KIM-1 is not only an early biomarker of acute kidney injury, but also has a potential role in predicting long-term renal outcomes [13,14].
Obesity is one of the risk factors of development of CKD on its own or in conjunction with its association with comorbid conditions like DM and HTN. Obesity-related renal disease is usually asymptomatic and difficult to diagnose early [14]. In the current study, we hypothesized that LSG-aided weight reduction could improve renal function; this improvement could be detected using KIM-1 and other traditional nephropathy markers. The aim of this study was to explore the effects of LSG on renal function, KIM-1 level, degree of microalbuminuria, and other nephropathy markers. This aim included assessment of LSG’s reno-protective effect against the pathogenic mechanism associated with morbid obesity.
Methods
Study design and inclusion criteria
This was a prospective observational study that included 44 morbidly obese patients who met the 1991 World Health Organization (WHO) criteria for obesity surgery. These criteria included age between 18 and 65 years old with body mass index (BMI) above 40 kg/m2 without comorbidities or 35 kg/m2 with one of the obesity-related comorbidities. Failure of other weight loss methods was also required. The included patients were enrolled in the study and underwent surgical LSG for treatment of obesity.
Exclusion criteria
Patients with severe diabetic complications or associated medical conditions such as blindness, end-stage renal failure, liver cirrhosis, malignancy, chronic congestive heart failure, unstable angina pectoris, pregnancy, and psychological conditions that hamper patient cooperation were excluded. Those experiencing specific contraindications to obesity surgery such as chronic diarrhea, alcoholism, inflammatory bowel disease, uncontrolled coagulopathy, nephrotic syndrome, drug addiction, and unwillingness to undergo long-term follow-up were also excluded from the study.
Patient and public involvement
Both patients and public representatives were involved in recruitment methods. Patients who agreed to be enrolled in the study were followed up for 6 months after LSG. All patients were informed of the study results during their follow-up visits; feedback on the summary of these results was also provided to the patients. All subjects were informed of the study’s aims and methods, and informed consent was obtained. All patients were recruited from Mansoura University Hospitals, Safa Hospital, Damietta, and Elkhire Hospital, Mansoura, Egypt, under supervision of the second author between January 2017 and June 2017. The study was approved by the research ethics committee at the Faculty of Pharmacy, Delta University for Science and Technology, Gamasa, Egypt, with registration number FPDU18/2018. The protocol complied with the Ministry of Health, Egypt, and was carried out in accordance with Mansoura University Hospitals guidelines. Informed consent was obtained from each study participant.
Clinical and laboratory assessment
All patients underwent complete clinical assessment. The weight and height of patients were measured, and BMI was calculated by dividing the patient weight in kilograms (kg) by patient height in meters squared (m2). Detailed patient histories were recorded.
Control blood and urine samples were collected before surgery. Blood and urine were re-sampled at the end of the 6-month postoperative period. Blood samples were drawn by venous arm punctures from patients after an overnight fast. Five mL of blood was added immediately to a plain tube, and the serum was separated by centrifugation at 4,000 rpm for 15 minutes using a 5,804 centrifuge (Eppedorf Company, Germany). Blood samples were used to measure hemoglobin A1c (HbA1c) (%), urea nitrogen, uric acid, creatinine, and KIM-1. 24-hour urine samples were collected for urinary albumin quantification.
Glycemic control was assessed by measuring HbA1c% by the Getine110 system (Biotech Inc., Hamburg, Germany) according to the method described by [15] the manufacturer of commercial kits obtained from Biotech Inc. Serum urea nitrogen [16], uric acid [17], and creatinine [18], were determined by Hitachi Cobas c systems using commercial kits obtained from Roche Diagnostics GmbH, Mannheim, Germany. All measurements followed kit manufacturer instructions.
Serum KIM-1 was assessed by enzyme-linked immunosorbent assay (ELISA) technique using a commercial kit obtained from NOVA (Bioneovan Co. Ltd., Beijing, China). Briefly, the Micro ELISA stripe plates were pre-coated with an antibody specific to KIM-1, and 50 µL of horseradish peroxidase-conjugated antibody specific for KIM-1 was added to each well except the blank control well. The plate was sealed and incubated for 30 minutes at room temperature. Free components were washed away. After washing, 100 µL of substrate solution was added to all wells, which were then protected from light, shaken gently, and incubated at room temperature for 15 minutes. The reaction was stopped by adding 50 µL of stop solution to all wells. A color change in the well from blue to yellow occurred. The absorbance was measured using a micro-titer plate reader at 450 nm. Serum KIM-1 concentration was calculated based on the standard curve and expressed in absolute terms (pg/mL).
Assessment of renal function
Estimated GFR (eGFR) was calculated using the CKD-EPI (epidemiology equation) formula for those patients with BMI < 30 kg/m2 after surgery. The CKD-EPI equation is a single equation in which values are expressed in ml/min/1.73 m2 [19].
eGFR (mL/min/1.73 m2) = 141 × (SCr / 0.9)−1.209 × 0.993age × 1.018 (if female)
We used the Salazar Corcoran equation for patients who had BMI ≥ 30 kg/m2, whether before or after surgery, because the CKD-EPI formula fails to properly estimate true renal function. The Salazar Corcoran equation values are expressed in mL/min/1.73 m2. The equations for men and women are [20].
For men:
[137 - age] × [(0.285 × weight (kg)) + (12.1 × height (m2)] divided by (51 × SCr)
For women:
[146 - age] × [(0.287 × weight (kg)) + (9.74 × height (m2)] divided by (60 × SCr)
Surgical procedure
After admission, routine antithrombotic prophylaxis was initiated, usually with 4,000 to 6,000 units of low-molecular-weight heparin according to risk. No bowel preparation was necessary. The patient followed a liquid diet one day before the operation. A single dose of second-generation cephalosporin was administered half an hour before skin incision as ultra-short-term antibiotic prophylaxis.
The sleeve gastrectomy technique began after trocar placement (generally 5-6), retraction of the liver, and identification of the pylorus. A distance of 2 to 4 cm on the antrum was marked to begin dissection of the greater curvature vessels and ultimate division of the stomach. A calibrating tube 38 F was used to help standardize the size of the gastric conduit and to prevent over-narrowing of the sleeve. Sequential firings of the linear stapler were continued toward the gastroesophageal junction (angle of His). Then the staple line was reinforced by an oversewing stitch using polydiaxone 2/0. Patients were discharged from the hospital after stabilization of their general condition; the median (min-max) duration of hospital stay was 3 (2-5) days.
Statistical analysis
Data were collected, revised, verified, and then edited on a personal computer. The statistical analysis was performed using IBM SPSS Statistics for Windows ver. 21.0 (IBM Corp., Armonk, NY, USA). The normality of data was first tested with the Shapiro-Wilk test. Qualitative data are described using number and percent. Association between categorical variables was tested using Fisher’s exact test or chi-square test when appropriate. Continuous variables are presented as mean ± standard deviation for parametric data and median (range) for nonparametric data. Unpaired data are compared using Student’s t test (for parametric data) and Mann-Whitney test (for nonparametric data), while paired samples were compared using paired sample t test (for parametric data) and Wilcoxon signed-rank test (for nonparametric data).
Significance of the obtained results was considered at a P value of ≤ 0.05.
Pearson’s test was performed to detect correlation with each parameter [21].
Results
Description of included sample
The current study comprised 44 obese patients who underwent LSG. The baseline demographic characteristics of the study participants are illustrated in Table 1. The majority of patients enrolled in the study was females (n = 29, 65.9%). The mean age of patients was 32.5 ± 8.9 years. The patients enrolled in the study had a BMI of 50.6 ± 6.7 kg/m2.

Baseline demographic characteristics of morbidly obese patients enrolled in the study (n = 44)
Ten participants (22.7%) were diabetic and under treatment with insulin and/or oral hypoglycemic drugs, e.g., metformin 1,000 mg/d, glibenclamide 2.5 mg/d, or glimepiride 3 mg/d. The diagnosis of diabetes was confirmed by history and HbA1c ≥ 6.5% according to the American Diabetes Association (ADA, 2017). In addition, 12 patients (27.3%) were hypertensive. The patients were followed up closely to confirm adherence to anti-diabetic treatment before and after surgery.
Comparison between pre-surgery and post-surgery data
Six-month post-surgery, subjects showed a significant reduction in BMI compared to the pre-surgery data. The BMI before the surgery was 50.6 ± 6.7 kg/m2 but decreased to 36.2 ± 5.3 kg/m2 after surgery. After surgery, seven of 44 patients (15.9%) had BMI of 30 kg/m2 or less. A significant post-surgical reduction in HbA1c%, from 8.4 ± 1.4% to 5.2 ± 0.8%, occurred in diabetic patients. Pre-surgery microalbuminuria, serum urea nitrogen, creatinine, and uric acid were significantly decreased in 6-month post-surgery samples (P < 0.001); and eGFR was significantly increased from 103.0 ± 14.8 mL/min/1.73 m2 to 108.4 ± 14.4 mL/min/1.73 m2. KIM-1 level was significantly reduced at 6-month post-surgery. The median pre-surgery KIM-1 value was 1,729.0 (377.5-6,298.4) pg/mL, while the 6-month post-surgery value was 477.6 (155.1-1,520.3) pg/mL (Table 2).

Comparison of laboratory data between pre-surgery and 6-month post-surgery in the studied group (n = 44)
The correlations between pre-surgery and post-surgery KIM-1 values, BMI values, and other biochemical parameters are shown in Table 3. KIM-1 exhibited no significant association with BMI, HbA1c%, urea, uric acid, or eGFR; however, KIM-1 did demonstrate a significant positive association with microalbuminuria and serum creatinine (r = 0.596 and 0.402, respectively). The post-surgery KIM-1 level had a significant positive association with microalbuminuria and creatinine (r = 0.391 and 0.473, respectively) and a significant negative association with eGFR (r = -0.671).

Correlation of pre-surgery and post-surgery serum KIM-1 with different patient parameters
Comparison between patients with and without microalbuminuria
Our patients were subdivided into two groups according to presence or absence of microalbuminuria at initial presentation before LSG. The non-microalbuminuria group was composed of 27 patients; the remaining 17 patients experienced microalbuminuria. The microalbuminuria resolved in 15 of the 17 microalbuminuric patients after LSG. Pre-surgical comparison of microalbuminuria and non-microalbuminuria groups showed no significant differences in BMI, serum creatinine, serum uric acid, eGFR, or KIM-1. DM and HTN prevalence and serum urea level were significantly higher in the microalbuminuria group, as shown in Table 4. The post-surgical comparison showed significantly lower eGFR and higher BMI and KIM-1 values in the microalbuminuria group, as in Table 5 The reduction of KIM-1 after surgery in the microalbuminuria group was 46.3% (P = 0.013), while that in the non-microalbuminuria group was 78.8% (P < 0.001) (Fig. 1).

Pre-operative comparison of clinical and laboratory data between non-microalbuminuria and microalbuminuria group

Postoperative comparison of clinical and laboratory data between non-microalbuminuria and microalbuminuria group
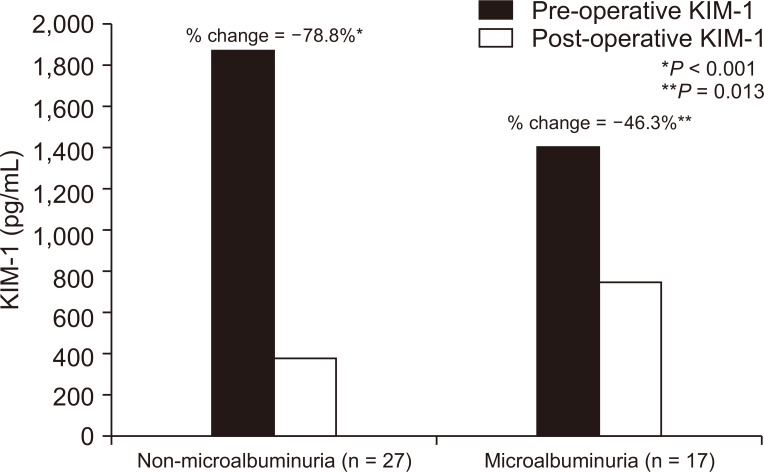
Clustered column chart represents percentage changes of the serum kidney injury molecule-1 (KIM-1) after laparoscopic sleeve gastrectomy in non-microalbuminuria and microalbuminuric group.
Probability of Wilcoxon signed-rank test. Columns represent the median values.
Discussion
LSG has emerged as the most effective and most frequently used long-term treatment of morbid obesity. In 2015, LSG accounted for 53.8% of all bariatric surgeries according to reports from the ASMBS, July 2016 [22]. LSG has proven efficacy in producing dramatic and durable weight loss in obese patients as well as impressive improvements in diabetic complications, dyslipidemia, and HTN [23,24]. Previous reports have demonstrated LSG’s beneficial effect on renal function; however, the pathogenic mechanisms underlying this improvement are not well understood. In our study, we evaluated both metabolic and nephropathic markers, including KIM-1, in morbidly obese patients before and 6 months after LSG.
In the current study, we found an average 30% BMI reduction at 6 months after surgery, and this result is in concordance with Sachdev and colleagues [25]. A previous explanation for the reduction in BMI after LSG was that the reduction was achieved by a combination of mechanical restriction and ghrelin hormonal modulation [2]. Ghrelin is an appetite-modulating peptide that is mainly produced by the cells of the gastric fundus, which is removed by LSG [26]. Of note, our diabetic patients showed less weight loss at 6-month post-surgery than non-diabetics, a finding that is in concordance with previous reports [27,28].
Similarly, LSG had a noticeable effect on reducing HbA1c and induced remission of diabetes in the current patients, a finding that was explored by Kalinowski et al [26]. Some authors have observed this improvement in the early postoperative period even without achievement of weight loss, a mechanism that could be explained by hormonal mechanisms (e.g., increased glucagon-like peptide 1 and decreased ghrelin secretion) [3,29]. Unfortunately, data on state of diabetic control in the early postoperative period (0-3 months) were not included in our analysis. This would have served to evaluate the previous observation.
In the current study, microalbuminuria was significantly higher in obese patients with DM or HTN; however, the BMI values did not differ significantly between microalbuminuric and non-microalbuminuric groups. The presence of microalbuminuria in our patients may be explained by the presence of obesity-induced or obesity-associated comorbid conditions such as DM and HTN rather than obesity itself.
Post-surgery data of the current analysis showed a dramatic improvement in serum creatinine and hence eGFR. Holcomb et al [30] previously reported a significant improvement of renal function quantified by eGFR after bariatric surgery (both LSG and LRYGB). We also appreciated the reduction of microalbuminuria 6 months after LSG; improvement of proteinuria and microalbuminuria after weight loss was also explored by previous reports [31,32]. Microalbuminuria in the sitting of obesity was thought to be caused by the effects of obesity on inducing systemic inflammation, impaired glucose metabolism and insulin resistance, and high blood pressure [33].
Consistent with our results, Park et al [34] observed a reduction in serum uric acid after bariatric surgery. Park et al [34] explained this observation by the possible interrelated mechanisms between albuminuria and uric acid, theorizing that albuminuria could enhance reabsorption of urate from proximal tubules [35]. This mechanism could explain the reduction of serum uric acid and improvement of albuminuria after weight reduction.
One of the promising biomarkers in detection of early acute kidney injury as well as prediction of CKD is KIM-1; however, data assessing its value in obese patients are scarce. We reported in the current analysis that KIM-1 values are higher among obese patients and were decreased significantly after LSG. Goknar et al [36] evaluated the panel of early kidney injury biomarkers, including KIM-1, in pediatric obese non-diabetic patients and found significantly higher values of KIM-1 in the obese patients.
The values of KIM-1 were significantly correlated with microalbuminuria in both pre- and post-surgery data, a finding that could indicate a pattern of tubular injury in our patients. Albumin excretion is primarily related to glomerular injury, but some authors have elucidated a possible role of tubular injury in early occurrence of albuminuria in diabetic obese patients [37]. Our analysis was unable to delineate whether the correlation between KIM-1 and microalbuminuria was a true causal relationship. However, we reported higher KIM-1 values among microalbuminuric and non-microalbuminuric patients. We suggest that the higher level of KIM-1 in non-microalbuminuric patients might be related to subclinical obesity-induced renal injury or its associated comorbid conditions. Previously, Xiao et al [38] found higher KIM-1 level in obese adolescents, even without presence of microalbuminuria. These findings may clarify the possible clinical application of KIM-1 as a complementary marker for early detection of subclinical obesity-related renal disorder.
Our comprehensive analysis of both microalbuminuric and non-microalbuminuric patients (a group that comprised the majority of diabetic and hypertensive patients) revealed improved weight loss, improved GFR, and reduced KIM-1 in the non-microalbuminuric group. The rate of KIM-1 reduction was -78.8% in the non-microalbuminuric versus -46.3% in the microalbuminuric group. The preceding findings may indicate more severe injury among patients with microalbuminuria from which the patients had not adequately recovered during the study follow-up period, an observation that indicates the importance of extended follow-up programs for patients to assess the pattern of renal recovery.
We observed in the current study that GFR was not extremely high according to different formulas. These equations did not adjust or correct for risk of obesity overestimation of true renal function. We admit that assessment of renal function is challenging, especially in the setting of obesity and situations with rapid weight loss, and hypothesize that the state of hyperfiltration that is described in obese patients may be linked to a miscalculation of the true renal function. Available observational studies of bariatric surgery that use creatinine-based GFR equations for assessing kidney function have important limitations [39].
The renal function of our morbidly obese patients statistically improved after applying LSG, but this significant difference could be clinically insignificant as the absolute difference was small. However, improved kidney function after bariatric surgeries has been described before. In a large meta-analysis, the authors discovered a beneficial effect of bariatric surgeries on preservation of renal function, especially in those with impaired kidney function [40].
Strength and limitations of the study
This study provided a comprehensive analysis of different nephropathy markers in morbidly obese patients before and 6 months after LSG. These markers include serum creatinine and eGFR, microalbuminuria, serum uric acid, and KIM-1. We acknowledge some limitations. First, there was a limitation associated with GFR estimation. The use of serum creatinine-based equations like CKD-EPI is problematic in the setting of bariatric surgery. These equations could overestimate GFR in obese patients and could cause misinterpretation of GFR for those with rapid weight loss. We attempted to overcome this problem by using two eGFR equations according to the BMI values of our patients. The second limitation is the short follow-up period of 6 months postoperatively; extended evaluation is recommended for such patients to investigate the full pattern of renal recovery. The third limitation is the small sample size of included patients and the heterogeneity of clinical criteria for both obese and obese diabetic patients. Analysis of a larger population with different specific subgroup analysis would have greater clinical significance.
In conclusion, the current study explored the benefits of LSG not only as an anti-obesity, anti-diabetic procedure, but also as a reno-protective one. This was demonstrated by improved GFR, reduced microalbuminuria, and reduced KIM-1. Extended follow-up is recommended after LSG to fully investigate the pattern of renal recovery.
Acknowledgments
We would like to thank our nursing staff and social workers who helped us in patient selection, education, and follow up.
Notes
Conflicts of interest
All authors have no conflicts of interest to declare.
Authors’ contributions
Hosam Elghadban participated in the data collection and wrote the manuscript. Moustafa Abdelsalam participated in the study design and performed the statistical analysis. Mona Tawfik participated in the conception, analysis, and interpretation of data. Rania Khalil provided intellectual content of critical importance to the work and technical support. Moustafa Abdelsalam participated in the study design and coordination and helped to draft the manuscript. All authors read and approved the final manuscript.