Time-varying effects of body mass index on mortality among hemodialysis patients: Results from a nationwide Korean registry
Article information
Abstract
Background
Unlike patterns observed in the general population, obesity is associated with better survival among hemodialysis patients, which could be explained by reverse causation or illness-related weight loss. However, the time-varying effect of body mass index (BMI) on hemodialysis survival has not been investigated. Therefore, this study investigated the time-varying effect of BMI on mortality after starting hemodialysis.
Methods
In the present study, we examined Korean Society of Nephrology data from 16,069 adult patients who started hemodialysis during or after the year 2000. Complete survival data were obtained from Statistics Korea. Survival analysis was performed using Cox regression and a non-proportional hazard fractional polynomial model.
Results
During the median follow-up of 8.6 years, 9,272 patients (57.7%) died. Compared to individuals with normal BMI (18.5–24.9 kg/m2), the underweight group (< 18.5 kg/m2) had a higer mortality hazard ratio (HR, 1.292; 95% confidence interval [CI], 1.203–1.387; P < 0.001) and the overweight group (25.0–29.9 kg/m2) had a lower mortality HR (0.904; 95% CI, 0.829–0.985; P = 0.022). The underweight group had increasing HRs during the first 3 to 7 years after starting hemodialysis, which varied according to age group. The young obese group (< 40 years old) had a U-shaped temporal trend in their mortality HRs, which reflected increased mortality after 7 years.
Conclusion
The obese hemodialysis group had better survival during the early post-dialysis period, although the beneficial effect of obesity disappeared 7 years after starting hemodialysis. The young obese group also had an increased mortality HR after 7 years.
Introduction
Obesity is a component of metabolic syndrome and a risk factor for mortality, with a hazard ratio of 1.18 among the general population in a recent meta-analysis [1]. In addition, obesity is a risk factor for both chronic kidney disease and end-stage renal disease (ESRD) [2,3]. However, several studies have revealed a protective effect of obesity on survival among patients with ESRD, compared to non-obese patients with ESRD [4–6]. This “obesity paradox” has been explained by reverse causation, with low body mass index (BMI) reflecting ongoing disease progression and leading to short-term mortality [3,7]. Although the long-term effects of obesity on mortality risk would be expected to increase among patients with ESRD (similar to the general population), there are limited data regarding the time-varying effect of BMI on mortality among patients with ESRD.
Compared to the Western population, among an Asian population the same BMI values have greater percentages of body fat, a difference that is associated with increased risks of type 2 diabetes, hypertension, and hyperlipidemia at relatively low BMI values [8,9]. In a recent meta-analysis, approximately 5% of all-cause mortality in Asians could be attributed to overweight status or obesity [10]. However, few studies have investigated the association of BMI with mortality among Asian patients with ESRD, and those studies were limited by small sample size, incomplete follow-up data, or samples based on prevalent dialysis population [11–13]. In a registry of patients of European descent, the effects of BMI on mortality varied according to age among patients with ESRD, with a beneficial effect observed in the elderly ESRD group and a U-shaped trend in effects on mortality in the young ESRD group [14]. As the population of young Asians with obesity has increased rapidly [15], it is important to understand the effects of BMI on mortality in different age groups of Asian patients with ESRD. Therefore, we examined these questions using data from a nationwide Korean registry.
Methods
Study population
In the present study, we retrospectively evaluated data from the Korean Society of Nephrology, which collects data regarding dialysis centers and patients through an online registry (http://www.ksn.or.kr). Details for the registry have been previously reported [16], and 763 centers (approximately 95% of all Korean dialysis units) participated in the registry during 2015. Baseline and retention data are recorded for patients who start dialysis, and in the present study we evaluated data from patients who started dialysis in 2000 (Fig. 1). Among 16,275 patients who started maintenance hemodialysis, 206 were excluded because they were < 18 years old (n = 72), subsequently underwent kidney transplantation (n = 131), or had incorrectly recorded dates of death (vs. registry data, n = 5). Thus, 16,069 patients were included in the analysis. Data regarding BMI were available for 10,327 patients, which we used in a complete case analysis, and multiple imputation of BMI was used for the 5,742 patients with missing BMI data. Complete data were available for all other included covariates (age, sex, and cause of ESRD). Missing patterns were tested for the missing completely at random assumption by Little’s test [17], which was rejected with P < 0.001. Dependence of BMI missing (missing at random assumption) was assumed by assessing whether missing indicators of BMI are dependent on other complete covariates. Uni- and multivariate logistic regression of BMI missing indicators on other complete covariates (age, sex, and cause of ESRD) were conducted, which showed dependency on age (P < 0.001) and cause of ESRD (P = 0.001 for hypertensive nephropathy, P < 0.001 for chronic glomerulonephritis, and P = 0.026 for other causes; P values from multivariable logistic regression).
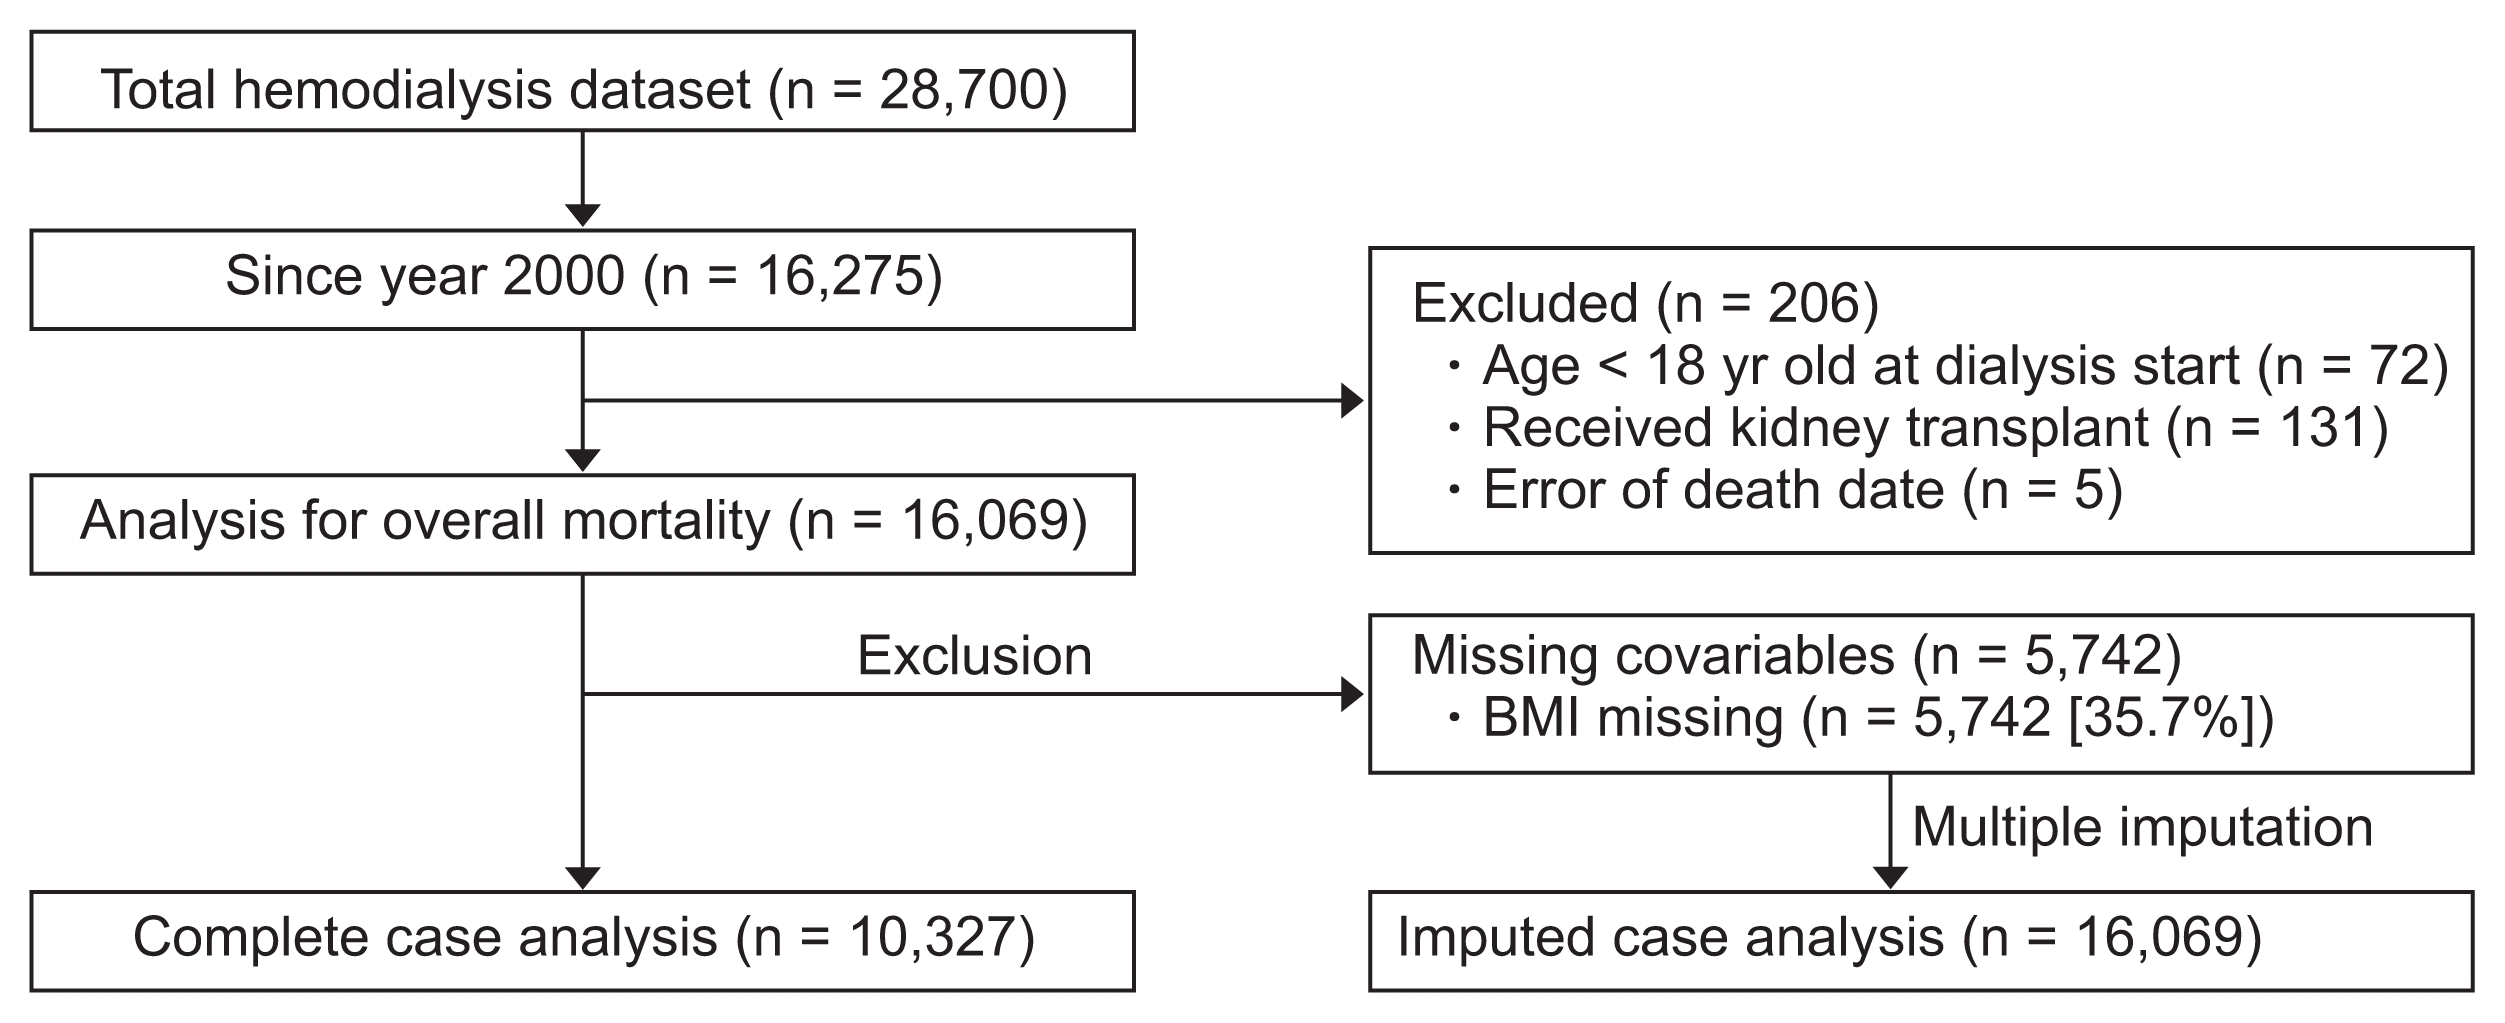
Selection process.
BMI, body mass index.
Verification of mortality and data matching
Data for death status and date were acquired by linking the Korean Society of Nephrology hemodialysis dataset to Statistics Korea (http://kostat.go.kr). Patients who did not have records of death until December 31, 2013 were considered alive at that time with right censoring. When the hemodialysis registry data were linked to death status data from Statistics Korea, 5 cases could not be identified, which agrees with the number of patients with incorrectly recorded dates of death. After excluding these patients, there were no redundant matches. The data matching process was performed under the guidelines of strengthened privacy legislation in Korea, and the study protocol was approved by the public institutional review board of the Ministry of Health and Welfare (P01-201412-RS-02-02). Patient privacy was preserved in all instances, and the study methods complied with the tenets of the Declaration of Helsinki.
Statistical analyses
The baseline data for complete cases were analyzed according to the World Health Organization’s BMI categories [9], and inter-group differences were tested using the chi-square test or analysis of variance, as appropriate. For cases with missing BMI data, we used multiple imputation methods to estimate regression parameters. To briefly introduce multiple estimations, 30 randomly imputed datasets were generated by using mi commands in Stata. BMI missing values were imputed using other complete covariates. Regression analyses were conducted repeatedly per each dataset, and then all estimates were pooled to derive pooled estimated parameters with standard errors [18]. Time-to-event outcomes were evaluated by using the log-rank test with Kaplan–Meier estimator or Cox regression. The group-specific effects of BMI on 5-year mortality were evaluated using univariate or multivariate Cox regression analyses that were stratified using various subgroups. The age-dependent effects of BMI were estimated using three models: model 0 was unadjusted, model 1 was adjusted for only diabetes status and sex, and model 2 was adjusted for all included variables (cause of ESRD, age, and sex). To estimate the time-dependent hazard ratios for mortality, we applied time-varying effect models that were based on fractional polynomials [19–22]. All statistical analyses were performed using Stata software (version 15; StataCorp LLC, College Station, TX, USA). Data visualization was performed using Stata software and GraphPad Prism (version 6; GraphPad Software, LLC, San Diego, CA, USA).
Results
Baseline characteristics
Table 1 shows the baseline characteristics of the 10,327 patients who started hemodialysis during the study period. The mean patient age was 53.2 ± 13.9 years, and 5,914 patients (57.3%) were male. The main cause of ESRD was diabetes (4,525 patients, 43.8%), followed by hypertension (17.6%) and glomerulonephritis (13.7%). Mean BMI among all patients was 21.4 ± 3.1 kg/m2, and most patients had normal BMI (18.5–24.9 kg/m2; n = 7,578, 73.4%). There were 1,563 patients (15.1%) who were underweight (< 18.5 kg/m2), and 126 patients (1.2%) who were obese (> 30 kg/m2). Obese patients had a lower mean age compared to the total patient population (48.0 ± 14.1 years vs. 53.2 ± 13.9 years, P = 0.001). Female sex was more common in the underweight group (53.2%) and in the obese group (60.3%). The obese group had a lower prevalence of diabetes-related ESRD, compared to the total patient population (39.7% vs. 43.8%). Hypertension was more common in the overweight and obese groups, compared to the total patient population (20.8% vs. 21.4% vs. 17.6%).

Baseline clinical characteristics of the study population according to BMI
Stratified analyses
Fig. 2 shows the patient survivals of complete cases according to BMI category. During a median follow-up of 8.6 years (interquartile range, 3.3–11.2 years), 5,420 patients (52.5%) died. The survival rates of the BMI categories (log-rank P < 0.001) were significantly different, with underweight patients having the poorest survival and obese patients having the best survival throughout the follow-up period. For the regression analysis, we used 30 randomly imputed datasets and pooled estimates of individual datasets. There were no missing values for death or date of death, and among 16,069 patients, 9,272 patients (57.7%) died. Compared to the normal weight group, the underweight group had a significantly higher risk of mortality (hazard ratio [HR], 1.262; 95% confidence interval [CI], 1.179–1.350; P < 0.001), and this increased risk persisted in the various subgroups, regardless of age, sex, or diabetes status (Fig. 3). The overweight group had a reduced risk of mortality (HR, 0.904; 95% CI, 0.826–0.991; P = 0.031), and this risk was further reduced among overweight male patients (HR, 0.887; 95% CI, 0.791–0.996; P = 0.042), overweight diabetic patients (HR, 0.865; 95% CI, 0.776–0.964; P = 0.009), and overweight patients who were < 65 years old (HR, 0.882; 95% CI, 0.789–0.987; P = 0.028). However, the reduced risk of mortality disappeared among overweight female patients, overweight elderly patients, and overweight non-diabetic patients. The obese group had an even lower risk of mortality (HR, 0.589; 95% CI, 0.444–0.781; P < 0.001), and this reduced risk was observed in all subgroups except the elderly subgroup (> 65 years old) (Fig. 3). Table 2 shows the results of the multivariate Cox regression analyses, which were adjusted for age, sex, and cause of ESRD (including diabetic nephropathy). Underweight status was associated with a mortality HR of 1.292 (95% CI, 1.203–1.387) and overweight status was associated with a HR of 0.904 (95% CI, 0.829–0.985). Mortality was independently associated with age > 65 years (HR, 2.688; 95% CI, 2.571–2.811) and diabetes (HR, 1.845; 95% CI, 1.706–1.995). Female sex was inversely and independently associated with mortality (HR, 0.856; 95% CI, 0.821–0.893).

Overall survival according to body mass index (BMI) category.
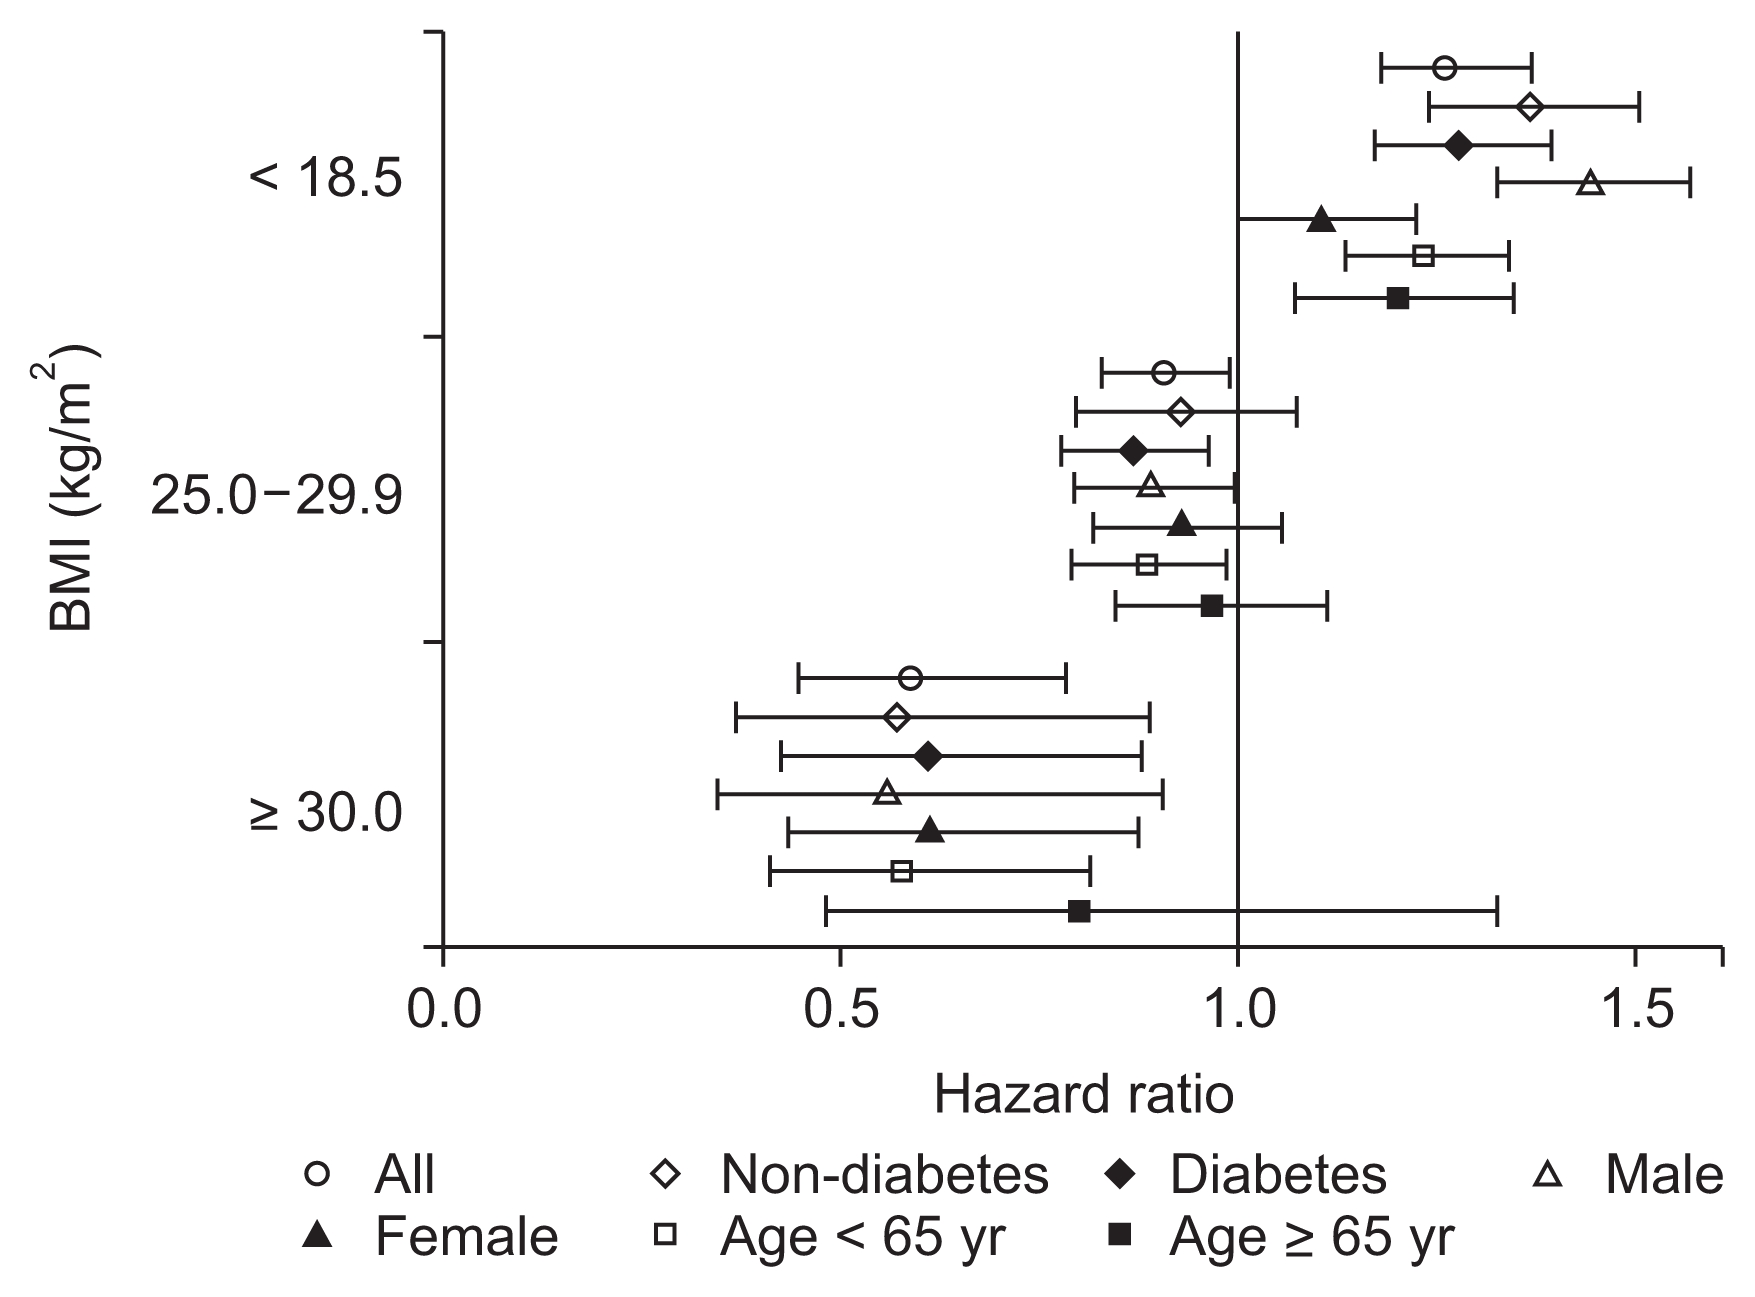
Hazard ratios according to body mass index (BMI) subgroups.

Adjusted hazard ratio (HR) of body mass index (BMI) and other parameters to overall mortality
Comparing 5-year and overall mortality
Table 3 presents the age-stratified multivariate analysis of BMI and mortality, as well as the crude and adjusted models. Underweight status was associated with poor survival across all age strata (young age: HR 1.306, 95% CI 1.011–1.687; middle age: HR 1.415, 95% CI 1.262–1.586; elderly: HR 1.239, 95% CI 1.130–1.358). The effects of different BMI groups were statistically significant in the middle age group, although overweight or obese statuses were not independently associated with mortality in the young or elderly groups. Fig. 4 presents the age-specific adjusted mortality HRs, compared to the young non-diabetic group. Aging was associated with an increased risk of mortality, although the underweight group had reductions in long-term overall mortality HR (Fig. 4B) compared to the 5-year mortality HR (Fig. 4A). Stepwise reductions in overall mortality were not observed with increasing BMI among the elderly subgroup, although this phenomenon was observed for overall mortality in the middle-age group. Obese young and middle-aged patients had slightly elevated changes in their overall mortality HR, which we further investigated using time-varying analyses.

Hazard ratios (HRs) of body mass index (BMI) within the same age groups in Cox regression model of overall mortality
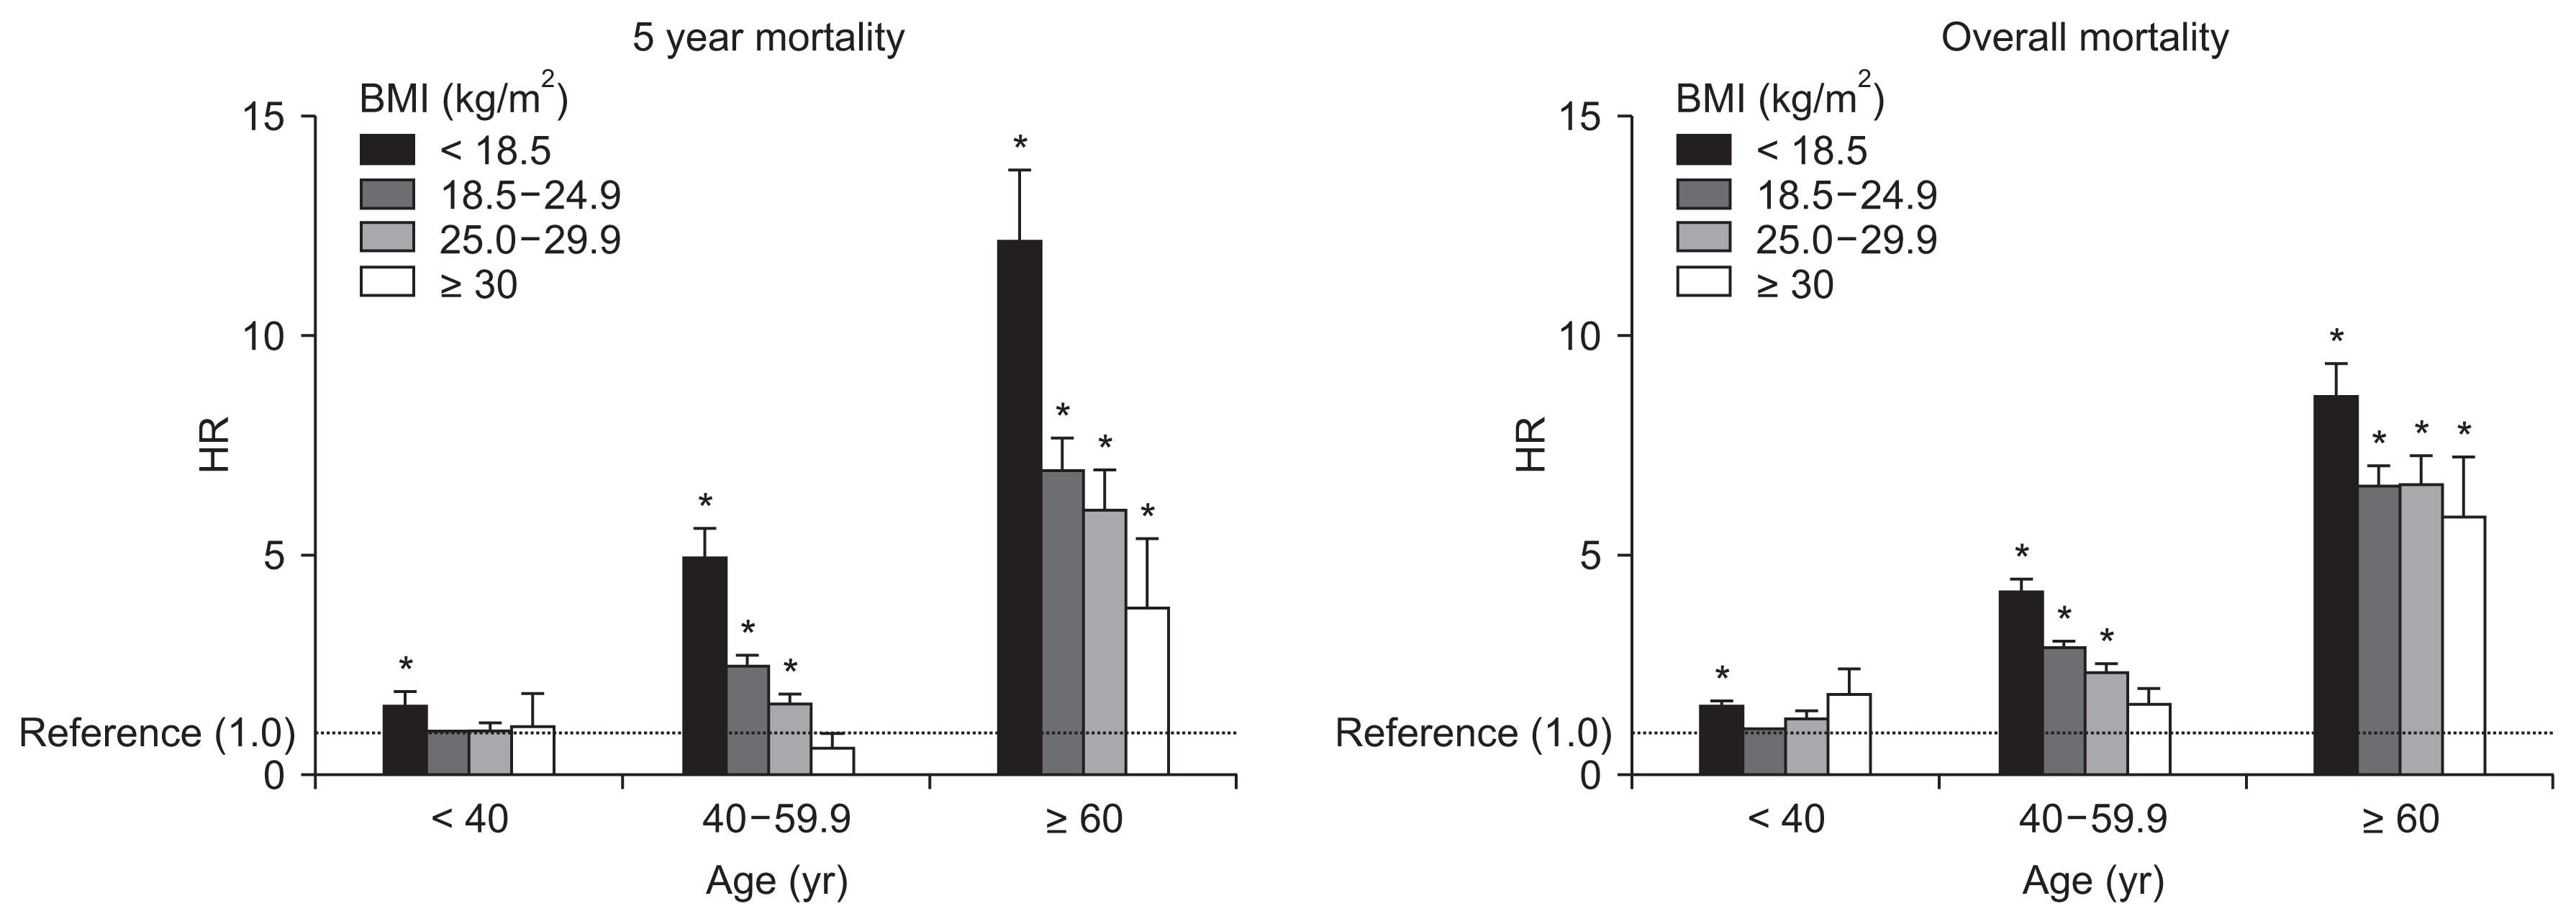
Adjusted hazard ratios (HRs) for 5-year mortality and HRs for overall mortality.
The young population (< 40 years old) with a normal body mass index (BMI, 18.5–24.9 kg/m2) was used as the reference group. HRs were calculated with adjustments for sex and cause of end-stage renal disease.
In Fig. 2, underweight patients experienced the fastest decline in survival during the early period after starting hemodialysis, and also experienced the poorest survival during the follow-up period. The obese group experienced better survival until the median follow-up time, compared to the normal BMI group. This time-dependent change in the HRs was confirmed by testing a non-zero slope in a generalized linear regression of the scaled Schoenfeld residuals for time (Supplementary Fig. 1). Fig. 5 and 6 show the time-dependent mortality HRs according to BMI. Underweight status was associated with elevated HRs during the first 7 years after starting hemodialysis, while the obese group had decreased HRs during years 2 to 7 after starting hemodialysis. These time-varying patterns were similar for both sexes (Fig. 5). The young obese group experienced an increased risk of mortality beginning at 8 years after starting hemodialysis (Fig. 6), although this population was not large.
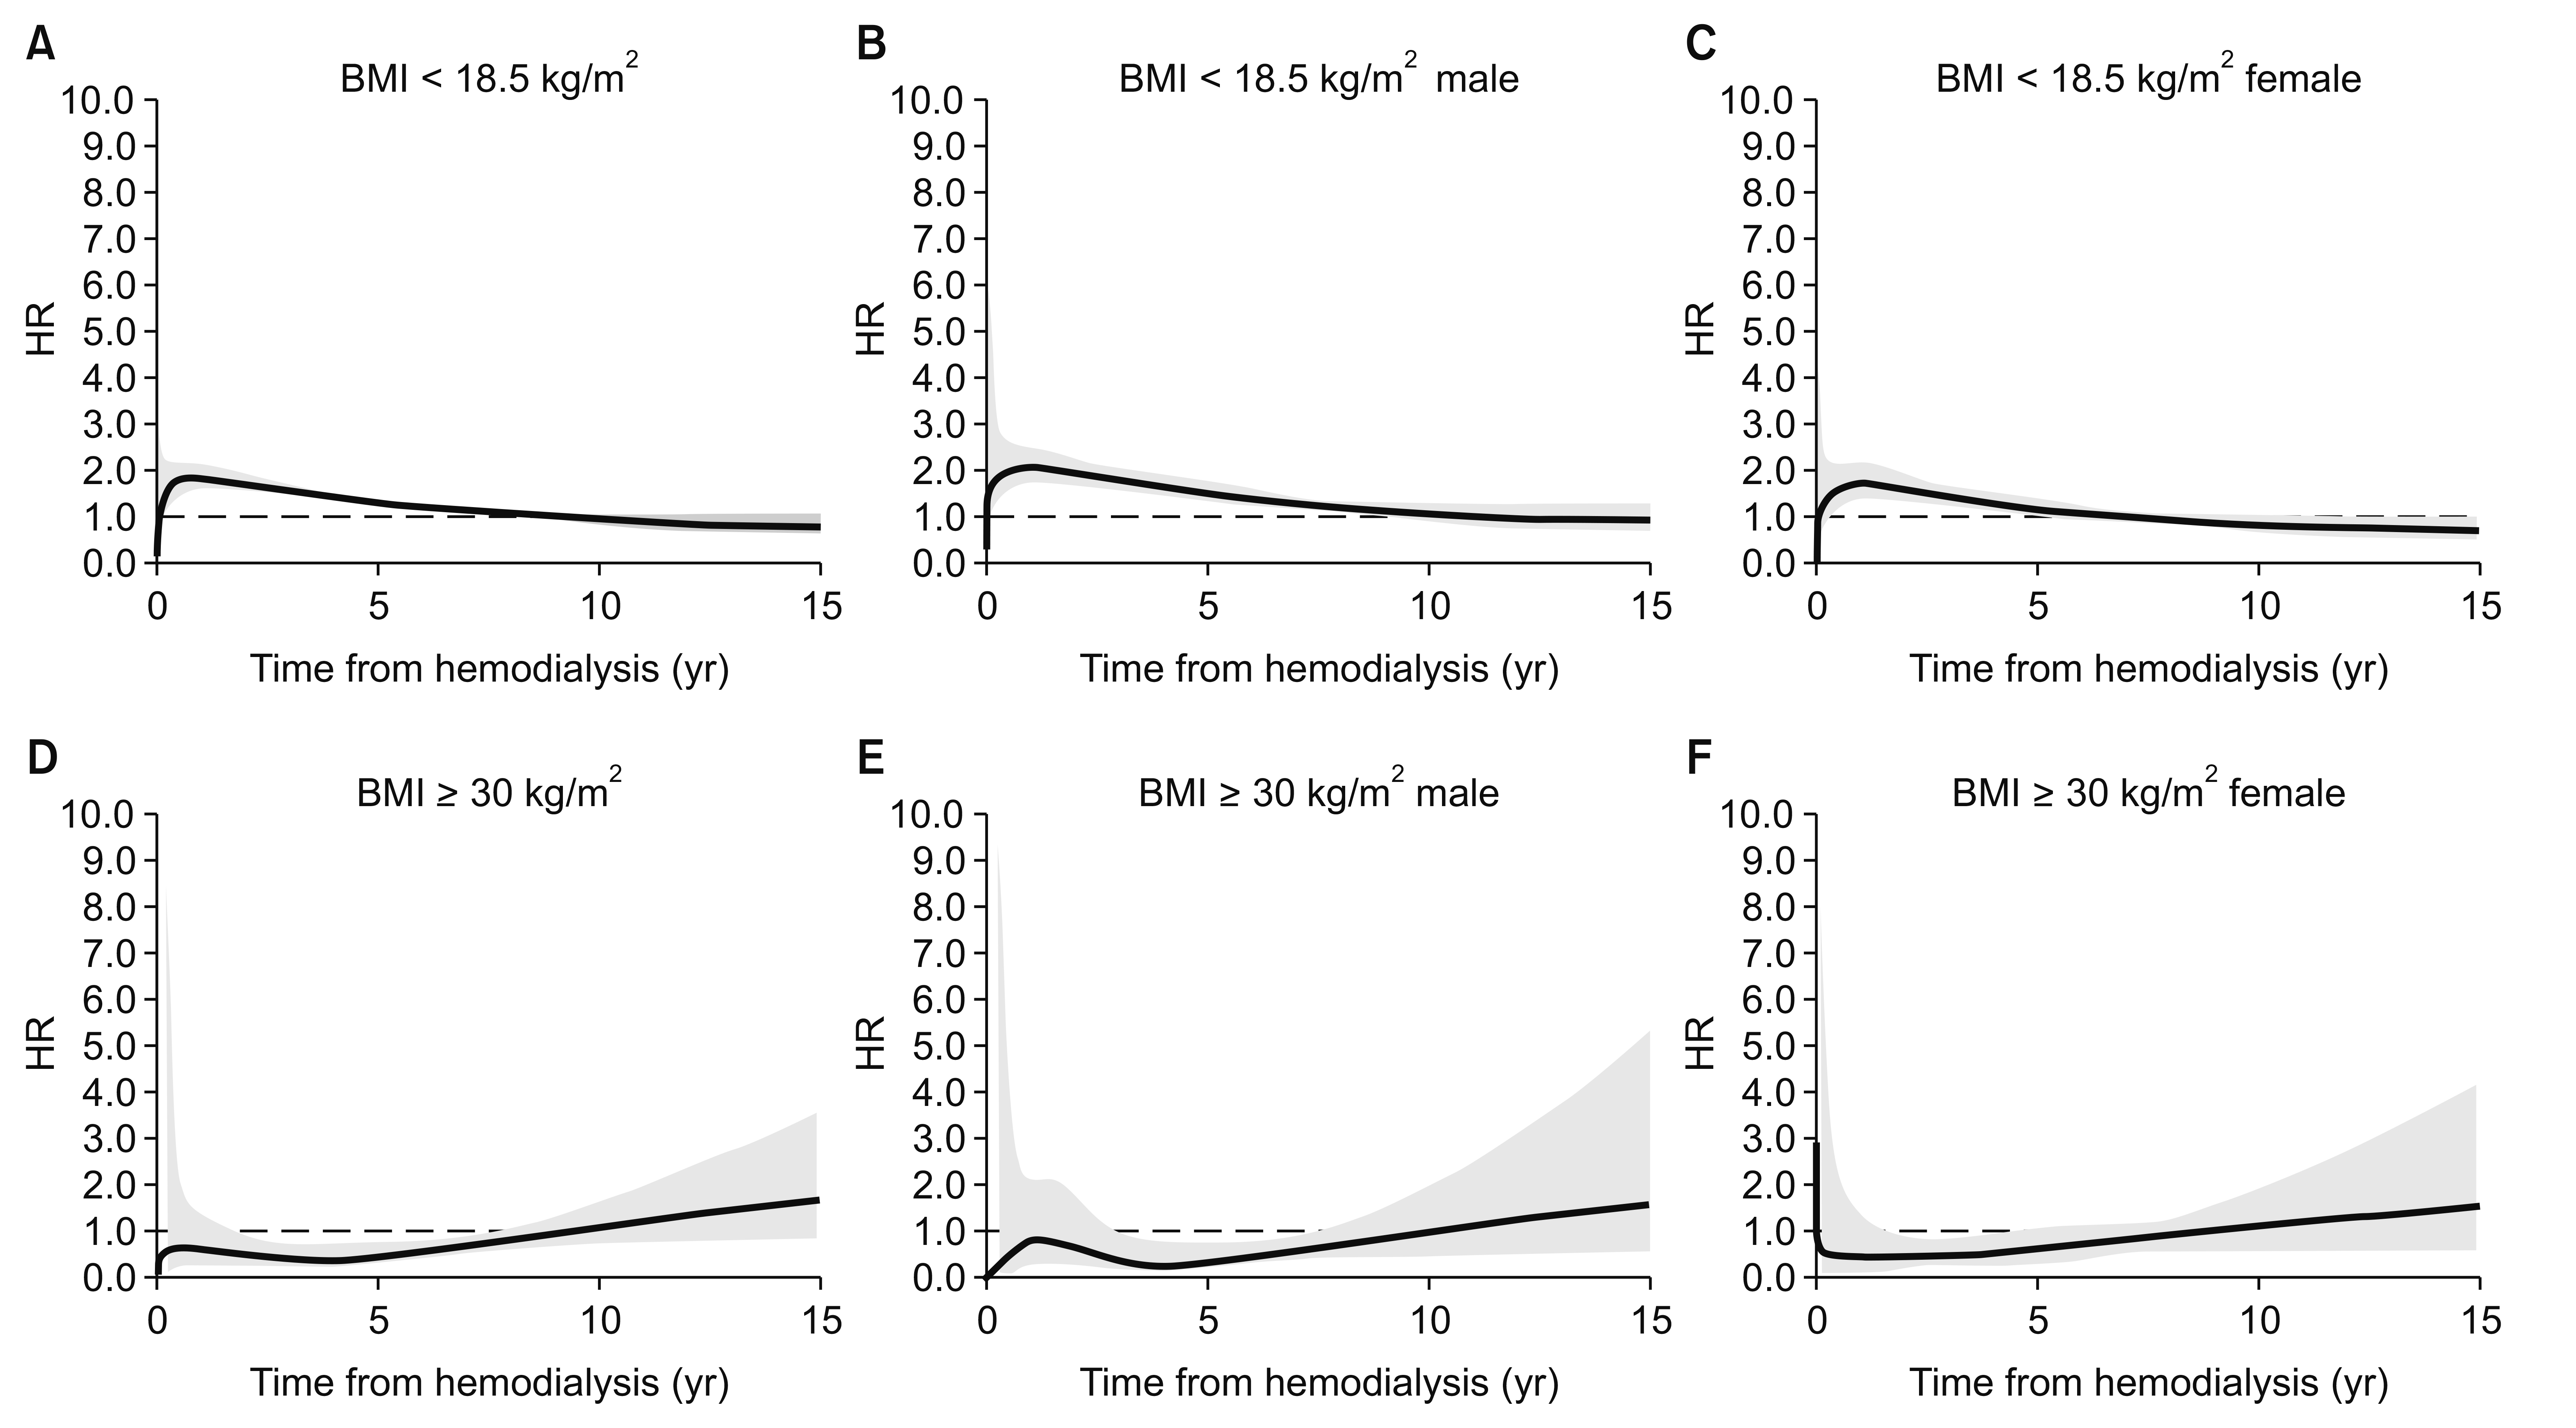
Time-dependent hazard ratios (HRs) for low or high body mass index (BMI).
The time-dependent HRs were adjusted for cause of end-stage renal disease. Thick lines indicate continuous HRs, and the grey area reflects 95% confidence intervals for the estimated HRs. The dashed line shows a HR of 1.0. The underweight group (A–C) had a higher mortality HR during the early period after dialysis, which reached 1 (null value) approximately 7 years after starting hemodialysis. The lower HR for the obese group persisted from 2 to 7 years after starting hemodialysis (D–F).
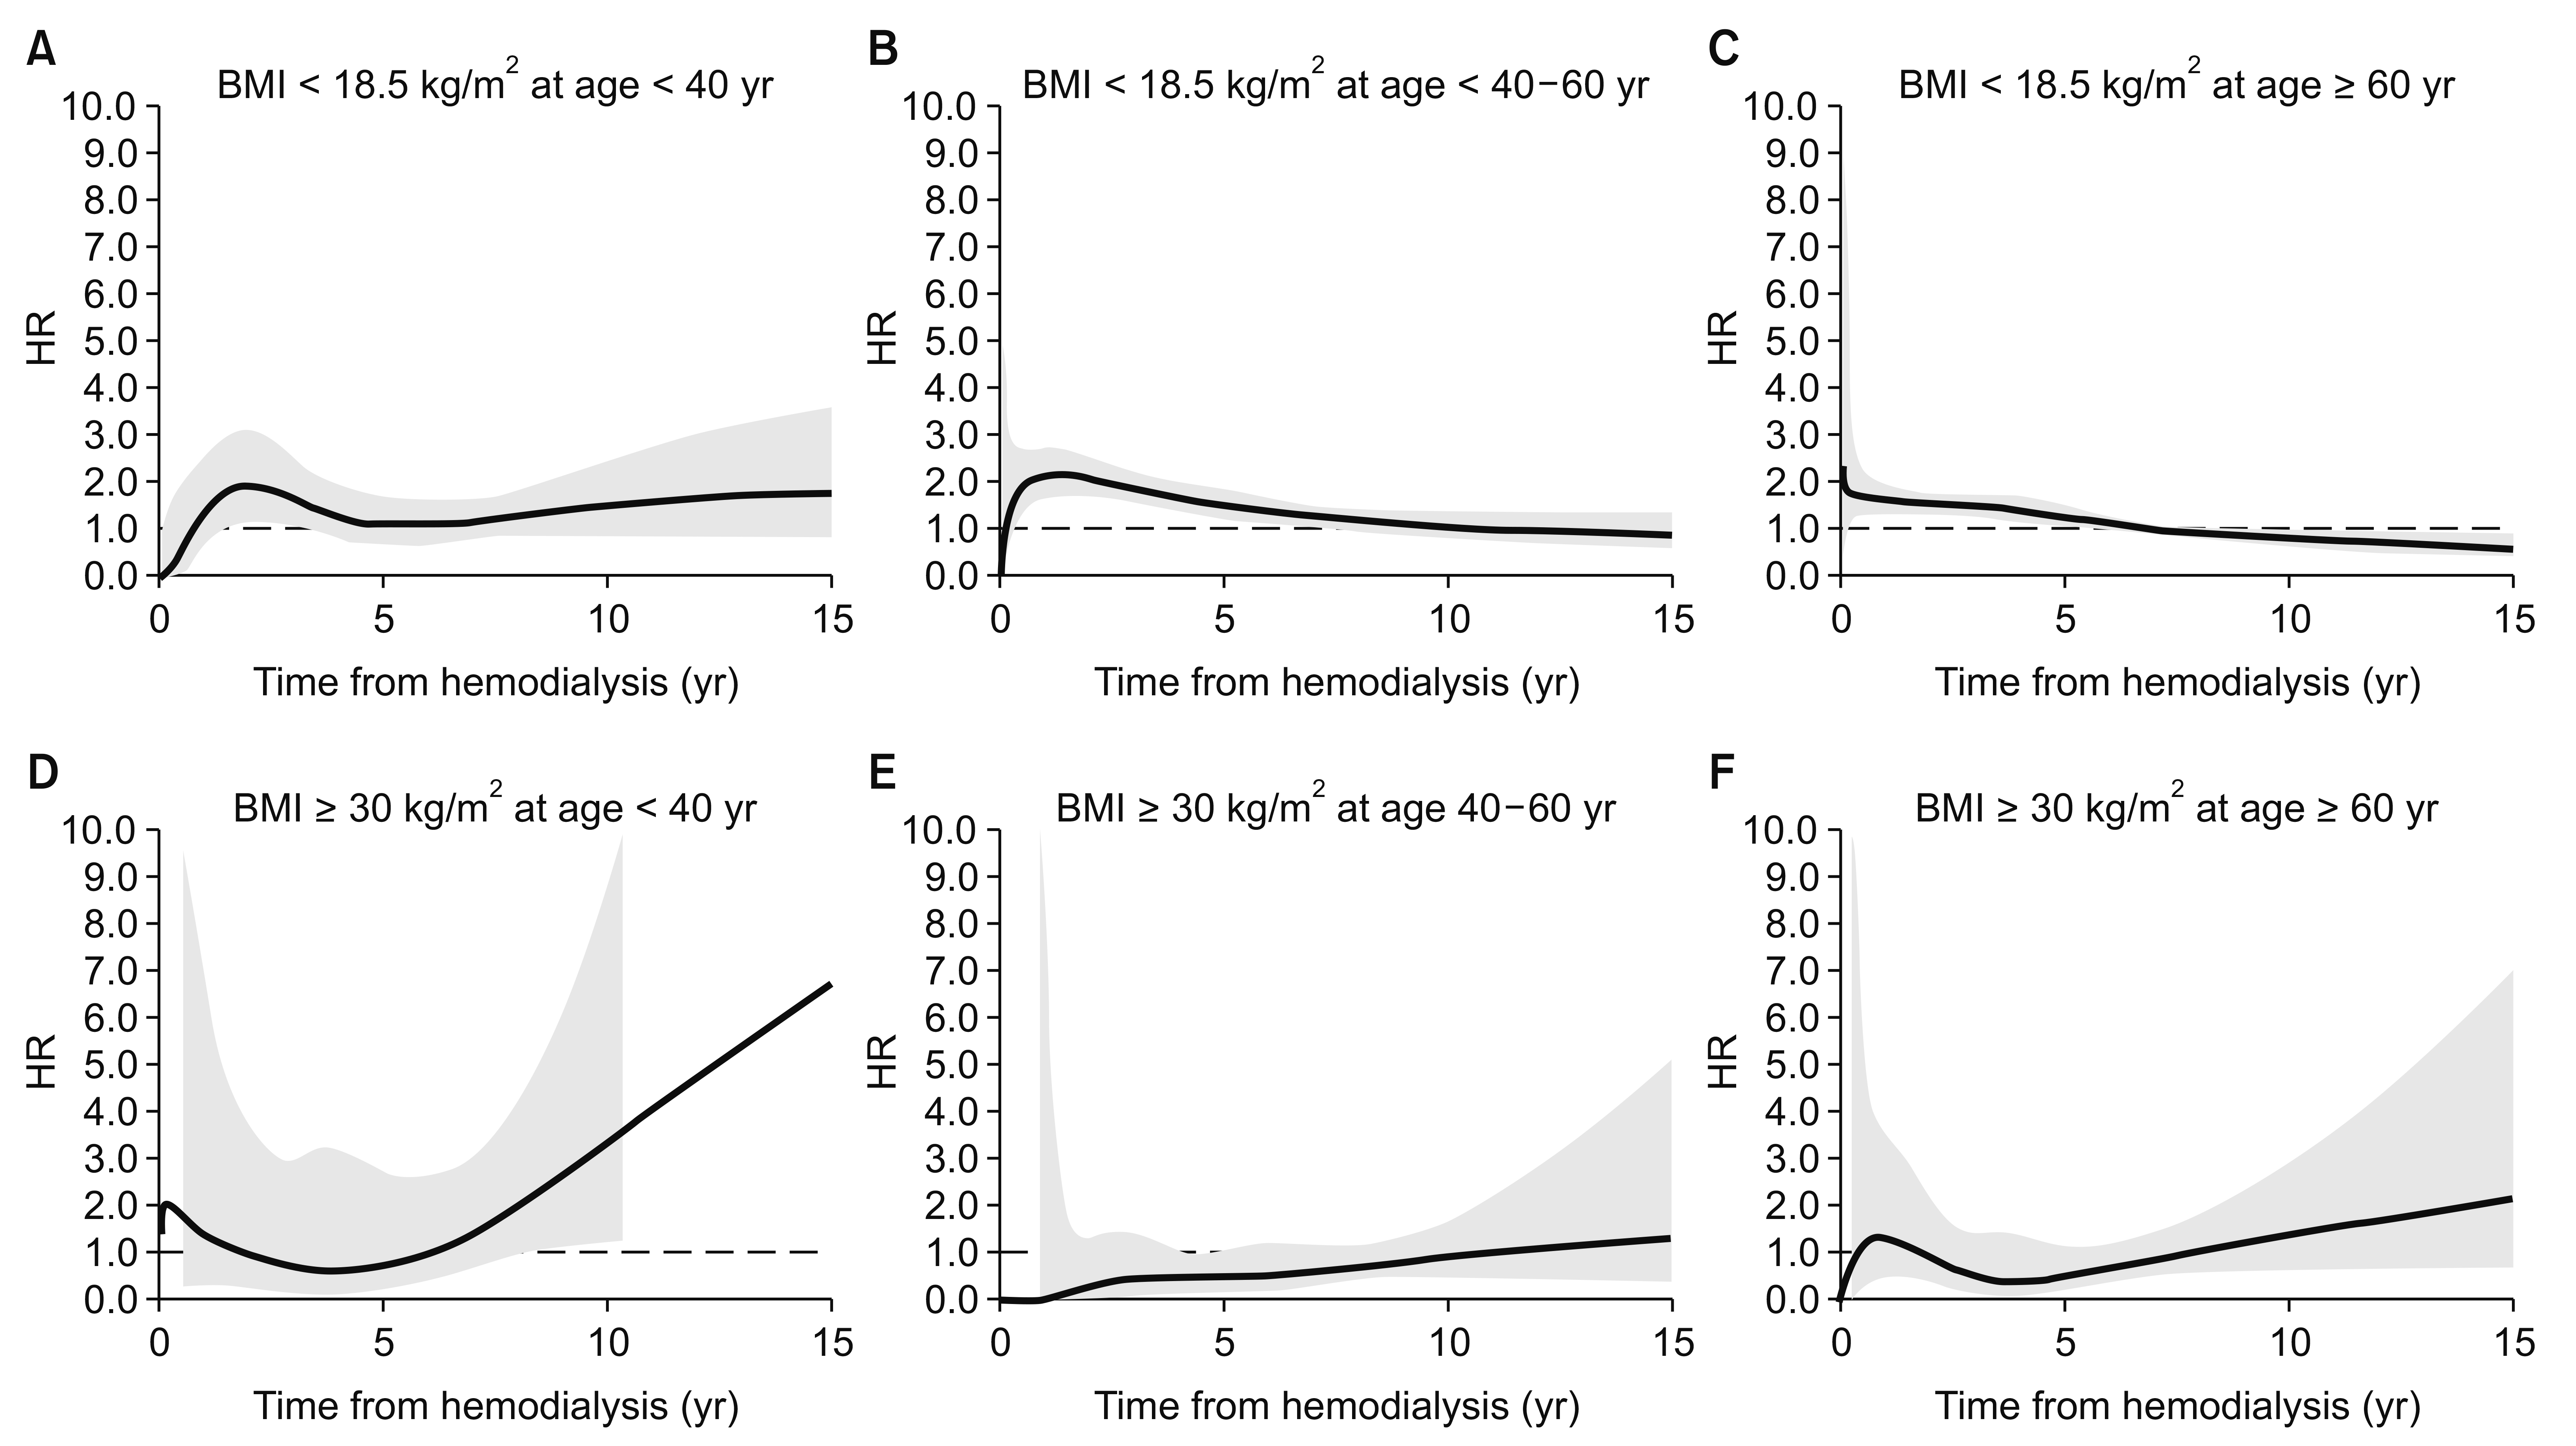
Age-stratified time-dependent hazard ratios (HRs) for low or high body mass index (BMI).
The time-dependent HRs were adjusted for sex and cause of end-stage renal disease. Thick lines indicate continuous HRs, and the grey area reflects 95% confidence intervals for the estimated HRs. The dashed line shows a HR of 1.0. The young and obese group (left lower panel) had a U-shaped time-dependent HR, which reflects increased mortality risk during prolonged dialysis. The underweight group (A–C) had an elevated mortality HR during the early period after dialysis, which subsequently stabilized.
Discussion
In the present study, we evaluated data from a Korean hemodialysis registry and Statistics Korea to determine the relationship between BMI and mortality among patients with ESRD. In addition to adjusting for age strata and comorbidities, we also evaluated temporal trends using time-varying coefficient analysis based on fractional polynomial models. These analyses revealed that overweight status was associated with a significantly reduced risk of mortality. In stratified univariate analyses, overweight status was associated with reduced mortality, although this beneficial effect disappeared in the elderly, non-diabetic, and female subgroups. On the contrary, underweight status was associated with an increased risk of mortality, and this relationship was preserved in the various subgroups. However, the risk of long-term overall mortality was lower in the underweight group, compared to the risk of 5-year mortality. In multivariable adjusted regression, the negative impacts of underweight status were common across age strata, while the beneficial impacts of overweight status or obesity were only observed in the middle age group. Moreover, time-varying analysis revealed that the detrimental effect of underweight status disappeared beginning 7 years after starting hemodialysis, while the beneficial effect of obesity was only observed during the first 7 years after starting hemodialysis. The young obese group (< 40 years old) experienced an increased risk of mortality beginning at 8 years after starting hemodialysis.
The beneficial or detrimental associations of BMI with survival might have been influenced by other conditions. For example, the good survival in the overweight group might have been related to the high prevalence of relatively benign comorbidities, such as well-controlled hypertension. However, overweight status remained a significant beneficial factor in the adjusted multivariable analysis. In addition, female sex had an independent protective effect, and obesity was associated with reduced risk of mortality in the female subgroup. It is also interesting that underweight females experienced a milder increase in their risk of mortality, compared to underweight males. This difference could be attributed to different proportions of diabetes among underweight women and men. However, the prevalence of diabetes was similar across the different BMI groups in our dataset, with the lowest prevalence observed in the obese group. In contrast to our expectations, the beneficial or detrimental effects of BMI were not altered in the diabetic subgroups. Thus, it is difficult to determine whether weight management for patients with ESRD should be customized according to sex or comorbidities. Nevertheless, given the generally negative effect of underweight status, it is important to optimize the timing of planned dialysis, as the uremic milieu could induce weight loss and contribute to the risk of early mortality after starting hemodialysis.
The obesity paradox phenomenon describes the temporal discrepancy between competitive risk factors. Hemodialysis patients are subject to very high short-term mortality risk, while obesity is a long-term cardiovascular risk factor [23]. However, there was previously no clinical relevant evidence to evaluate these questions in the hemodialysis population. We examined time-varying HRs to determine whether the effects of BMI on mortality showed temporal variation. Our findings revealed that the underweight group had increased HRs until 7 years after starting hemodialysis, while the obese group had decreased HRs during years 2 to 7 after starting hemodialysis. The time-varying effects were similar for both sexes, although age-specific differences were observed. In the young obese group, the time-varying HRs exhibited a U-shaped pattern, which reflects an increasing risk of mortality over time. Similar, albeit non-significant, patterns were also observed in the other age groups. It is noteworthy that the increased HRs in the young underweight group disappeared within 3 years after starting hemodialysis, while they persisted for 5 to 7 years in the other age groups. The unique temporal changes of HRs in the young obese group can be interpreted as supporting evidence for long-term cardiovascular risk in those groups, exceeding other short term risk factors seen in other age groups. A previous age-dependent stratification analysis of BMI revealed that young patients exhibited a typical U-shaped pattern in their HRs, although the data were based on a relatively short follow-up period [14]. Thus, it would be interesting to compare the metabolic risk profiles between different ethnic groups of patients with ESRD, as well as their time-varying mortality HRs.
There have been several studies analyzing survival among dialysis patients using Korean nationwide registry data. In one study, BMI was the variable of primary interest, similar to the present study [13]. Ten thousand Korean hemodialysis patients were compared to 10,000 European-Americans and 10,000 African-Americans by propensity score matching. Similar to the results of this study, higher BMI and higher serum creatinine levels were associated with greater survival. Population origin did not modify the association between larger body size and muscle mass with greater survival. However, temporal changes of HRs of BMI were not reported. Another study compared survival rates of patients with different dialysis modalities [24]. Similar to our study, that study used administrative death records. The study sample included more recent incident dialysis patients, which suggests better implementation of contemporaneous study results, but also limitations of shorter follow-up time.
The findings of the present study are strengthened by the fact that we analyzed nationally representative data, with complete long-term follow-up and exclusion of incidence-prevalence bias (that occurs when only considering new cases starting hemodialysis). However, the study also has several limitations. First, only a few covariates were included in the comorbidity profile. Lack of smoking information could be a significant confounder. Second, there no mechanism-related information was collected, while recent studies have indicated that obesity is associated with chronic inflammation [25], and that different BMI groups have different associations with cause-specific mortality [26]. Third, time-varying HRs were based on fixed single point BMI values, not on time varying values. However, a recent large study that adjusted for the confounding effect of time varying values reported similar robust conclusions across conventional models and marginal structural model analyses [27]. In the present study, we used a novel method to explore the time-varying mortality HRs for BMI, which may provide useful prognostic data to guide clinical practice.
In conclusion, during the early post-dialysis period, obese patients experience better survival than underweight patients. However, the effect of BMI on mortality changed over time, and the young obese group had an increased risk of mortality 7 years after starting hemodialysis.
Supplementary Data
Acknowledgments
This research was supported by a grant of the Korea Health Technology R&D Project through the Korea Health Industry Development Institute (KHIDI), funded by the Ministry of Health & Welfare, Republic of Korea (grant number: HI16C2221). The authors thank Stephen McDonald (ANZDATA) for introducing the concept of time-varying coefficient analysis.
Notes
Conflicts of interest
All authors have no conflicts of interest to declare.