Deep learning predicts the differentiation of kidney organoids derived from human induced pluripotent stem cells
Article information

Abstract
Background
Kidney organoids derived from human pluripotent stem cells (hPSCs) contain multilineage nephrogenic progenitor cells and can recapitulate the development of the kidney. Kidney organoids derived from hPSCs have the potential to be applied in regenerative medicine as well as renal disease modeling, drug screening, and nephrotoxicity testing. Despite biotechnological advances, individual differences in morphological and growth characteristics among kidney organoids need to be addressed before clinical and commercial application. In this study, we hypothesized that an automated noninvasive method based on deep learning of bright-field images of kidney organoids can predict their differentiation status.
Methods
Bright-field images of kidney organoids were collected on day 18 after differentiation. To train convolutional neural networks (CNNs), we utilized a transfer learning approach. CNNs were trained to predict the differentiation of kidney organoids on bright-field images based on the messenger RNA expression of renal tubular epithelial cells as well as podocytes.
Results
The best prediction model was DenseNet121 with a total Pearson correlation coefficient score of 0.783 on a test dataset. W classified the kidney organoids into two categories: organoids with above-average gene expression (Positive) and those with below-average gene expression (Negative). Comparing the best-performing CNN with human-based classifiers, the CNN algorithm had a receiver operating characteristic-area under the curve (AUC) score of 0.85, while the experts had an AUC score of 0.48.
Conclusion
These results confirmed our original hypothesis and demonstrated that our artificial intelligence algorithm can successfully recognize the differentiation status of kidney organoids.
Introduction
Organoids are self-organizing three-dimensional (3D) aggregations of cells that represent the structure and function of organs and can be generated from human pluripotent stem cells (hPSCs) in vitro [1–5]. Kidney organoids derived from hPSCs contain multilineage nephrogenic progenitor cells and can recapitulate the development of the kidney [6]. A direct comparison of gene expression and localization between kidney organoids in vitro and human kidneys revealed that podocytes derived from hPSCs resemble podocytes in vivo at the capillary loop stage of glomerular development [6]. Kidney organoids derived from hPSCs can be used in regenerative medicine as well to model renal diseases, function in drug screening, and evaluate the nephrotoxicity of compounds [7–12].
Despite biotechnological advances, individual differences in the morphological and growth characteristics of kidney organoids, despite culture for the same time period and in the same well, have to be addressed prior to their clinical and commercial use [13]. A method for selecting highly matured kidney organoids is required to obtain reproducible and credible data from kidney organoid experiments.
To assess maturity based on the morphological and growth characteristics of kidney organoids, immunohistochemistry, immunofluorescence microscopy, and transcriptomic analysis using real time (RT) polymerase chain reaction (PCR) or single-cell RNA sequencing analysis have been used [13,14]. However, these traditional analytic tools necessitate the destruction of cells within kidney organoids. Analysis of the morphological or growth characteristics of kidney organoids in a living state is essential.
In this study, we hypothesized that basic-contrast bright-field optical microscopy images could be used to assess the differentiation status of kidney organoids. Because manual selection under a microscope with bright-field imaging is subjective and results in variability between observers, a deep learning approach based on bright-field is required [13–17]. In this study, we demonstrated that an automated noninvasive method based on bright-field deep learning was able to predict the differentiation status of kidney organoids.
We used a convolutional neural network (CNN)-based approach to analyze organoid images. The CNN comprises convolutional layers that determine the relationships between spatially adjacent regions of the images. This approach has been used in a variety of fields in biology and medicine. For example, this approach has been applied to classify skin cancer and detect diabetic retinopathy in retinal fundus images [18,19]. Inspired by these examples, we hypothesized that a CNN would be able to extract sufficient information about tissue specification from bright-field images. Therefore, we utilized a CNN to predict the differentiation of kidney organoids and compare its classification performance with that of experts.
Methods
Kidney organoid differentiation
WTC11 induced pluripotent stem cell (iPSC) between passages 30 and 60 were used. Kidney organoid differentiation was induced as described previously [7]. In brief, iPSCs were plated at a density of 5,000 cells/well in a 24-well plate in mTeSR1 medium (Stem Cell Technologies) + 10 µM Y27632 (LC Laboratories) on plates (SPL Life Sciences) coated with 1% GelTrex (Thermo Fisher Scientific) (day –3). The medium was exchanged with 1.5% GelTrex in mTeSR1 (day –2), mTeSR1 (day –1), RPMI (Thermo Fisher Scientific) + 12 µM CHIR99021 (Tocris, Bristol, UK) (day 0), or RPMI + B27 supplement (Thermo Fisher Scientific) (day 1.5) and cells were fed every 2–3 days to promote kidney organoid differentiation. Organoids were analyzed on day 18.
Immunofluorescence analysis
For immunofluorescence, organoids were fixed on day 18 unless otherwise noted. For fixation, phosphate-buffered saline (PBS; Thermo Fisher Scientific) + 4% paraformaldehyde (Electron Microscopy Sciences) was added to the medium for 15 minutes, after which the samples were washed three times with PBS. Fixed organoid cultures were blocked in 5% donkey serum (Millipore) + 0.3% Triton‐X‐100/PBS, incubated overnight in 3% bovine serum albumin (SigmaAldrich) + PBS with primary antibodies, washed, incubated with AlexaFluor secondary antibodies (Invitrogen), washed, and stained with DAPI or mounted in Vectashield H‐1000. Images were acquired using a Zeiss LSM 700 confocal microscope (Carl Zeiss) and ZEN 3.1 software.
The following primary antibodies were used: anti-ECAD (1:100, ab11512; Abcam), anti-LTL (1:100, FL‐1321; Vector Labs), and anti-nephrosis 1 (NPHS1) (1:100, AF4269; R&D System).
Quantitative real time polymerase chain reaction
Kidney organoid samples were harvested, and total RNA from each sample was isolated using an RNAiso Plus Kit (Takara) according to the manufacturer’s instructions. Complementary DNA (cDNA) was synthesized using a Maxima First Strand cDNA Synthesis kit for RT-qPCR (Thermo Fisher Scientific). Gene expression was analyzed with Power SYBR Green PCR Master Mix (Applied Biosystems) using real-time PCR (Applied Biosystems). Specific primers used were: human synaptopodin (SYNPO), F-5’ GCTGAGGAGGTGAGATGCAG and R-5’ CTCTGGAGAAGGTGCTGGTG; NPHS1, F-5’ GGCTCCCAGCAGAAACTCTT and R-5’ CACAGACCAGCAACTGCCTA; sodium-glucose cotransporter 2 (SGLT2), F-5’ GGGTTACGCCTTCCACGAG and R-5’ AGATGTTTCCCACGGCTGG; gamma-glutamyltransferase 1 (GGT1), F-5’ TGACCTTCAGGAGAACGAGA and R-5’ TCTTCTTCATGGCTCTGCGT; E-cadherin (ECAD), F-5’ CGAGAGCTACACGTTCACGG and R-5’ GGGTGTCGAGGGAAAAATAGG; and glyceraldehyde 3-phosphate dehydrogenase, F-5’ AGGGCTGCTTTTAACTCTGGT and R-5’ CCCCACTTGATTTTGGAGGGA. All quantitative RT-PCR (qRT-PCR) reactions were performed in triplicate and relative messenger RNA (mRNA) expression levels were determined using the 2-ΔΔCt method.
Dataset preprocessing
We preprocessed the kidney organoid dataset as described below before introducing the bright-field images of kidney organoids into our proposed deep neural network model. Because the considered bright-field images of kidney organoids contain noisy regions, e.g., floating inclusions, we cropped all regions except the organoid region. We also used this cropping process to register the positions of the different organoids. For preprocessing of input dimensions, we used zero padding on cropped bright-field images of kidney organoids to avoid losing spatial information present for each image. Most typical methods, e.g., resizing, prevent the model from extracting spatially relevant features. Additionally, we applied min-max normalization to the bright-field images of the kidney organoid and qRT-PCR expressions. We also augmented the training images by flipping the images horizontally and vertically and rotating these images 90°.
Proposed prediction method
Differentiation of kidney organoids based on bright-field images was predicted using CNNs. We utilized a transfer learning-based approach with four well-performing models (ResNet50 [20], InceptionV3 [21], EfficientNetB5 [22], and DenseNet121 [23]) pretrained on ImageNet [24]. ResNet50 could solve the problem of vanishing or exploding gradients with skip connections. These add the input to the output after weight layers. InceptionV3 aims for less computational power by optimizing the network using a variety of strategies such as factorized convolutions and dimension reduction. EfficientNetB5 is a model that is constructed by efficiently balancing the layer scaling factors like width, depth, and image resolution. DenseNet121 contains densely connected layers and these connections create strong supervision, allowing the connections to obtain information related to the differentiation status of kidney organoids on bright-field images. While these models’ hyper-parameters are optimized to maximize their regression performance with regard to predicting the differentiation of kidney organoids, we performed comparison studies to determine which model exhibited the best predictive performance for different biomarkers of kidney organoids. To assess the predictive performance of the CNN models, we used Pearson correlation coefficient (PCC) scores. PCC scores can be used to measure the linear correlation between actual and predicted values and can be expressed as:
where Y and
The above method of optimizing CNN models according to specific and various substructures of organoids was used as a biomarker selection criterion. We determined the optimal biomarkers in each substructure of kidney organoids, such as podocytes and proximal tubules, by comparing the performance of deep learning models. We evaluated two biomarkers for each substructure and selected one of these to determine whether the kidney organoids were highly differentiated using deep learning.
Last, we adopted a gradient-based class activation mapping (gradCAM) method to further evaluate the proposed model’s visual contributions to the prediction results [25]. To validate the gradCAM method, we implemented a qualitative comparison using immunofluorescence images of kidney organoids. As long as the substructure of kidney organoids was correctly highlighted, we were able to determine their differentiation status in a noninvasive manner using gradCAM.
Proposed classification method
To verify that our proposed method can potentially be utilized to guide the selection of biomarkers for predicting the differentiation of kidney organoids, we compared its performance to those of experts. Organoid images were used; images with above-average quantitative PCR (qPCR) expression were labeled as Positive, and images with below-average expression were labeled as Negative.
Accuracy, sensitivity, specificity, F1 score, receiver operating characteristic (ROC)-area under the curve (AUC), and the time required to perform the task were compared between our algorithm and experts. Accuracy is a statistical measure that refers to the proportion of correct determinations divided by the total number of images in the dataset. Sensitivity is defined as the true positive rate of all images with a condition, and specificity is defined as the true negative rate of all images that did not have a condition. The F1 score is the harmonic mean of the sensitivity and precision, which in this study referred to the proportion of correct positive predictions divided by the number of total images that were positive. The AUC score is calculated as the area under ROC curves where the false positive rate versus the true positive rate was plotted for different threshold values. The Student t test was used in the between-group analysis. The tested null hypothesis was that two independent samples would have identical averages and the populations would have identical variance. The p-value indicates the probability of observation above the extreme values if the hypothesis is true.
Results
Differentiation of human induced pluripotent stem cell-derived kidney organoids and the collection of the training dataset
To generate kidney organoids derived from human iPSCs, we applied an adherent culture differentiation protocol (Fig. 1A). On day 18 of differentiation, human iPSC-derived kidney organoids had discrete nephron-like structures consisting of podocytes, proximal tubules, and distal tubules (Fig. 1B). Bright-field microscopy showed that the kidney organoids had different morphologies (distribution of podocytes, proximal tubules, and distal tubules) from one another despite differentiation for the same amount of time (18 days) (Fig. 2A). Given our hypothesis that the morphology of kidney organoids obtained by bright-field microscopy reflects the gene expression of podocytes, proximal tubules, and distal tubules, we performed a preliminary experiment. An expert-selected 15 kidney organoids with “good morphology” and 15 kidney organoids with “unsatisfactory morphology” according to bright-field microscopy morphology (Fig. 2B); and qPCR was performed using primers targeting podocyte-, proximal tubule-, and distal tubule-specific genes (Fig. 2C). Fig. 2C shows that the gene expression of NPHS1 and SYNPO (podocyte markers), SGLT2 and GGT1 (proximal tubular markers), and ECAD (distal tubular marker) were significantly increased in kidney organoids with a “good morphology” compared to those with an “unsatisfactory morphology.” These findings suggest that accurate analysis of morphology by bright-field microscopy could predict the degree of differentiation of kidney organoids.

Kidney organoid differentiation.
(A) Kidney organoid differentiation protocol. Kidney organoids were analyzed on day 18 of differentiation. (B) Immunofluorescence staining images show that podocytes (NPHS1), proximal tubules (LTL), and distal tubules (ECAD) were evenly distributed in the kidney organoid.
ECAD, E-cadherin; iPSC, induced pluripotent stem cell; NPHS1, nephrosis 1.
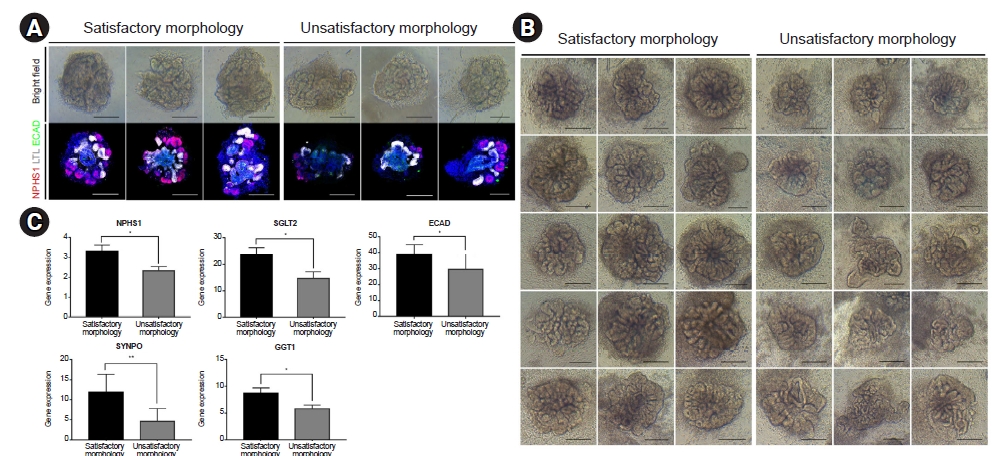
Comparison of the morphology and gene expression levels of kidney organoids.
(A) Organoids were visually selected and classified into two categories, satisfactory and unsatisfactory morphology, and stained with NPHS1, LTL, and ECAD antibodies for immunofluorescence staining. NPHS1, LTL, and ECAD were evenly expressed in organoids with a satisfactory morphology, whereas in unsatisfactory morphology organoids, these markers had reduced or biased expression levels (scale bar = 200 μm). (B) The top 10% and bottom 10% of the organoid bright-field images were compared (scale bar = 200 μm). (C) Gene expression levels of NPHS1, SYNPO (podocyte markers), SGLT2, GGT1 (proximal tubular markers), and ECAD (distal tubular marker) in (B) were compared and are presented in a graph.
ECAD, E-cadherin; NPHS1, nephrosis 1; SGLT2, sodium-glucose cotransporter 2; SYNPO, synaptopodin.
*p < 0.05, **p < 0.01.
For an objective analysis of the bright-field images of the kidney organoids, approximately 150 kidney organoids were differentiated and analyzed. To train our model and label the dataset, we collected bright-field images for each kidney organoid on day 18 of differentiation and performed qPCR using podocyte-, proximal tubule-, and distal tubule-specific primers.
Convolutional neural network can predict the differentiation of kidney organoids
We conducted experiments with several CNN models to predict the differentiation of kidney organoids. As the feature extractors, four CNN models, i.e., ResNet50, InceptionV3, EfficientNetB5, and DenseNet121, were trained using the kidney organoid dataset. To compare the prediction performance of the above models, we used the PCC; +1 indicates a complete positive linear correlation; and the closer the value is to +1, the better the performance of the deep learning model. Furthermore, we employed a five-fold cross-validation method for each model to evaluate its predictive ability by averaging the prediction results for each data fold set to improve the reliability of the results.
We predicted the qPCR expressions of the following biomarkers: NPHS1, SYNPO, SGLT2, GGT1, and ECAD. Quantitative results, namely the average and standard deviation values of PCC scores for estimating the qPCR expression values of kidney organoids on the testing set, are provided in Table 1. DenseNet121 achieved remarkable performance for all biomarkers except NPHS1, and EfficientNetB5 slightly outperformed DenseNet121 by 0.022 with regard to the qPCR expression of NPHS1. DenseNet121 was the optimal model for predicting the differentiation of kidney organoids and extracting features from bright-field images of the organoids. We confirmed that the total PCC score of DenseNet121 was 0.783; this indicates a strong positive relationship between actual and predicted values. These results suggest that a deep learning method overcomes the limitation of predicting qPCR expression using only two-dimensional (2D) microscopic image data of kidney organoids.

Comparison of Pearson correlation coefficient scores among convolutional neural network models
In addition, there was a high correlation between actual and predicted values when SGLT2 was predicted using DenseNet121; the average PCC score was 0.874. In this way, we developed an appropriate deep learning model (DenseNet121) to analyze the differentiation of kidney organoids.
As several biomarkers can be used to evaluate the differentiation of kidney organoid substructures, we developed criteria for selecting the most suitable biomarkers using deep learning. As shown in Fig. 3A, prediction performance was compared by assessing the correlations between the actual and predicted qPCR expression levels of the biomarkers NPHS1 and SYNPO, which are expressed in podocytes. All CNN models showed a better ability to predict the expression of NPHS1 than of SYNPO. For example, the PCC score of EfficientNetB5 for predicting the expressions of NPHS1 was 0.778, while the PCC of the best model for SYNPO, i.e., DenseNet121, was 0.719. Similarly, all CNN models better predicted the expressions of SGLT2 than of GGT1 (biomarkers indicating the degree of differentiation of the proximal tubule), with DenseNet121 yielding a PCC score of 0.874 for SGLT2 (Fig. 3B). These results indicate that the expression of NPHS1, SGLT2, and ECAD can be utilized to analyze the differentiation of kidney organoid substructures, i.e., podocytes, proximal tubules, and distal tubules, respectively, in a noninvasive manner.
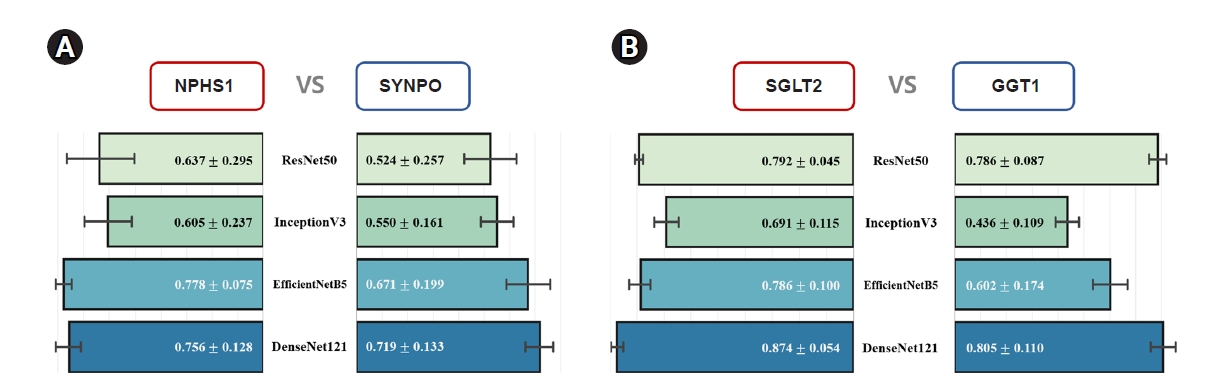
Comparison of biomarkers in the various substructures of kidney organoids.
(A) Prediction results for podocytes (NPHS1, SYNPO). (B) Prediction results for proximal tubules. The convolutional neural network as a whole predicted NPHS1 and SGLT2 expression better than it did SYNPO and GGT1 expression.
GGT1, gamma-glutamyltransferase 1; NPHS1, nephrosis 1; SGLT2, sodium-glucose cotransporter 2; SYNPO, synaptopodin.
We further compared immunofluorescence images with activation maps to predict qPCR expressions. We employed gradCAM, which highlights regions on the CNN model’s activation map to predict expression. In other words, gradCAM, utilizing the gradient information of parameters and feature maps in the internal layers of the network, can be used to interpret the decision-making for predicting the qPCR expressions. Immunofluorescence images of kidney organoids and the activation maps of the proposed model for predicting the expression of selected biomarkers, i.e., NPHS1, SGLT2, and ECAD, are shown in Fig. 4. Red, white, and green regions in the immunofluorescence images correspond to NPHS1, SGLT2, and ECAD expression, respectively; these images demonstrate that the activation maps focused attention on the appropriate regions. This highlights the importance of activation maps in accurately predicting qPCR expression.
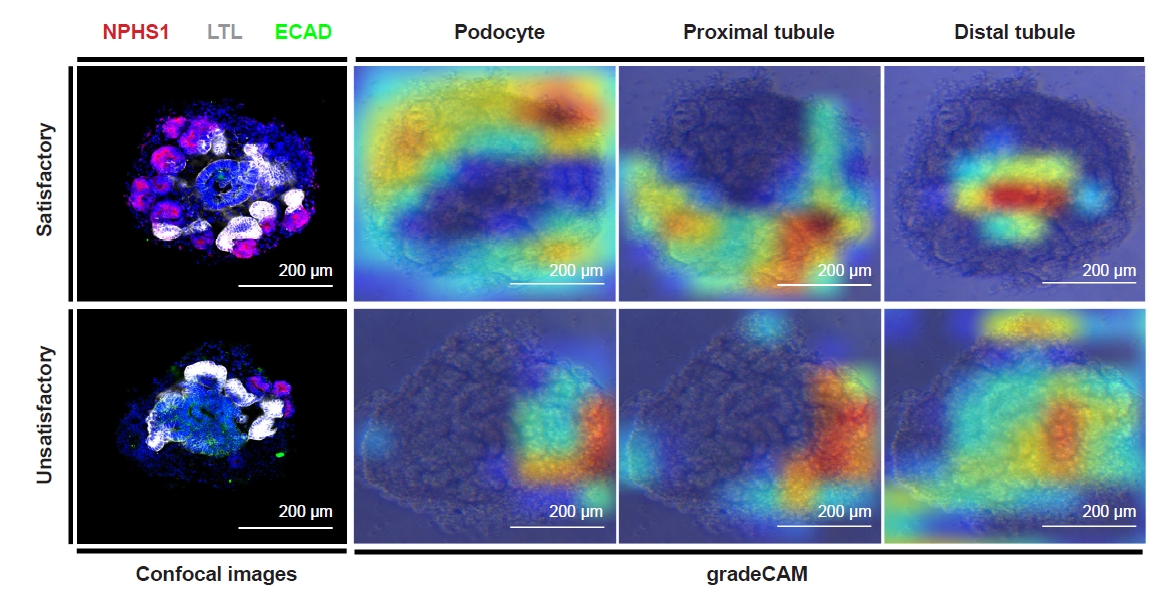
Visual interpretation of the convolutional neural network model’s decision-making based on immunofluorescence microscopic images.
Representative confocal images of kidney organoids with a “satisfactory morphology.” Representative images of the gradient-weighted class activation mapping (gradCAM) of podocyte, proximal tubule, and distal tubule in kidney organoids with a “satisfactory morphology.” Representative confocal images of kidney organoids with an “unsatisfactory morphology.” Representative images of the gradCAM of podocyte, proximal tubule, and distal tubule in kidney organoids with an “unsatisfactory morphology.”
ECAD, E-cadherin; NPHS1, nephrosis 1.
Convolutional neural network is more beneficial for classification of kidney organoids compared to human classifiers
To compare the performance of our DenseNet121 model with that of experts, we requested that two independent experts assign the following labels to kidney organoids: “useful organoids (Positive)” or “nonuseful organoids (Negative).” As shown in Fig. 5A, we employed metrics of accuracy, sensitivity, specificity, F1 score, and AUC to evaluate the classification performance of the experts and the proposed model. Comparing the best-performing CNN with human-based classifiers, the CNN algorithm had an accuracy of 76.67%, while the experts had an accuracy of 48.94% in classifying the organoids. DenseNet121 had an AUC average score of 0.85, while the experts had an AUC score of 0.48.

Comparison of a human-based classifier and CNN-based classifier.
(A) Evaluation of the classification performance with accuracy, sensitivity, specificity, F1 score, and AUC. (B) Times needed by the experts and our CNN to classify organoids. CNN classified organoids about 74 times faster than experts.
AUC, the area under the receiver operating characteristic curve; CNN, convolutional neural network.
* p < 0.05, **p < 0.01.
Times needed by the experts and our CNN to classify organoids are shown in Fig. 5B. The experts required 1.04 seconds to empirically judge the differentiation of kidney organoids using morphological information from bright-field images. In contrast, the deep learning model required 0.014 seconds to generate highly accurate classification results. This indicates that our noninvasive analysis technique is suitable for assessing the differentiation of kidney organoids in real-time.
Discussion
Despite the advances in differentiating kidney organoids from hPSCs, these organoids are still immature compared with human adult kidneys. Kim et al. [6] reported that hPSC-podocytes of kidney organoids have junction-rich basal membranes with junctional migration and microvillus-rich apical membranes but do not form bona fide foot processes with tertiary interdigitations seen in the capillary loop stage of glomerular development in the human kidney. Using single-cell transcriptomic analysis, Wu et al. [26] demonstrated that kidney organoid cells are immature compared with fetal and adult human kidneys, and 10% to 20% of kidney organoid cells are nonrenal, “off-target” cells. Kim et al. [27] showed that the hPSC-proximal tubule of kidney organoids has a resorption function similar to that of in vivo, but the barrier function of tubular structures is still immature.
To overcome the immaturity and the clinical application of kidney organoids for nephrotoxicity testing or regenerative medicine, an advanced protocol to generate highly matured kidney organoids similar to adult human kidneys is required. Predicting the maturity and selecting matured kidney organoids may also be an attractive option for their clinical use [28].
In this study, we proposed a deep learning-based noninvasive method for accurate and rapid prediction of kidney organoid differentiation.
We first utilized different CNN models as feature extractors to predict the mRNA expressions of specific kidney biomarkers using morphological information present in bright-field images of kidney organoids. We employed the gradCAM method to highlight regions in immunofluorescence images in which to predict gene expression and identified an optimal CNN model suitable for identifying well-differentiated kidney organoids. Our proposed CNN model was more accurate and faster at classification than were the experts.
Previous studies reported the utilization of deep learning in the field of organoid technology [13–17]. To predict the differentiation status of retina organoids, Kegeles et al. [13] trained CNNs on bright-field images of retina organoids labeled with RxGFP and divided organoids into retina and non-retina based on fluorescent reporter gene expression. Their deep learning-based computer algorithm to predict retinal differentiation in stem cell-derived organoids based on bright-field imaging, performed better than the expert in predicting retina organoid fate [13].
We predicted the differentiation level of kidney organoids based on mRNA expression levels rather than 2D confocal images of kidney organoids as in a previous study. In kidney organoids, the prediction of differentiation based on 2D confocal images has some disadvantages. Because kidney organoids are 3D structures, 2D confocal images might not accurately reflect tubular structures or podocytes and vascular networks and can be unsuitable for obtaining quantitative biomarker expression data. Furthermore, the predictive power of deep learning based on 2D confocal images can be weakened by the lack of a clear consensus of criteria that can be used to assess the differentiation of kidney organoids from 2D confocal images.
However, prediction based on mRNA expression levels has several advantages. mRNA expression levels represent the levels in the entire kidney organoids. Quantitative data for 6 to 10 genes can be obtained simultaneously for one kidney organoid, which facilitates the comparison of various biomarkers among kidney organoids. For this reason, we chose to assess the differentiation level of kidney organoids based on mRNA expression levels rather than 2D confocal images.
However, prediction based on mRNA expression levels does have some limitations. First, protein expression and the structural development stage of the kidney organoids are not necessarily correlated with mRNA expression levels. The development of CNN models based on the combination of mRNA expression levels and 2D confocal images can increase the accuracy of prediction of the differentiation status of kidney organoids. Second, to assess the precise maturity of kidney organoids, analysis of cell-to-cell interaction and function of kidney organoids is essential. However, the CNN model based on mRNA expression in this study is limited to predicting the cell-to-cell interaction and function of kidney organoids. In addition, in terms of the CNN-based approach, there is a limit to analyzing 3D-shaped organoids only in 2D bright-field images. The advanced CNN models to predict the cell-to-cell interaction based on single-cell RNA sequencing analysis as well as predict the functionality of kidney organoids are needed.
In conclusion, we demonstrated that a CNN model could accurately predict kidney organoid differentiation based on the analysis of simple bright-field images of kidney organoids. This noninvasive and nondestructive prediction method may accelerate the transition of kidney organoid technology “from the bench to the bedside.”
Notes
Conflicts of interest
All authors have no conflicts of interest to declare.
Funding
This research was supported by the Basic Science Research Program through grants from the National Research Foundation of Korea (NRF) funded by the Ministry of Education, Science, and Technology (NRF-2021R1A2B5B01001793 and NRF-2021M3E5E5095889). This research was also supported by the Korean Fund for Regenerative Medicine funded by the Ministry of Science and ICT and the Ministry of Health and Welfare (21B0601L1-01). This work was supported by the Priority Research Centers Program through the National Research Foundation of Korea (NRF) funded by the Ministry of Education (2020R1A6A1A03047902). The authors would also like to acknowledge financial support from the Research Institute of Medical Science of St. Vincent’s Hospital (SVHR-2019-03).
Data sharing statement
The data presented in this study are available on request from the corresponding author.
Authors’ contributions
Conceptualization: KHP, JYL, SL, YKK
Data curation, Formal analysis, Visualization: KHP, JYL
Funding acquisition, Supervision: HWP, YKK, SCL
Investigation, Methodology, Resources: All authors
Project administration: KHP, JYL, HWP, YKK, SCL
Software: KHP
Writing–original draft: KHP, JYL, HWP, YKK, SCL
Writing–review & editing: All authors
All authors read and approved the final manuscript.
Acknowledgements
The authors would like to acknowledge all statisticians for participating in this study.