Triglyceride-glucose index is an independent predictor of coronary artery calcification progression in patients with chronic kidney disease
Article information
 , Hyung Woo Kim1, Jung Tak Park1, Seung Hyeok Han1, Shin-Wook Kang1,3, Suah Sung4, Kyu-Beck Lee5, Joongyub Lee6, Kook-Hwan Oh7, Tae-Hyun Yoo1, on behalf of the KNOW-CKD investigators
Abstract
Background
Coronary artery calcification (CAC) is highly prevalent in patients with chronic kidney disease (CKD) and is associated with major adverse cardiovascular events and metabolic disturbances. The triglyceride-glucose index (TyGI), a novel surrogate marker of metabolic syndrome and insulin resistance, is associated with CAC in the general population and in patients with diabetes. This study investigated the association between the TyGI and CAC progression in patients with CKD, which is unknown.
Methods
A total of 1,154 patients with CKD (grades 1–5; age, 52.8 ± 11.9 years; male, 688 [59.6%]) were enrolled from the KNOW-CKD (KoreaN Cohort Study for Outcomes in Patients With Chronic Kidney Disease). The TyGI was calculated as follows: ln (fasting triglycerides × fasting glucose / 2). Patients were classified into tertiles (low, intermediate, high) based on the TyGI. The primary outcome was annualized percentage change in CAC score [(percent change in CAC score + 1)12/follow-up months – 1] of ≥15%, defined as CAC progression.
Results
During the 4-year follow-up, the percentage of patients with CAC progression increased across TyGI groups (28.6%, 37.5%, and 46.2% in low, intermediate, and high groups, respectively; p < 0.001). A high TyGI was associated with an increased risk of CAC progression (odds ratio [OR], 2.11; 95% confidence interval [CI], 1.14–3.88; p = 0.02) compared to the low group. Moreover, a 1-point increase in the TyGI was related to increased risk of CAC progression (OR, 1.55; 95% CI, 1.06–1.76; p = 0.02) after adjustment.
Conclusion
A high TyGI may be a useful predictor of CAC progression in CKD.
Introduction
Coronary artery calcification (CAC) and its progression are known to be related to cardiovascular events [1–3]. Many studies have reported the association between CAC and metabolic disturbances such as central obesity, insulin resistance, and dyslipidemia [4–8]. The triglyceride-glucose index (TyGI) is a reliable surrogate marker of insulin resistance [9], and it is considered even more sensitive and specific than the Homeostatic Model Assessment for Insulin Resistance [10]. There have been several studies on insulin resistance and its relationship with cardiovascular events in the general population and in patients with diabetes mellitus (DM) [11–14]. For patients with chronic kidney disease (CKD), cardiovascular disease (CVD) and cerebrovascular disease are major causes of mortality [15]. While CKD itself is a potential risk factor for CVD, the previous CRIC (Chronic Renal Insufficiency Cohort) study consisting of patients with estimated glomerular filtration rate (eGFR) ranging from 20 to 70 mL/min/1.73 m2 showed that CAC was significantly independently related to increased risk of CVD [16]. In addition to this, CAC is associated with both a higher risk of CVD and an increased risk of CKD progression [17]. Nevertheless, few studies have investigated the connection between the TyGI and CAC progression in patients with CKD. Therefore, this study aimed to investigate the association between the TyGI and CAC progression in patients with CKD.
Methods
Patients
The participants were enrolled from the nationwide multi-center prospective observational cohort of the KNOW-CKD (KoreaN Cohort Study for Outcomes in Patients With Chronic Kidney Disease) which consists of 2,238 Korean predialysis patients with grade 1 to 5 CKD aged between 20–75 years. This cohort study included patients with grade 1 to 2 CKD who had albuminuria or different early kidney damage markers even with a normal or slightly decreased glomerular filtration rate. Patients with previous chronic dialysis, kidney transplantation, or unavailable demographic information, lab data, or CAC score were excluded. Finally, 1,154 patients with grade 1 to 5 CKD were enrolled and classified into one of three groups based on the baseline TyGI: low (n = 382), intermediate (n = 387), or high (n = 385) (Fig. 1).
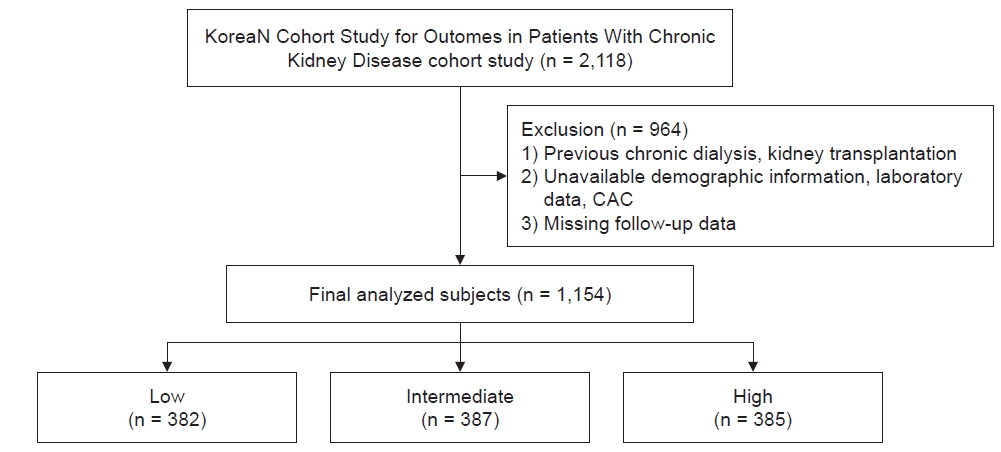
Flow diagram for the patients enrolled in this study.
CAC, coronary artery calcification.
The study rationale, design, and methods are described in detail elsewhere [18]. The Institutional Review Board of each participating center approved the study protocol. All patients gave written informed consent at enrollment.
Data collection
Demographic and clinical data including age, sex, alcohol consumption, smoking history, comorbidities, and medications were collected at the time of enrollment. Patients stood barefoot to measure their height to the nearest 0.1 cm using a digital stadiometer. Bodyweight was measured to the nearest 0.1 kg in light clothes without shoes, using standard methods. Body mass index (BMI) was calculated as weight / height2. Blood pressure (BP) was measured after 5 minutes of resting in a sitting position at the office by a trained nurse using a mercury sphygmomanometer or calibrated oscillometer electronic sphygmomanometer at each participating center according to the American Heart Association standardized protocol [19]. The mean of three BP measurements from each visit was used as the BP value. The electronic device was validated by comparing the device readings alternating with five mercury sphygmomanometer values. Hypertension was defined as BP of ≥140/90 mmHg, self-reported hypertension, or current use of antihypertensive drugs such as calcium-channel blockers, angiotensin-converting enzyme inhibitors, angiotensin-receptor blockers, beta-blockers, and diuretics. DM was defined as self-reported DM, fasting plasma glucose of ≥126 mg/dL, or use of glucose-lowering drugs. Smoking status was binarized as current smoker or former/never smoker. Alcohol drinkers were defined as patients who drink alcohol more than twice a week. All data including baseline demographic information and laboratory data were gained from the electronic data management system (PhactaX). Laboratory data such as hemoglobin, blood urea nitrogen (BUN), creatinine, uric acid, total cholesterol, triglycerides, high-density lipoprotein cholesterol (HDL-C), low-density lipoprotein cholesterol (LDL-C), calcium, phosphate, and parathyroid hormone (PTH) levels were measured from overnight fasting venous samples. Fibroblast growth factor 23 (FGF-23) was measured by enzyme-linked immunosorbent assay (Immutopics). The TyGI was calculated as follows: ln (fasting triglycerides × fasting glucose / 2).
Outcome measures
CAC scores were measured at enrollment and at the 4-year follow-up. CAC was assessed via electrocardiography-gated coronary 64-slice multidetector chest computed tomography. The CAC density score was calculated by dividing the Agatston score by the total area score by experienced cardiac radiologists from each participating center. The primary outcome was CAC progression, which was defined as an annualized percentage change in CAC scores ≥15% [20–24]. As in previous studies [25], the percentage change of CAC score was defined as [(CAC score at follow-up) – (CAC score at enrollment)] / (CAC score at enrollment + 1). Adding 1 to the CAC score at enrollment in the denominator allows for the inclusion of patients with a baseline CAC score of 0. Furthermore, the annualized percentage change in CAC score was calculated as (percent change of CAC score + 1)1/4 – 1. The value “1/4” in this equation was derived from (12/follow-up months), where the number of follow-up months is 48. Secondary outcomes included major adverse cardiovascular events (MACE), such as myocardial infarction, nonfatal stroke, and all-cause mortality.
Statistical analysis
Continuous variables were stated as mean ± standard deviation and categorical variables as number (percentage). Baseline characteristics and changes in CAC scores were compared between groups using analysis of variance for continuous variables and the chi-square test for categorical variables. Multivariable logistic regression analyses were performed to evaluate the association between the TyGI and CAC progression in each group. Odds ratios (ORs) and 95% confidence intervals (CIs) were used to provide the relative risk for CAC progression. Statistical analyses in this study were performed using IBM SPSS version 26 (IBM Corp.), and R software version 4.3.2 (R Foundation for Statistical Computing). A p-value of <0.05 was considered significant.
Results
Baseline characteristics
The mean age of study subjects was 52.8 ± 11.9 years and 688 (59.6%) were male. The mean TyGI was 8.8 ± 0.6 in all patients, 8.2 ± 0.3 in the low TyGI group, 8.8 ± 0.2 in the intermediate group, and 9.5 ± 0.4 in the high group. Compared to the low TyGI group, patients with a high TyGI tended to be older, have higher BMI and systolic BP (SBP), and more comorbidities such as hypertension and DM. The high TyGI group also had higher levels of calcium, BUN, creatinine, fasting plasma glucose, total cholesterol, and triglycerides but lower eGFR and HDL-C compared to the low TyGI group. There were no significant differences in bone mineral disease markers such as phosphate, alkaline phosphate, FGF-23, or total PTH other than calcium among different TyGI groups (Table 1).

Baseline characteristics at enrollment among patients stratified by TyGI
Baseline and change in coronary artery calcification
During the 4-year follow-up, the median value of annualized percentage change of patients with CAC progression increased across TyGI groups (0%, 7.0%, and 13.6% in low, intermediate, and high TyGI groups, respectively; p < 0.001) (Table 2, Fig. 2). The percentage of patients with CAC progression increased across TyGI groups (28.6%, 37.5%, and 46.2% in low, intermediate, and high TyGI groups, respectively; p < 0.001) (Table 2).

Change in CAC scores stratified by TyGI
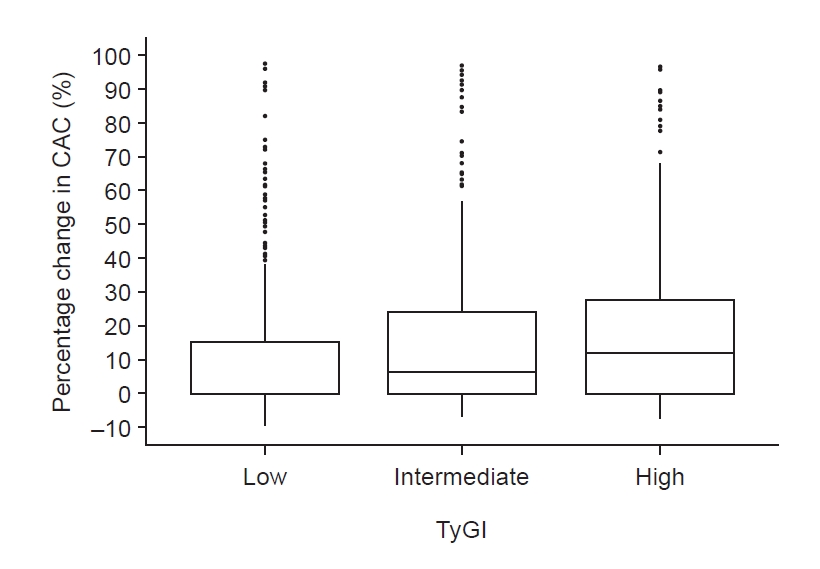
Percentage change in CAC among different TyGI groups.
Percentage change of patients with CAC progression increased across TyGI groups (with the mean values of 16.7%, 20.8%, and 24.9% in low, intermediate, and high TyGI groups, respectively; p < 0.001).
CAC, coronary artery calcification; TyGI, triglyceride-glucose index.
Association between triglyceride-glucose index and coronary artery calcification progression in patients with chronic kidney disease
In multivariable logistic regression analysis, the high TyGI group was associated with increased risk of CAC progression (OR, 2.11; 95% CI, 1.14–3.88; p = 0.02) compared to the low TyGI group after adjusting for age, sex, BMI, waist circumference, smoking status, alcohol status, exercise, hypertension, DM, SBP, eGFR, urine protein creatinine ratio, LDL-C, and HDL-C. Moreover, a 1-point increase in the TyGI was related to increased risk of CAC progression (OR, 1.55; 95% CI, 1.06–1.76; p = 0.003) after adjusting for confounding factors (Table 3).

ORs for CAC progression according to the TyGI
Association between the triglyceride-glucose index and major adverse cardiovascular events in patients with chronic kidney disease
To determine the clinical significance of the relationship between the TyGI and CAC progression, MACE was evaluated within each TyGI group using multivariable Cox analysis. Compared to the low TyGI group, the intermediate and high TyGI groups exhibited an increased risk of MACE (hazard ratio [HR], 1.50; 95% CI, 1.11–2.03; p = 0.009 and HR, 2.15; 95% CI, 1.59–2.91; p < 0.001) after adjusting for age, sex, BMI, smoking, alcohol consumption, hypertension, DM, SBP, eGFR, LDL-C, and HDL-C.
Subgroup analyses
To assess how different subgroups influence the relationship between the TyGI and CAC progression, patients were stratified by age, sex, BMI, eGFR, SPB, and DM (Fig. 3). These analyses revealed an interaction between age and TyGI (p for interaction = 0.02), between DM and TyGI (p for interaction = 0.003), and between eGFR and TyGI (p for interaction = 0.001). These findings suggest that the impact of the TyGI is influenced by age, kidney function, and DM.
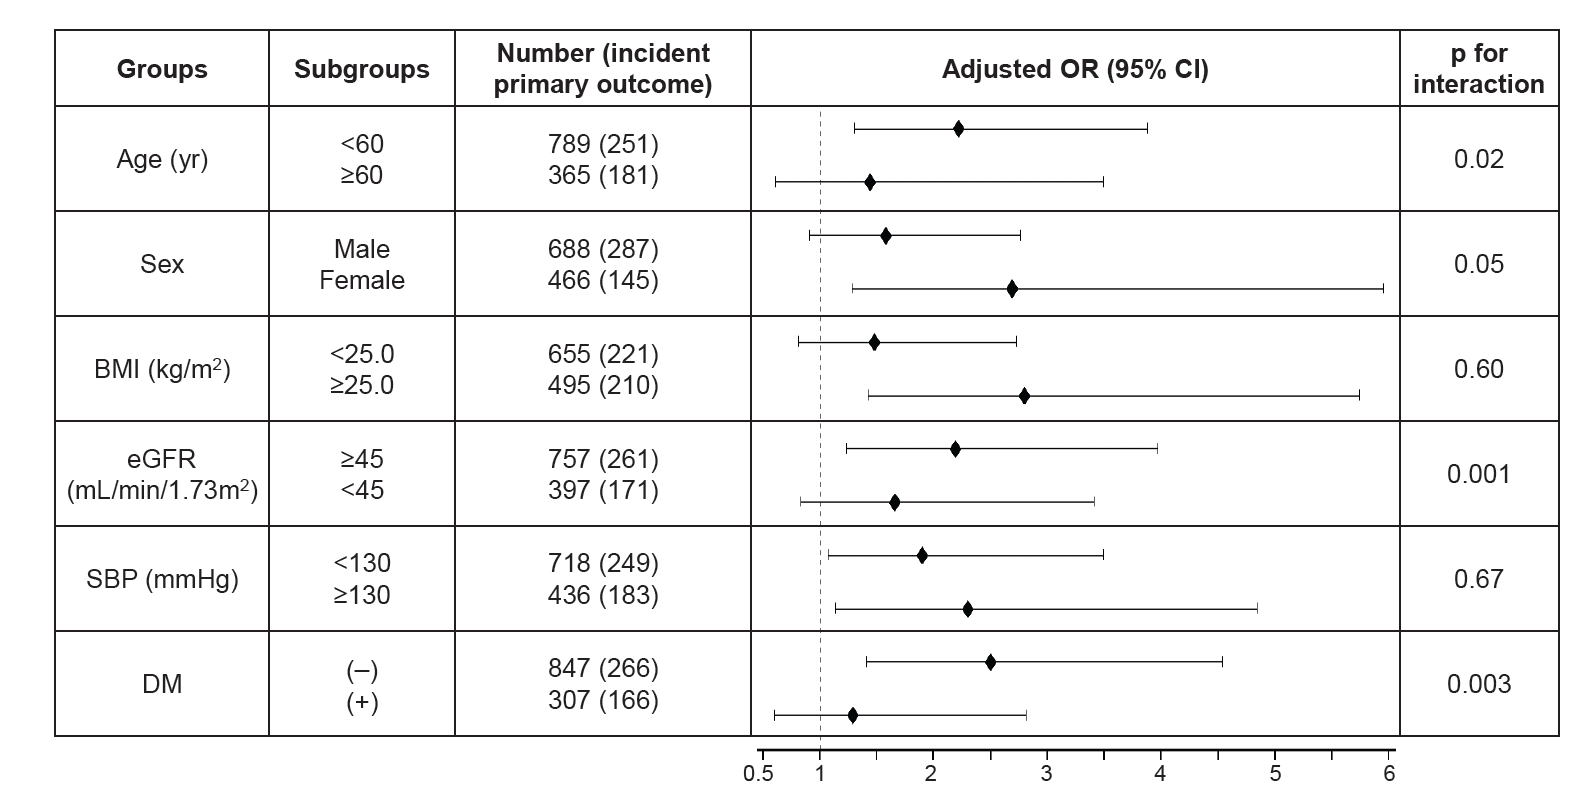
Forest plot for modification effects of subgroups on the relationship between triglyceride-glucose index and CAC progression.
BMI, body mass index; CAC, coronary artery calcification; CI, confidence interval; DM, Diabetes mellitus; e-GFR, estimated glomerular filtration rate; OR, odds ratio; SBP, systolic blood pressure.
Sensitivity analyses
To validate the findings in this study, sensitivity analyses were conducted using an alternative definition of CAC progression. This alternative definition involves the square-root transformation of the difference between baseline and follow-up CAC scores [√CAC score (follow-up) − √CAC score (baseline)], with a threshold set at greater than 2.5. This threshold was chosen to minimize the effect of interscan variability. Multivariable Cox analyses were carried out, adjusting for the same variables as previously described, and revealed that the highest tertile of the TyGI and a one-unit increase in TyGI were both associated with a significantly elevated risk of CAC progression (Table 4).

ORs for CAC progression with different definitions according to the TyGI
Discussion
As mentioned in other traditional studies, the baseline characteristic analysis showed a significant relationship between a high TyGI and well-known CVD risk factors including comorbidities [11–13,26–29]. In addition, in the current study, the baseline and follow-up CAC score and their changes increased in a stepwise manner according to the TyGI. Furthermore, the proportion of patients with CAC progression during follow-up was higher in the high TyGI group. This study also demonstrated an independent association between the TyGI and CAC progression in patients with CKD. This relationship was consistent even after adjusting for widely known CVD risk factors including eGFR. In the continued exploration of the clinical significance of the relationship between the TyGI and CAC progression, our investigation revealed that elevated TyGI levels were associated with increased risks of MACE when compared to CKD patients with lower TyGI levels.
There are several cross-sectional and population-based studies supporting the positive correlation between the TyGI and CAC progression [11–13]. The mechanism of association between a high TyGI and CAC progression is uncertain. While the TyGI is an important surrogate marker for insulin resistance, previous studies demonstrated that insulin resistance contributes to atherogenesis and progression of atherosclerosis by triggering macrophage apoptosis and endothelial and vascular smooth muscle cell damage [30–32]. Hyperinsulinemia can induce oxidative stress and interfere with the proper functioning of endothelial cells. Also, consequent reduction in nitric oxide availability may contribute to both functional and structural injury to blood vessels [33]. Moreover, hyperinsulinemia can trigger osteogenic differentiation and the formation of calcifications in vascular cells [34]. Furthermore, insulin resistance can accelerate the accumulation of advanced glycosylation end-products, thereby promoting the progression of CAC [35]. Atherosclerosis and valvular calcification commonly manifest in individuals with CKD [36]. Although it is challenging to determine the causal relationship from this observational cohort study, there have been studies suggesting that CAC progression may be related to the deterioration of kidney function [17,37]. A plausible explanation may be that the process, as described above, wherein a high TyGI may lead to CAC progression, could further contribute to the development of CKD. This could represent an ongoing process in patients with CKD. Further prospective studies are needed to elucidate the mechanism underlying this association in patients with CKD.
There is a lack of a clinical causal relationship between the TyGI and CAC since there are no data or clinical trials on improved obesity and coronary calcium score, proven TyGI-lowering medications, or improvement in CAC. Therefore, further studies are needed to determine the precise causal relationship between the TyGI and CAC progression.
There were several limitations in this study. First, this was an observational study; therefore, it was difficult to control for all possible confounding factors. Second, the study was limited to one ethnicity, and so the results cannot be generalized to other populations with different ethnicities. Despite these limitations, this study included a large population of patients with CKD and CAC measurements; and to our knowledge, it is the first to determine a correlation between CAC progression and a high TyGI in patients with CKD using longitudinal data, unlike other cross-sectional studies. Another notable aspect of this study is the simplicity of obtaining the TyGI through routine blood tests. This index could be valuable as an alternative indicator, not only for predicting the presence of CAC but also for doing so without radiation exposure.
In conclusion, this study showed an independent association of a high TyGI with CAC progression regardless of other CVD risk factors in patients with CKD. A high TyGI may be a useful predictor of CAC progression implying CVD risk and kidney outcomes in patients with CKD.
Notes
Additional information
The approval numbers of each Institutional Review Board are as follows: Seoul National University Hospital (No. 1810-132-982), Seoul National University Bundang Hospital (No. B-1901-514-409), Severance Hospital (No. 4-2019-0152), Kangbuk Samsung Hospital (No. 2019-04-011), The Catholic University of Korea, Seoul St. Mary’s Hospital (No. KC19OEDI0263), Gachon University Gil Medical Center (No. GAIRB2019-154), Nowon Eulji Medical Center, Eulji University (No. 201904-01), Chonnam National University Hospital (No. 2021-07-111), Inje University Pusan Paik Hospital (No. 2018-01-203), Hallym University Dongtan Sacred Heart Hospital (No. 2019-11-006), National Health Insurance Service Ilsan Hospital (No. 2019-12-008), Seoul National University Boramae Medical Center (No. 20-2019-76), Pusan National University Hospital (No. 1912-019-086), Chungnam National University Hospital (No. 2021-07-111).
Conflicts of interest
Tae-Hyun Yoo is the Editor-in-Chief of Kidney Research and Clinical Practice and was not involved in the review process of this article. All authors have no other potential conflicts of interest relevant to this article.
Funding
This work was supported by the Research Program funded by the Korea Disease Control and Prevention Agency (2011E3300300, 2012E3301100, 2013E3301600, 2013E3301601, 2013E3301602, 2016E3300200, 2016E3300201, 2016E3300202, 2019E320100, 2019E320101, 2019E320102, and 2022-11-007). The funding sources had no role in the design and conduct of the study, collection, management, analysis, and interpretation of the data; preparation, review, or approval of the manuscript; or decision to submit the manuscript for publication.
Data sharing statement
The data presented in this study are available on request from the corresponding author.
Authors’ contributions
Conceptualization, Investigation: YEK, THY
Methodology: YEK, HWK, JTP, SHH, SWK, THY
Data curation: HWK, THY
Formal analysis: YEK, HWK, JTP, SHH, SWK, THY
Supervision: THY, HWK, JTP, SHH, SWK, SS, KBL, JL, KHO
Writing–original draft: YEK, THY
Writing–review & editing: YEK, THY
All authors critically reviewed and approved the final manuscript.
Acknowledgements
The authors thank the clinical research coordinators of each participating institution and the Medical Research Collaborating Center, Seoul National University Hospital for the data management and data quality control. This is a group study by multi-center collaboration by the KNOW-CKD Investigator Group.