Loss of Cutibacterium is responsible for chronic kidney disease-associated pruritus in patients on dialysis
Article information

Abstract
Background
Chronic kidney disease (CKD)-associated pruritus is a severe distressing condition that frequently occurs in patients undergoing dialysis. In this study, the profile of the skin microbiome was analyzed to understand the underlying etiology and potential treatments.
Methods
Seventy-six end-stage kidney disease (ESKD) patients (hemodialysis, 40; peritoneal dialysis, 36) and 15 healthy controls were enrolled and swabbed at three sites: back, antecubital fossa, and shin. The pruritus severity of the enrolled subjects was validated by the Worst Itch Numeric Rating Scale (WI-NRS), 5-D itch scale, and Uremic Pruritus in Dialysis Patients (UP-Dial). The 16S gene-based metagenomics method was applied to skin microbiome analysis.
Results
In the comparison of bacterial communities of ESKD patients and the control group, there was a significant difference on back. Specifically, the average composition ratio of the Cutibacterium in the back samples was significantly lower in ESKD patients than in healthy controls (p < 0.01). In further analysis of ESKD patients, Cutibacterium was significantly lower in the high pruritus group than in the low pruritus group (p < 0.05), even though other clinical parameters such as age, calcium-phosphorus product, and intact parathyroid hormone showed no significance difference between the groups.
Conclusion
In ESKD patients, the skin microbiome of the back was significantly altered, and the severity of itching was related to the reduction of Cutibacterium. This research reveals the relationship between skin microbiota and CKD-associated pruritus in multiple skin sites for the first time. The results of this study suggest a potential data basis for the diagnosis and treatment of CKD-associated pruritus.
Introduction
Patients with end-stage kidney disease (ESKD) frequently experience chronic kidney disease (CKD)-associated pruritus, which causes detrimental effects on patients’ quality of life [1]. Previous studies have revealed that CKD-associated pruritus affects more than half of dialysis patients [2,3]. Factors such as skin dryness, divalent ions, calcium-phosphorus (Ca-P) product interleukin-31, and hyperparathyroidism, are known to be related to CKD-associated pruritus [4–7]. Despite numerous efforts to discern the cause of itching, the exact pathophysiology of CKD-associated pruritus has not currently been determined.
Skin microbiomes, consisting of numerous microorganisms on the skin that interact with the host, are known to be closely related to several diseases. For instance, Cutibacterium acnes, part of normal flora, plays a crucial role in maintaining skin homeostasis [8]. In addition, significant colonization of Staphylococcus aureus contributes to the severity and itch in atopic dermatitis [9,10]. Recently, the skin microbiome has been associated with pruritus in cirrhosis [11].
Therefore, the correlation between CKD-associated pruritus and skin microbiota can be hypothesized. However, there are few if any studies examining the link. The role of the skin microbiome in pruritus in ESKD patients undergoing dialysis, who among CKD patients, suffer from the most severe itching, has not been studied. Therefore, we determined the composition of the skin microbiome in ESKD patients undergoing hemodialysis (HD) or peritoneal dialysis (PD). We hypothesized that alterations in the skin microbiome would occur in the ESKD group compared to the non-ESKD group and that there would be a difference in the skin microbiota in those patients suffering from severe pruritus.
Methods
Study participants
The study protocol was approved by the Institutional Review Board at the Soonchunhyang University Cheonan Hospital (No. 2021-12-020). We recruited 91 participants (76 ESKD patients and 15 healthy controls) from February 1, 2022 to March 31, 2022, for the study. During the recruitment period, ESKD patients were undergoing dialysis treatment at Soonchunhyang University Cheonan Hospital. Of 76 patients, 40 were undergoing HD, and 36 were undergoing PD. Dialysis patients with skin diseases, such as atopic dermatitis or epidermolysis bullosa, were excluded from recruitment. This study was conducted after obtaining informed consent from all participants, and those who refused to participate were excluded from the experiment. The control group was recruited as those with estimated glomerular filtration rate (eGFR) above 90 mL/min/1.73 m2 [12]. It also consisted of people without CKD and other serious chronic illnesses (cirrhosis, diabetes, malignancy, etc.); people with other skin diseases were additionally excluded. The control group was recruited during the same period as ESKD patients.
Clinical data collection
Medical records of the patient group were used to determine the presence of chronic diseases (hypertension, diabetes) and the duration of dialysis. In addition, the levels of hemoglobin, albumin, blood urea nitrogen (BUN), creatinine, eGFR, potassium, phosphorus, and calcium were determined based on blood test results. In addition, the levels of intact parathyroid hormone were determined through endocrine test results. In the case of dialysis patients, Kt/V values were ascertained to find out dialysis adequacy. All results were based on the test results from 2 months before and after February 1, 2022.
Measurement of pruritus, skin dryness, scratch mark
Degree of itchiness was determined by surveying the patients. The questionnaire was prepared by combining three methods—Worst Itch Numeric Rating Scale (WI-NRS), 5-D itch scale, and Uremic Pruritus in Dialysis Patients (UP-Dial)—into one questionnaire. WI-NRS is an index indicating how itchy the patient is on a scale from 0 to 10, with 0 indicating no pruritus and 10 indicating very severe pruritus [13]. The 5-D itch scale measures the degree of itchiness in more detail. It can quantitatively evaluate itching multidimensionally and concisely through five aspects: degree, duration, direction, disability, and distribution [13,14]. The UP-Dial is also a multidimensional questionnaire similar to the 5-D itch scale but aimed more towards the measurement of quality of life and has three large domains: signs and symptoms (seven items), psychosocial (four items), and sleep (three items) [15]. In cases where there were overlapping questions between the 5-D itch scale and UP-Dial, the questions were merged into a single question. In addition, the medical staff directly checked the patient’s skin condition while taking the survey and measured the dryness of the skin, and scratch marks were evaluated on a scale of 1 to 4, with 1 signifying softness, and 4 signifying severe rough skin.
Sample collection
Three parts of the skin were selected for collection: the back, antecubital fossa, and shin. The criteria for choosing the three areas were as follows. Firstly, we tried to select a place where CKD patients often complain of itching in actual clinical practice. According to a previous study, the back appeared to be the area where itching was most frequently reported, followed by the legs and arms [16]. Secondly, as skin sites can be broadly divided into dry, sebaceous, and moist areas by anatomical differences, we collected skin microbiota on the shin, back, and antecubital fossa respectively [11,17]. Lastly, we determined three sites where the skin microbiota was relatively stable from frequent washing [18]. Samples were collected using the NBgene-SKIN (NBG-S22S) skin sampling Kit (Noble Bio). The participants were swabbed for a sufficient time using fresh sterile gloves, and after collection, the samples were immediately labeled and stored at –80 ºC. They were then transported under dry ice to the Probiotics Microbiome Convergence Center of Soonchunhyang University (Asan, Korea), where DNA extraction was performed.
DNA extraction and 16S sequencing
DNA extraction was done by adding 1 mL of skin swab solution to FastPrep-24 5G (MP Biomedicals). Polymerase chain reaction (PCR) amplification reactions were prepared by adding 16S rRNA V4 region primers, KAPA HiFi HotStart ReadyMix enzyme (Roche), and PCR grade water (Invitrogen) in bacterial DNA extract. Then PCR was performed according to methods in the Nextra XT DNA Library Prep Kit (Illumina). The indexed PCR samples were purified with AMPure beads (Beckman Coulter). After this, every sample was pooled, and 30% PhiX (Illumina) was added to the pooled library. The libraries were sequenced using an iSeq100 platform (Illumina). Of 273 samples, sequencing for two of the samples from shin regions failed, and as a result, they were excluded from the microbiota analysis.
Bioinformatics and statistical analysis
IBM SPSS version 25 (IBM Corp.) was used for statistical analysis, and QIIME2 2021.11 software was used for microbiome analysis. The Student t test was used in the comparison of continuous variables in baseline characteristics between the control group and the ESKD group, and also between the low pruritus group and the high pruritus group. The chi-square test or Fisher exact test was used to compare dichotomous variables also. The comparison of taxonomic compositions was assessed using the Wilcoxon rank-sum test.
In our study, we analyzed the results using commonly used bioinformatic methods in microbiome research, including alpha diversity, beta diversity, and linear discriminant analysis effect size (LEfSe) [19]. Alpha diversity is a measure of diversity within individual samples, including Chao1 index and Simpson index, which represent species richness and species diversity, respectively. Wilcoxon rank-sum test was used to test the significance. Beta diversity, on the other hand, is a measurement of dissimilarity between different groups of samples. It involves comparing the communities of different samples by representing them as points on a coordinate system by calculating principal coordinate analysis (PCoA). Several metrics can be used to quantify beta diversity, including Bray-Curtis, Jensen-Shannon, generalized UniFrac, and UniFrac distances. Permutational multivariate analysis of variance (PERMANOVA) was used to test the significance. LEfSe is a widely used method for identifying biomarkers that can differentiate between two groups of samples in microbiome research. LEfSe uses linear discriminant analysis (LDA), calculating effect sizes and comparing the difference between two groups. The significance was found using the Kruskal-Wallis H tests.
When dividing the group of patients with ESKD based on the severity of pruritus for additional analysis, we classified the low pruritus group and the high pruritus group based on the WI-NRS as none to mild pruritus (range, 0–3), and moderate to very severe pruritus (range, 4–10), respectively [20,21].
Results
Baseline characteristics
The characteristics of patients are presented in Table 1. As expected, eGFR, albumin, and hemoglobin levels were significantly lower in the ESKD group, and BUN and creatinine levels were significantly higher in the ESKD group compared to the control group (p < 0.001). Potassium levels were significantly higher in the ESKD group than in the control group (p < 0.05), and phosphorus levels were also significantly higher in the ESKD group (p < 0.01). In the case of calcium levels, the control group was higher than the ESKD group but not significantly (p > 0.05). However, there was a significant difference in Ca-P product (Ca × P) between the two groups (p < 0.05). In the WI-NRS and total 5-D itch scale score, which represents the degree of itchiness for different perspectives, the ESKD group was significantly higher than the control group (p < 0.001). Likewise, the UP-Dial score was significantly higher in the ESKD group (p < 0.01). In addition, when comparing the degree of xerosis, the ESKD was significantly higher than that of the control group (p < 0.001), and the same was true when comparing the degree of scratch marks (p < 0.01).

Baseline characteristics of study subjects
The distribution domain in the 5-D itch scale survey, which included 16 areas of the body, asked about the location of itch where study participants are suffering. In ESKD patients, back appeared to be the most severe itching site among all areas. About 59.2% of patients complained of itching in their backs, followed by legs (28.9%), head (22.4%), thighs (22.4%), upper arms (19.7%), and lower arms (17.1%).
The skin microbiota of end-stage kidney disease patients is different from that of healthy control in the back
Comparing the bacterial composition between control and ESKD patients using PCoA based on Jensen-Shannon, Bray-Curtis, generalized UniFrac, and UniFrac metrics, the back exhibited distinct bacterial communities between the two groups (p < 0.05) (Table 2, Fig. 1A). However, there was no significant difference between the two groups in the antecubital fossa and shin (p > 0.05) (Table 2; Supplementary Fig. 1, available online). Comparing the alpha diversity index through Wilcoxon rank analysis, the Simpson index was significantly decreased in the ESKD group in the back, in contrast to Chao1, which didn’t show a significant difference (Fig. 1B). In antecubital fossa and shin, none of the indexes showed a significant difference between the two groups (Fig. 1C, D).

Beta diversity index between normal subjects and ESKD patients in three skin regions
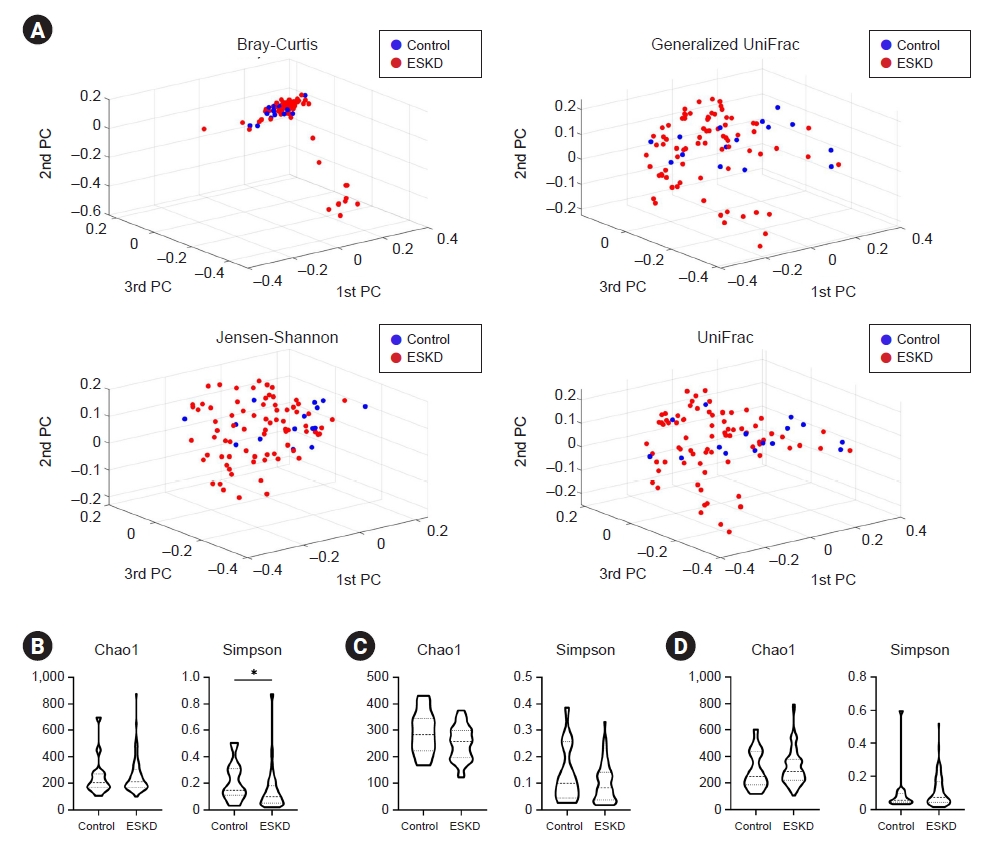
Bacterial community and diversity comparison in control and ESKD groups.
(A) Beta diversity showed different microbial compositions between the control group and the ESKD group in the back region. Permutational multivariate analysis of variance was performed for statistical comparisons of samples in the two groups. Beta diversity analysis was performed using Bray-Curtis, Jensen-Shannon, generalized UniFrac, and UniFrac metrics. Bacterial richness and diversity measured by Chao1 and Simpson were calculated at the microbial amplicon sequence variant level at (B) back, (C) antecubital fossa, and (D) shin. Wilcoxon rank-sum test was performed (*p < 0.05).
ESKD, end-stage kidney disease; PC, ~.
Bacterial comparisons at the phylum, class, order, family, and genus level in each area are shown in Fig. 2 and Supplementary Fig. 2, 3 (available online). This analysis showed that actinobacteria, Bacteroidetes, Firmicutes, and Proteobacteria are the main bacterial phyla composing the skin microbiota in all three areas (Fig. 2A; Supplementary Fig. 2A, 3A, available online). In the back region, Actinobacteria significantly decreased, and Bacteroidetes had significantly increased in ESKD patients compared with controls (Fig. 2A). Antecubital fossa and shin did not exhibit any significant difference (Supplementary Fig. 2A, 3A, available online).

Comparison of taxonomic compositions between the control group and the ESKD group (back).
Averaged taxonomic compositions of the control and ESKD patient groups in the back. Taxonomic relative abundance was classified at the (A) phylum, (B) class, (C) order, (D) family, and (E) genus levels, and relative abundances of less than 1% were expressed as ‘Others.’ The Wilcoxon signed-rank test was used to analyze the significance between the two (*p < 0.05, **p < 0.01). The y-axis of the graphs represents the taxonomic relative abundance. (F) Taxonomic relative abundance of back is presented only for those with significant differences according to the Wilcoxon signed-rank test with a composition ratio of more than 1% (*p < 0.05, **p < 0.01).
ESKD, end-stage kidney disease.
For further analysis of back, Actinobacteria_c class showed a significant difference between the control group and the ESKD group (p < 0.05) (Fig. 2B, F). Specifically, the Micrococcus genus was significantly increased in ESKD patients compared to the control group (p < 0.05) (Fig. 2E, F). On the other hand, the Cutibacterium genus, also one of the Actinobacteria_c class was significantly decreased (p < 0.01) (Fig. 2E, F). Meanwhile, the Comamonas genus, involved in the Burkholderiales order, was significantly increased in ESKD compared to the control (p < 0.05) (Fig. 2E, F). The same result was also found in the antecubital fossa and the shin (p < 0.05) (Supplementary Fig. 2E, 3E; available online).
Cutibacterium was decreased with high pruritus in end-stage kidney disease patients
We split the ESKD patients into two groups, based on WI-NRS. Patients with WI-NRS 0 to 3 were defined as the low pruritus group, and WI-NRS 4 to 10 were defined as the high pruritus group. The baseline characteristics of these two groups are shown in Table 3. As expected, WI-NRS, total 5-D itch scale score, and UP-Dial score were significantly higher in the high pruritus group than in the low pruritus group (p < 0.001). Likewise, xerosis was significantly higher in the high pruritus group (p < 0.05), and the scratch mark score was also significantly higher (p < 0.001). Also, the duration of dialysis was significantly lower in the high pruritus group than in the low pruritus group, and the percentage of patients undergoing hemodialysis was significantly lower in the high pruritus group than in the low pruritus group (p < 0.05). Other parameters such as age, sex, eGFR, BUN, creatinine, albumin, hemoglobin, potassium, phosphorus, calcium, Ca-P product, Kt/V, intact parathyroid hormone, and percentage having hypertension or diabetes did not show any significant difference (p > 0.05).

Baseline characteristics of study subjects with ESKD (itch severity)
The bacterial composition between the two groups was compared in the back. Comparing using PCoA based on Jensen-Shannon, Bray-Curtis, generalized UniFrac, and UniFrac metrics, a significant difference was not shown between the two groups (Supplementary Fig. 4A, available online). Also, no significant results were found in Chao1, and Simpson, comparing the alpha diversity index through Wilcoxon rank analysis (Supplementary Fig. 4B, available online).
The results of comparing bacteria at the levels of order, family, and genus between the low pruritus group and the high pruritus group in the back are shown in Fig. 3. Only bacteria with a relative abundance of ≥1‰ are included in the comparison. Propionibacteriales order-Propionibacteriaceae family-Cutibacterium genus lineage showed significantly lower abundance in the high pruritus group compared to the low pruritus group, whereas Enterobacteriaceae family-Escherichia genus lineage and Intrasporangiaceae family-Janibacter genus lineage were significantly increased (Fig. 3A).
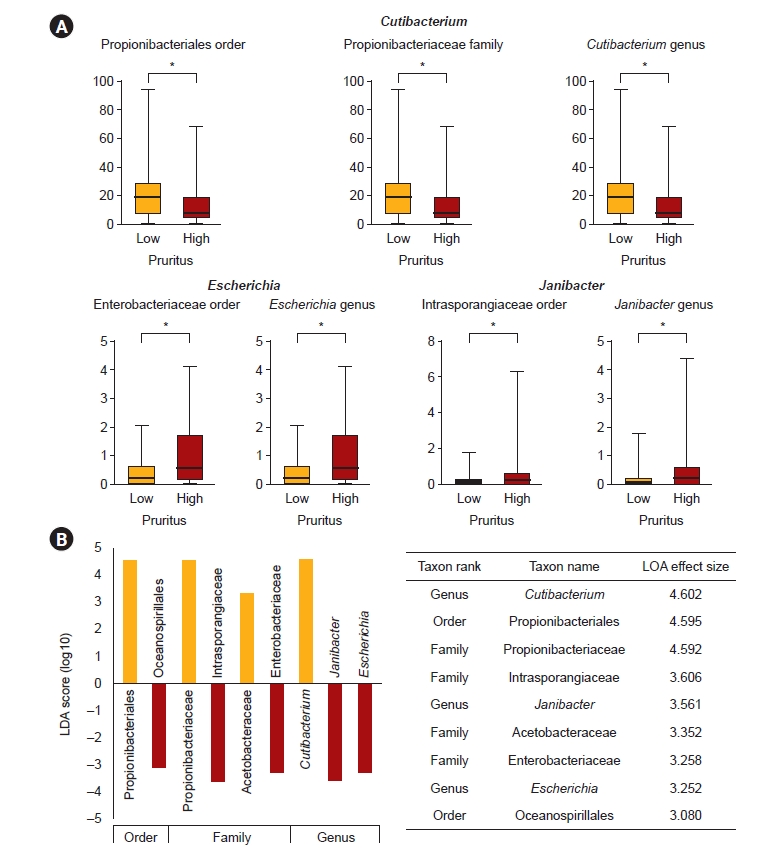
Individual bacterial comparison in the groups of low pruritus and high pruritus (back).
(A) Bacterial order, family, and genus were differentially abundant between the low pruritus group and the high pruritus group in the end-stage kidney disease (ESKD) patients. Only genera above 1‰ are displayed. The p-value was calculated using the Wilcoxon rank-sum test (*p < 0.05, ‰). The y-axis of the graphs represents the taxonomic relative abundance. (B) Result of the linear discriminant analysis (LDA) effect size analysis for finding potential taxonomic biomarkers of the low pruritus group and the high pruritus group in the ESKD patients. Taxonomic cladograms are only presented for taxa with a significant Kruskal-Wallis test result (p < 0.05) and an LDA score of greater than 3. Red indicates greater abundance in the high pruritus group compared to the low pruritus group, and green denotes the opposite.
LEfSe analysis was performed with the aim of finding potential taxonomic biomarkers between the low pruritus group and the high pruritus group, and the Kruskal-Wallis H test was done. Only taxa with an LDA score of 3 or higher, showing significant differences in the Kruskal-Wallis H test, were considered as potential biomarkers and are presented. In the comparison between the two groups, the reduction of Propionibacteriales order-Propionibacteriaceae family-Cutibacterium genus lineage was identified as the main potential biomarker in the high pruritus group. Also, the increase in Intrasporangiaceae family-Janibacter genus lineage, and Enterobacteriaceae family-Escherichia genus lineage was regarded as a potential biomarker indicating high pruritus (Fig. 3B).
To find a correlation between itch severity and relative bacterial abundance at the genus level, the Pearson correlation coefficient was performed. As a result, the Escherichia genus appeared to have a positive correlation on both the WI-NRS and 5-D itch scale. The Cutibacterium genus and the Janibacter genus did not show significant results (Fig. 4A, B).

Correlation test between abundance of bacterial genus and the itch severity.
(A) Escherichia showed a significant positive correlation with Worst Itch Numeric Rating Scale (WI-NRS) and 5-D itch scale, but Cutibacterium and Janibacter did not. The y-axis of the graphs represents the taxonomic relative abundance. (B) Pearson correlation coefficient was performed.
Discussion
While comparing the bacterial community with beta diversity between the control group and ESKD group for each part, only the back showed a significant difference in our experiment, in contrast to the antecubital fossa and the shin with no significant result. This is consistent with the results of our patients' survey, questioning the area of itching on the body. Previous studies have also concluded that the back is the itchiest site [16,22]. Therefore, it can be inferred that there is an association between CKD-associated pruritus and skin microbiota, since itching is particularly severe on the back compared to other areas, and significant results were found in the analysis of skin microbiota.
Significant differences were found in alpha diversity as well as beta diversity in the back. In the case of the Chao1 index, which indicates bacterial species richness, it did not show a significant difference. On the other hand, the Simpson index, indicating the species diversity, showed a significant difference between the control group and the ESKD group. There was an increase in species diversity in the ESKD group compared to the normal control group. In addition, as the total number of species did not differ between the control group and the ESKD group, there may be the possibility that certain bacteria with greater virulence are increased in the ESKD group. These results thus indicate that skin microbiome may influence itching, especially in the back.
Meanwhile, Comamonas showed a significant increase in the ESKD group compared to the control group and in all three areas. Although this genus can be found in diverse environments such as soil, water, and human skin, cases reporting pathogenic effects on the human body are rare. These results imply that there is a skin condition where Comamonas can colonize easily in patients with ESKD, but further study is needed.
We performed additional analyses in the back, the itchiest area, and the area showing a significant difference in bacterial diversity between the control group and the ESKD group. In the comparison between the low pruritus group and the high pruritus group, as expected, it was found that the 5-D itch scale and UP-Dial, other pruritus scales used in this study, had significant differences between the two groups in itch severity. Meanwhile, in the comparison between the two groups, the dialysis duration was found to be significantly shorter in the high pruritus group. This result is consistent with the previous study that the prevalence of CKD-associated pruritus is higher in people with shorter dialysis duration [3].
There was also a significant difference between the two groups in the xerosis and the scratch mark measured by medical staff. This suggests that xerosis may also affect CKD-associated pruritus. Moreover, scratch marks may be the indicator of itch severity, and there is a possibility that scratching itself may lead to alterations in the skin microbiota. In our study, there was a significant difference in hemodialysis and PD percentages between the two groups. It seems that patients with severe itch were more recruited in PD than in hemodialysis since the prevalence of itching can be widely varied.
Comparing the skin microbiota of the back in two groups, beta diversity, and alpha diversity did not show a significant difference between the low pruritus group and the high pruritus group. Since they are still in the same ESKD group, it is concluded that the microbial communities did not exhibit notable differences.
Importantly, in the analysis of individual genus level, Cutibacterium in the ESKD group decreased significantly compared to the control group, and notably, was significantly decreased in the high pruritus group compared to the low pruritus group on back. As well, based on LEfSe analysis, loss of Cutibacterium was revealed to be a primary potential biomarker indicating high pruritus. Cutibacterium, one of the facultative anaerobes that commonly colonizes in human skin, is a lipophilic organism that is rich in sebaceous glands, such as face, chest, and back. The back is dominantly colonized by Cutibacterium, along with some of the Betaproteobacteria and Flavobacteriales [17]. Cutibacterium plays an important role in maintaining the health of the skin, producing various substances that help protect the skin from harmful bacteria, fungi, and viruses. Among them are short-chain fatty acids (SCFAs), such as propionic acid which helps to lower the pH of the skin, creating an environment that is unfavorable for harmful microorganisms such as S. aureus [23].
In a previous study, it was revealed that C. acnes solubilized Ca-P and relieved CKD-associated pruritus, by producing SCFAs. Furthermore, the study found that the Cutibacterium genus has a relatively low abundance of itchy skin in patients with CKD [24]. Our study supports the above findings. Thus, it can be concluded that the reductions in the abundance of Cutibacterium are related to CKD-associated pruritus.
The finding that loss of Cutibacterium has a significant effect on pruritus suggests therapeutic strategies. In atopic dermatitis, where a relatively large number of studies related to the skin microbiome have been conducted, there are earlier studies that claim a correlation between disease severity and the abundance of S. aureus. In addition, it is known that the number of S. aureus is higher when disease flare was present, compared to that at baseline or in the posttreatment state [25]. Accordingly, a topical agent called Staphefekt, a bacteriophage lysin specific to S. aureus, is currently being researched [26,27]. In the same way, treatments that increase the abundance of Cutibacterium may create a way to alleviate CKD-associated pruritus.
Meanwhile, another study claimed that Escherichia-Shigella could be used as a biomarker indicating CKD. Also, the study claimed that Escherichia-Shigella was correlated with itch severity [12]. In our study, there was no significant difference in the quantity of Escherichia between the control group and the ESKD group in the back. Instead, an increase in Escherichia was regarded as a potential biomarker showing high pruritus in the back, according to LEfSe analysis. Also, the quantity of Escherichia and WI-NRS were found to have a significant positive correlation according to the Pearson correlation coefficient, which supports the previous finding. The relationship between the 5-D itch scale and Escherichia also showed a similar result. This suggests that an increase in Escherichia has a close association with itch severity in ESKD patients.
There are some limitations in this study. Since this experiment collected microorganisms in the skin, the result of experiment may be influenced by the external environment. We selected three areas with relatively little contact with external substances to minimize this range of fluctuation, but even so, this variable can be completely excluded. Additionally, although the difference in the average age wasn’t wide between the control group and the ESKD group, the p-value showed a significant difference. This result occurred even after excluding some elderly people who did not meet the criteria for eGFR in the control group. Therefore, the effect of age could not be completely ruled out, despite it is unlikely to be a decisive factor changing the result since the difference in average is not large. Lastly, the control group was not large since it was difficult to recruit healthy controls, especially among the elderly.
Nevertheless, this study is meaningful in that it is the first research worldwide to reveal the relationship between skin microbiota and CKD-associated pruritus in several skin sites, in ESKD patients. It is also the first to explain why the back is the itchiest area in ESKD patients, from the perspective of the skin microbiota. In addition, this research was able to identify a specific genus that significantly affects CKD-associated pruritus. These findings may be useful in developing prebiotic or probiotic therapies aimed at relieving CKD-associated pruritus.
Notes
Conflicts of interest
All authors have no conflicts of interest to declare.
Funding
This study was supported by a National Research Foundation (NRF) of Korea grant funded by the Korea Government (Ministry of Science and ICT) (2020R1A2C2003438). It was also supported by Soonchunhyang University Research Fund.
Data sharing statement
The data presented in this study are available on request from the corresponding author.
Authors’ contributions
Conceptualization: JGL, EYL
Data curation: JGL, SSS, HSJ, KML, NJC, SP, HWG, EYL
Formal analysis, Visualization: JGL, HS, SSS, SK
Funding acquisition: EYL
Investigation: JGL, KML, EYL
Methodology: JGL, HS, KML, HAP, EYL
Supervision: HS, NJC, SP, HWG, EYL
Writing–original draft: JGL
Writing–review & editing: All authors
All authors read and approved the final manuscript.
Supplementary Materials
Supplementary data are available at Kidney Research and Clinical Practice online (https://doi.org/10.23876/j.krcp.23.057).