Kidney biopsy can help to predict renal outcomes of patients with type 2 diabetes mellitus
Article information

Abstract
Background
In patients with type 2 diabetes mellitus (T2DM), diabetic kidney disease (DKD) is diagnosed based on clinical features. A kidney biopsy is used only in selected cases. This study aimed to reconsider the role of a biopsy in predicting renal outcomes.
Method
Clinical and laboratory parameters and renal biopsy results were obtained from 237 patients with T2DM who underwent renal biopsies at Soonchunhyang University Cheonan Hospital between January 2000 and March 2020 and were analyzed.
Results
Of 237 diabetic patients, 29.1% had DKD only, 61.6% had non-DKD (NDKD), and 9.3% had DKD with coexisting NDKD (DKD/NDKD). Of the patients with DKD alone, 43.5% progressed to end-stage kidney disease (ESKD), while 15.8% of NDKD patients and 36.4% of DKD/NDKD patients progressed to ESKD (p < 0.001). In the DKD-alone group, pathologic features like ≥50% global sclerosis (p < 0.001), tubular atrophy (p < 0.001), interstitial fibrosis (p < 0.001), interstitial inflammation (p < 0.001), and the presence of hyalinosis (p = 0.03) were related to worse renal outcomes. The Cox regression model showed a higher risk of progression to ESKD in the DKD/NDKD group compared to the DKD-alone group (hazard ratio [HR], 2.73; p = 0.032), ≥50% global sclerosis (HR, 3.88; p < 0.001), and the degree of mesangial expansion (moderate: HR, 2.45; p = 0.045 and severe: HR, 6.22; p < 0.001).
Conclusion
In patients with T2DM, a kidney biopsy can help in identifying patients with NDKD for appropriate treatment, and it has predictive value.
Introduction
Diabetes mellitus (DM) affects multiple organs and can cause death, making it a major threat to global public health. The number of adults with DM worldwide increased from 108 million in 1980 to 422 million in 2014 [1]. It is also a major problem in South Korea, where the prevalence of DM in adults was 13.8% in 2018 [2]. Diabetic kidney disease (DKD) is the most common cause of chronic kidney disease (CKD) and end-stage kidney disease (ESKD) [3]. Because CKD is associated with a high risk of cardiovascular disease, early detection and intervention are necessary [4].
Although a kidney biopsy is needed for a definitive diagnosis, it is not routinely performed because of its invasiveness and potential hazards. In most cases, DKD is diagnosed in patients with type 2 DM (T2DM) based on urinary albumin excretion, diabetes duration, coexisting diabetic retinopathy, and other clinical features. Some studies claimed that a clinical diagnosis is sufficient, and a kidney biopsy is not necessary in most cases [5–7]. A kidney biopsy is performed in selected cases with atypical features, such as hematuria, a rapid decline in renal function, or nonexistent diabetic retinopathy. However, recent studies showed that the characteristics of DKD are changing substantially. The prevalence of proteinuria is decreasing, whereas the prevalence of reduced renal function without proteinuria is increasing [8–11]. Furthermore, a significant proportion of patients with DM have non-DKD (NDKD). Previous studies showed that the prevalence of NDKD ranged from 3% to 83% among patients undergoing renal biopsies [12–23]. The prognosis of patients with DKD tends to be worse than those with NDKD, and appropriate treatment is different for each disease. Thus, it is becoming more important for clinicians to identify and distinguish between DKD and NDKD in patients with DM. In this study, we explored the role of kidney biopsies in predicting kidney outcomes in patients with T2DM.
Methods
Ethics statement
This study was carried out in accordance with the Declaration of Helsinki, and the study protocol was approved by the Institutional Review Board of Soonchunhyang University Cheonan Hospital in Cheonan, Republic of Korea (No. 2019-04-026). The requirement for informed consent was waived due to the retrospective nature of the study.
Study population
A total of 1,878 renal biopsies were performed at Soonchunhyang University Cheonan Hospital between January 2000 and March 2020. Patients younger than 18 years (n = 110) were excluded. We reviewed the medical records and classified patients as having T2DM if they had self-reported, were taking diabetic medications, or their result of blood hemoglobin A1c was at least 6.5%. A total of 237 patients were identified as having T2DM. We reviewed the clinical and laboratory parameters and renal biopsy results and analyzed them retrospectively.
Biopsy specimens and clinical characteristics
All biopsy specimens were processed and analyzed by light microscopy, immunofluorescence microscopy, and electron microscopy. All specimens were reviewed by expert pathologists. The patients’ clinical and laboratory data were collected by reviewing the electronic medical records. The clinical characteristics included age, sex, body mass index (BMI), mean arterial pressure (MAP), hemoglobin, serum albumin, blood urea nitrogen (BUN), serum creatinine, estimated glomerular filtration rate (eGFR) calculated by the CKD-EPI (Chronic Kidney Disease Epidemiology Collaboration) equation, and 24-hour urinary protein value. We considered the patient to have hypertension if they were taking antihypertensive medications or if it was self-reported. Laboratory data were collected at the time of the renal biopsy.
Follow-up and renal outcomes
Patients diagnosed with isolated DKD received conventional management without immunosuppressive agents. Patients with NDKD superimposed on DKD or isolated NDKD were treated according to the KDIGO (Kidney Disease Improving Global Outcomes) practical guidelines [24]. We collected the date when the patients visited the clinic, and the date they progressed to ESKD or died. ESKD was defined as the need for renal replacement therapy for more than 3 months.
Statistical analyses
Continuous variables are expressed as the mean ± standard deviation. Categorical variables are presented as numbers (percentages). An independent t test or one-way analysis of variance was used to compare continuous variables between the groups, and the chi-square test or Fisher exact test was used for categorical variables. Kaplan-Meier curves were drawn, and a log-rank test was used to compare the renal survival distribution. Point biserial correlation was used to identify correlations between continuous and dichotomous variables. The Cox regression model was used to identify the association between the renal survival time and variables. A p-value of <0.05 was considered statistically significant. All statistical analyses were performed using SPSS version 25.0 for Windows (IBM Corp.).
Results
A total of 1,768 patients who were at least 18 years old underwent kidney biopsies between January 2000 and March 2020. The baseline characteristics of patients with T2DM (n = 1,531) and those without (n = 237) were compared and are shown in Table 1. The most common diagnosis in patients without T2DM was immunoglobulin A nephropathy (IgAN) (n = 666, 43.5%), followed by focal segmental glomerulosclerosis (FSGS; n = 110, 7.2%), membranous nephropathy (MN; n = 95, 6.2%), minimal change disease (MCD; n = 80, 5.2%), lupus nephritis (n = 42, 2.7%), membranoproliferative glomerulonephritis (MPGN; n = 38, 2.5%), tubulointerstitial nephritis (TIN; n = 25, 1.6%), and acute tubular necrosis (n = 20, 1.3%).

Clinical characteristics of the study population
Among 237 diabetic patients, 69 patients (29.1%) had DKD only, 146 (61.6%) had NDKD, and 22 (9.3%) had DKD with coexisting NDKD (DKD/NDKD) (Table 2). We divided the patients into three groups based on their pathologic diagnosis. Age and sex were not different between the groups. Patients in the DKD-alone group tend to have lower hemoglobin levels (10.8 ± 1.9 g/dL vs. 12.0 ± 2.3 g/dL; p < 0.001), higher BUN levels (29.7 ± 13.1 mg/dL vs. 24.6 ± 15.9 mg/dL; p = 0.02), and lower eGFRs (42.7 ± 24.1 mL/min/1.73 m2 vs. 52.9 ± 29.3 mL/min/1.73 m2; p = 0.008) than the NDKD group. Serum albumin levels and 24-hour urinary protein values were not different between the three groups.

Clinical characteristics of patients with type 2 diabetes mellitus (n = 237)
The mean follow-up duration in the DKD-only, NDKD, and DKD/NDKD groups was 2.8 years (range, 2.0–5.7 years), 5.8 years (range, 2.4–9.7 years), and 4.3 years (range, 2.7–5.7 years), respectively. Of the patients with DKD alone, 43.5% progressed to ESKD, while 36.4% of the patients in the DKD/NDKD group and 15.8% of the patients in the NDKD group progressed to ESKD (p < 0.001). We drew Kaplan-Meier curves to visualize the difference in renal outcomes in each group (Fig. 1). We performed the log-rank test, and the p-value was <0.001, indicating differences in renal outcomes in each group. The correlation between progression to ESKD and eGFR and 24-hour urinary protein value was analyzed in each group. eGFR was not correlated in the DKD-only (–0.143, p = 0.03), NDKD (0.181, p = 0.005), or DKD/NDKD groups (–0.070, p = 0.23). Twenty-four-hour urinary protein values also did not correlate in the DKD-only (0.088, p = 0.18), NDKD (–0.142, p = 0.03), or DKD/NDKD groups (0.097, p = 0.14) (Table 3).
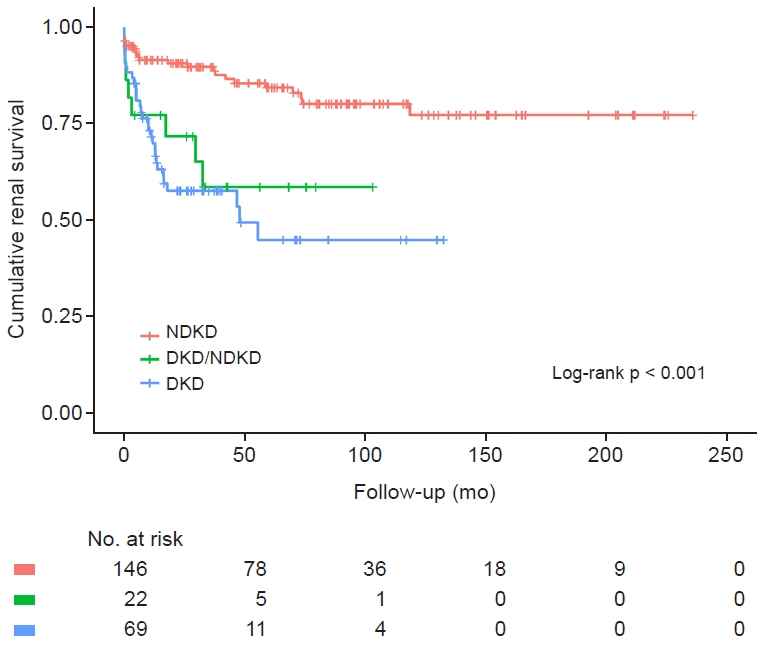
Cumulative renal survival between the groups.
Differences in cumulative renal survival between the groups are shown by Kaplan-Meier curves (n = 146 in the NDKD group, n = 69 in the DKD-alone group, and n = 22 in the DKD/NDKD group). Each group was compared by the log-rank test and the p-value was < 0.001.
DKD, diabetic kidney disease; NDKD, non-diabetic kidney disease.

Correlation with laboratory parameters in DKD, NDKD, DKD/NDKD groups
The most common diagnosis in the NDKD group was IgAN (n = 50, 34.2%), followed by FSGS (n = 25, 17.1%), MN (n = 21, 14.4%), TIN (n = 11, 7.5%), MCD (n = 10, 6.8%), crescentic glomerulonephritis (GN; n = 8, 5.5%), lupus nephritis (n = 6, 4.1%), and MPGN (n = 5, 3.4%). The most frequent co-diagnosis in the DKD/NDKD group was MCD (n = 7, 31.8%), followed by TIN (n = 5, 22.7%), IgAN (n = 4, 18.2%), MN (n = 4, 18.2%), FSGS (n = 1, 4.5%), and crescentic GN (n = 1, 4.5%). Kaplan-Meier curves showed better prognoses for patients with MCD and MN and worse prognoses for those with crescentic GN and MPGN. The prognoses of patients in the DKD-only group were bad like those of crescentic GN and MPGN patients (Fig. 2).
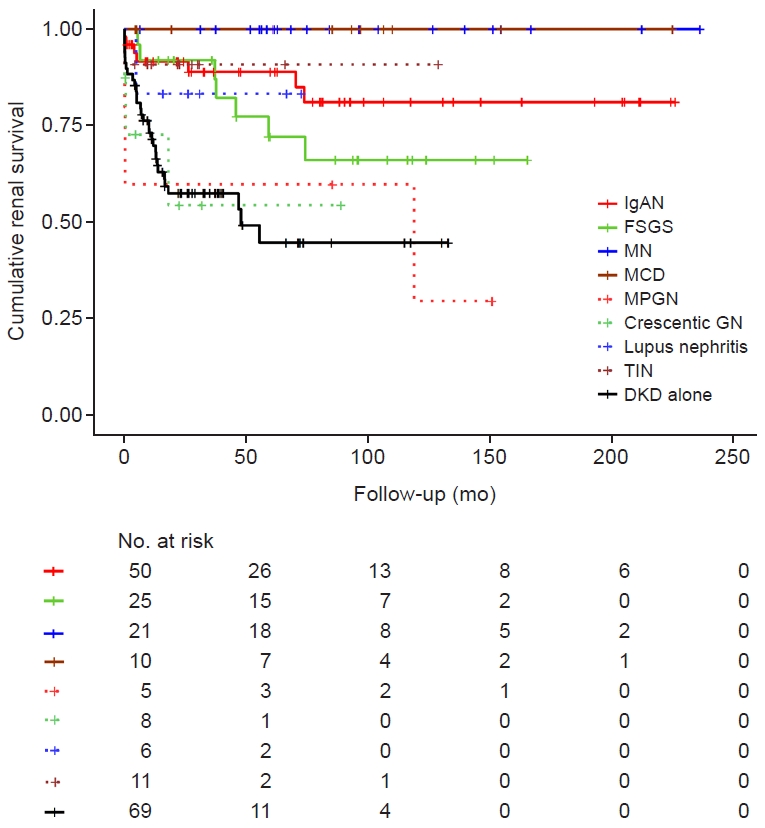
Cumulative renal survival in the NDKD group compared to the DKD-alone group.
Differences in cumulative renal survival grouped by diagnosis are shown by Kaplan-Meier curves. DKD alone was the most common diagnosis, with 69 cases. In the NDKD group, the most common diagnosis was immunoglobulin A nephropathy (IgAN; n = 50, 34.2%), followed by focal segmental glomerulosclerosis (FSGS; n = 25, 17.1%), membranous nephropathy (MN; n = 21, 14.4%), tubulointerstitial nephritis (TIN; n = 11, 7.5%), minimal change disease (MCD; n = 10, 6.8%), crescentic glomerulonephritis (crescentic GN; n = 8, 5.5%), lupus nephritis (6, 4.1%), and membranoproliferative GN (MPGN; n = 5, 3.4%). In the observation period, no patient with MCD or MN progressed to end-stage kidney disease, showing the best result. In contrast, patients with crescentic GN and MPGN showed worse prognoses.
DKD, diabetic kidney disease; NDKD, non-diabetic kidney disease.
We analyzed the pathologic features in the DKD-alone group to find associations with renal prognoses (Fig. 3). If glomeruli showed ≥50% global sclerosis, the renal outcome looked worse (p < 0.001). The severity of mesangial expansion also tended to be related to renal outcomes but failed to show statistical significance in the log-rank test (p = 0.06). The severity of tubular atrophy (p < 0.001), interstitial fibrosis (p < 0.001), and interstitial inflammation (p < 0.001) were also correlated with renal prognoses. The presence of hyalinosis resulted in worse renal outcomes (p = 0.03). The correlation between progression to ESKD and laboratory parameters, such as eGFR and 24-hour urinary protein, was analyzed in each pathologic finding. The result showed eGFR was correlated with pathologic findings, including global sclerosis (–0.495, p < 0.001), mesangial expansion (–0.210, p = 0.07), tubular atrophy (–0.557, p < 0.001), interstitial fibrosis (–0.376, p = 0.001), interstitial inflammation (–0.325, p = 0.007), and hyalinosis (–0.377, p = 0.001). However, 24-hour urinary protein values were not correlated with pathologic findings, including global sclerosis (–0.020, p = 0.857), mesangial expansion (0.040, p = 0.74), tubular atrophy (0.019, p = 0.87), interstitial fibrosis (0.110, p = 0.37), interstitial inflammation (0.051, p = 0.67), and hyalinosis (0.088, p = 0.47) (Table 4).
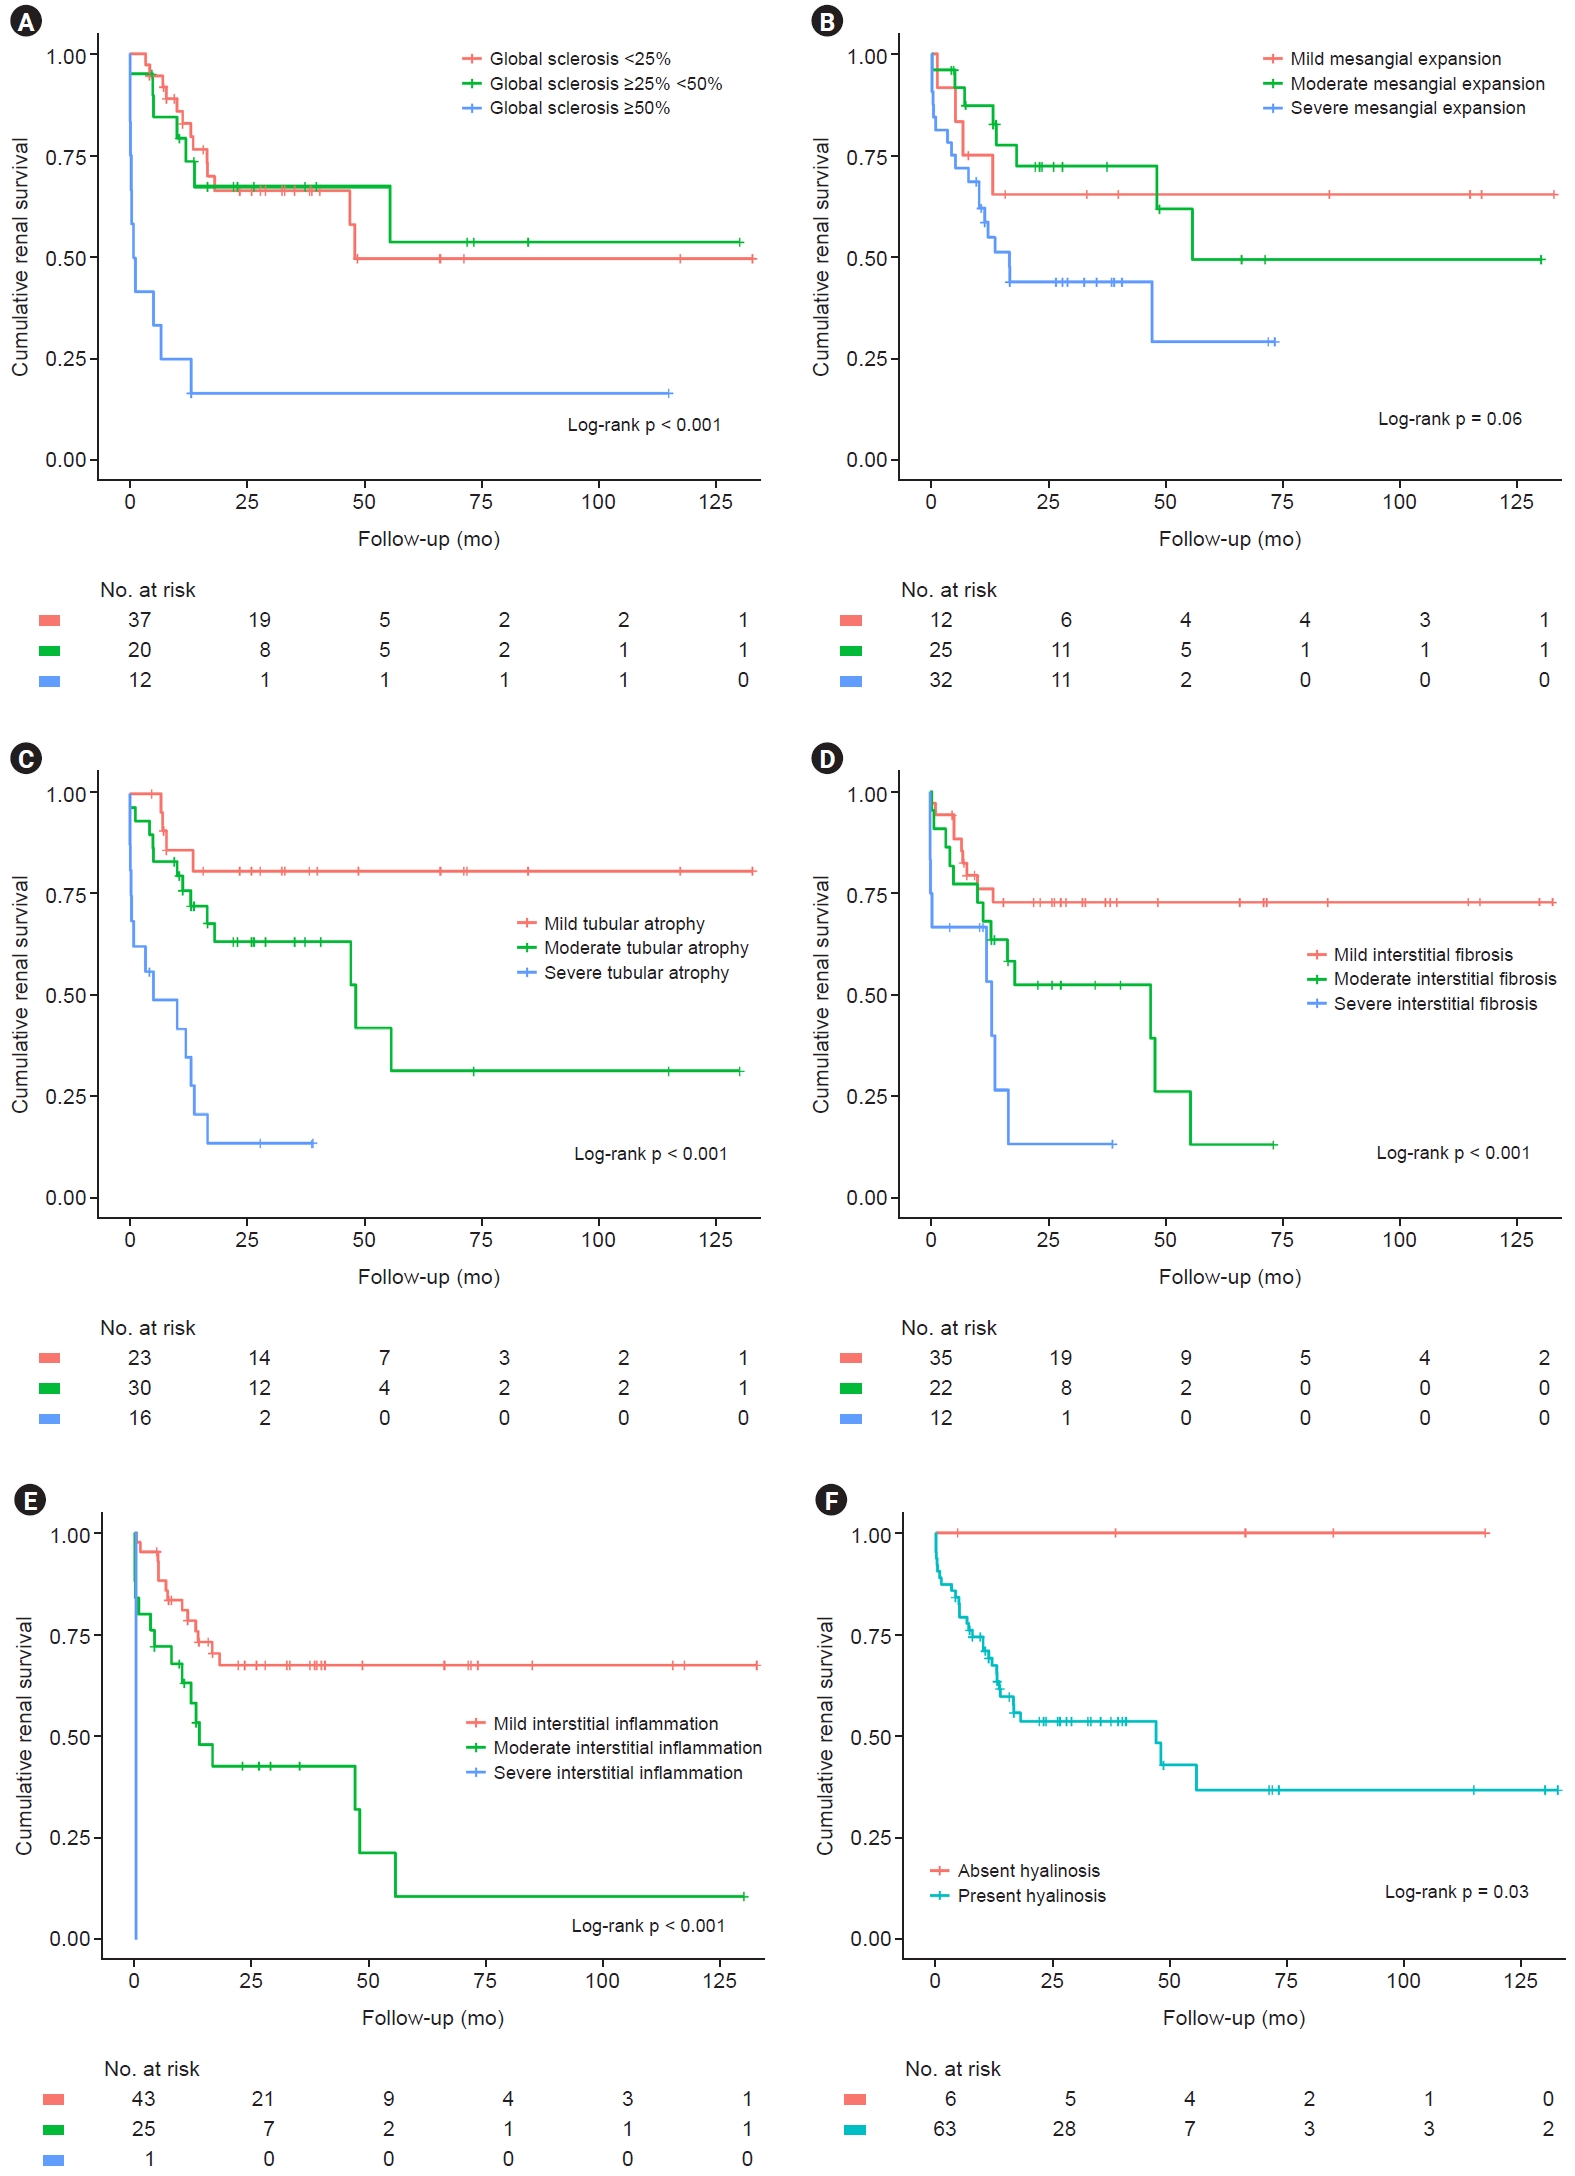
Cumulative renal survival grouped by pathologic features in patients with DKD alone.
Differences in cumulative renal survival grouped by pathologic features in patients with DKD alone are shown by Kaplan-Meier curves. The p-values were calculated by the log-rank test. (A) Three groups were divided by the percentage of glomerulus with global sclerosis with cut-offs of 25% and 50%. The group with 50% global sclerosis had the worst renal outcome compared to the other groups (p < 0.001). (B) Three groups were assigned based on the severity of mesangial expansion. Severity tended to correlate with worse renal outcomes but failed to show statistical significance (p = 0.06). (C) Three groups were assigned based on the severity of tubular atrophy. Severity tended to correlate with worse renal outcomes (p < 0.001). (D) Three groups were assigned based on the severity of interstitial fibrosis. Severity tended to correlate with worse renal outcomes (p < 0.001). (E) Three groups were assigned based on the severity of interstitial inflammation. Severity tended to correlate with worse renal outcomes (p < 0.001). (F) Two groups were assigned based on the presence of hyalinosis. The presence of hyalinosis also resulted in worse renal outcomes (p = 0.03).
DKD, diabetic kidney disease.

Correlation between pathologic findings and laboratory parameters of patients with DKD alone
We used the Cox regression model to determine associations between renal outcomes and clinical and pathologic parameters, including three groups divided by pathologic diagnosis (categorized as DKD alone, NDKD, and DKD/NDKD), age, sex, BMI, MAP, history of hypertension, eGFR, 24-hour urinary protein value (used log2 transformation), and pathologic findings such as global sclerosis, mesangial expansion, tubular atrophy, interstitial fibrosis, and hyalinosis. Because three patients with NDKD did not have 24-hour urinary protein results, they were excluded. We set the DKD-alone group as the reference and showed significantly higher risk in the DKD/NDKD group (hazard ratio [HR], 2.73; 95% confidence interval [CI], 1.09–6.85; p = 0.03). Biological female sex (HR, 0.56; 95% CI, 0.31–1.00; p = 0.048), eGFR (HR, 0.95; 95% CI, 0.94–0.97; p < 0.001), and 24-hour urinary protein values (HR, 1.32; 95% CI, 1.09–1.60; p = 0.004) also showed significant results. Pathologic findings of ≥50% global sclerosis (HR, 3.88; 95% CI, 1.75–8.59; p = 0.001) was a significant independent risk factor. The degree of mesangial expansion was also a significant independent risk factor (moderate degree: HR, 2.45; 95% CI, 1.02–5.85; p = 0.045 and severe degree: HR, 6.22; 95% CI, 2.34–16.55; p < 0.001) (Table 5).

Cox regression model by variable
We noticed different renal outcomes between patients with MCD without DKD and those with DKD and MCD. All patients in both groups received standard steroid therapy. None of the 10 patients with MCD had progressed to ESKD by the last observation. However, four out of seven patients with DKD and MCD progressed to ESKD. The Kaplan-Meier curves clearly showed different renal outcomes (p < 0.001) (Fig. 4).
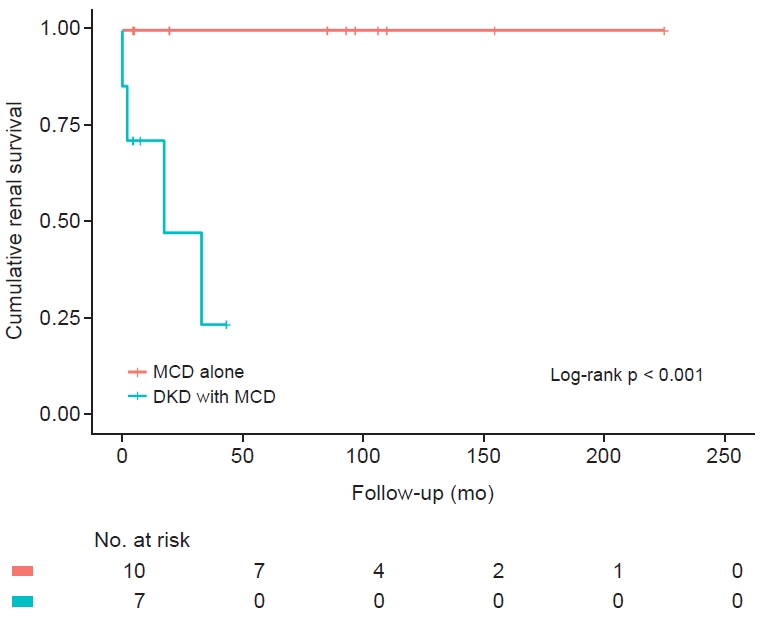
Cumulative renal survival in patients with MCD alone and DKD with MCD.
Differences in cumulative renal survival in patient groups with MCD alone and DKD with MCD are shown by Kaplan-Meier curves. None of the 10 patients with MCD alone progressed to end-stage kidney disease (ESKD) by the last observation. However, four out of seven patients with DKD and MCD progressed to ESKD. Each group was compared by the log-rank test, and the p-value was <0.001.
DKD, diabetic kidney disease; MCD, minimal change disease.
Discussion
DM is the leading cause of ESKD, so clinicians put a lot of effort into identifying DKD and preventing progression to ESKD. However, not every patient with DM proceeds to renal insufficiency caused by DKD, but also caused by other GNs. Many previous studies showed that the proportion of NDKD was high, at up to 83%, although the ranges were broad [22,23]. Because of this heterogeneous nature, it is hard to predict the progression of renal insufficiency in diabetic patients. Recently, even the clinical presentation of the disease has changed. Studies in the United States reported that the incidence of albuminuria is decreasing while renal insufficiency is increasing among adults with DM. Kramer et al. [9] reported that 30% of adults with T2DM and renal insufficiency did not have accompanying albuminuria and retinopathy, which were considered clinical hallmarks of diabetic nephropathy [8,11]. Conventionally, a kidney biopsy is carried out in selected cases, usually those with atypical features. However, under these circumstances, conventional kidney biopsies in diabetic patients are becoming less useful.
Previous studies showed better renal prognosis for patients with NDKD than with DKD alone with appropriate treatment [12–14]. Our study showed that DKD patients with coexisting NDKD had a much higher risk for ESKD (HR, 2.73) independent of other factors. As previous reports and our study showed, the proportion of NDKD is relatively high, so there could be many undiagnosed NDKD patients with DM. With appropriate treatment, the outcomes of these patients may be completely different. Clinical parameters have a limited role in diagnosing NDKD. Only a kidney biopsy is a definite tool, so it should be considered more frequently.
Previous studies tried to use pathologic features to predict renal outcomes in patients with DKD and suggested that features like glomerular sclerosis, tubular atrophy, interstitial inflammation, and hyalinosis, were correlated with worse outcomes [24-31]. Our study also showed that features like ≥50% global sclerosis, tubular atrophy, interstitial fibrosis, interstitial inflammation, and the presence of hyalinosis were related to adverse renal outcomes among DKD patients. Twenty-four-hour urinary protein values did not correlate well. These results suggest that pathologic findings provide clues for renal prognosis apart from 24-hour urinary protein values. The Cox regression model showed that ≥50% global sclerosis and mesangial expansion were significant risk factors apart from other factors like eGFR, 24-hour urinary protein values, interstitial fibrosis, and tubular atrophy. These results suggest that a kidney biopsy has prognostic value, although this has not been established yet. Although a kidney biopsy may result in serious complications, the reported frequency of serious complications is quite low [5,32-34]. Therefore, the benefits of a biopsy to identify NDKD for appropriate intervention and determine prognosis could outweigh the potential risks of a biopsy.
In South Korea, IgAN is the most common type of primary GN, seen in up to 48% of patients [35,36]. Like the general population, this study also showed that IgAN was the most common diagnosis in both diabetic and nondiabetic patients. The proportion of patients with DM who were diagnosed with NDKD was similar to that of nondiabetic patients, except for those with TIN. The proportion of TIN might have been higher than in nondiabetic patients because a kidney biopsy is conventionally performed in cases of sudden decreases in the eGFR in patients with DM. Unlike other groups, patients in the DKD/NDKD group showed more frequent MCD and better prognoses in this study. A previous study showed that IgAN was the most common NDKD in the DKD/NDKD group [12]. Despite standard steroid therapy, patients with DKD and MCD tended to show worse renal prognoses than patients with MCD only. Because diagnosing coexisting MCD is difficult in many cases, these differences should be examined comprehensively in future studies.
This study had some limitations. First, the study was based on retrospective data, and some clinical variables were limited. Second, the follow-up periods were limited and different for each group. This may have caused inaccurate outcomes. Third, this study was based on original biopsy reports and not reviewed comprehensively, so the pathologic judgment used may not have been uniform.
Notes
Conflicts of interest
All authors have no conflicts of interest to declare.
Funding
This study was supported by a grant (NRF-2020R1A2C2003438) from the National Research Foundation (NRF) funded by the Ministry of Science and ICT, Korea. It was also supported by the Soonchunhyang University Research Fund.
Data sharing statement
The data presented in this study are available on request from the corresponding author.
Authors’ contributions
Conceptualization, Methodology: WJK, TO, EYL
Data curation: WJK, TO
Formal analysis: WJK, TO, NHH, KK, GES, SHJ
Funding acquisition: EYL
Investigation: SP, NJC, HWG, EYL, JHL
Writing–original draft: WJK, TO, SP, EYL
Writing–review & editing: WJK, TO, SP, EYL
All authors read and approved the final manuscript.