


Introduction
Higher urinary potassium excretion was recently associated with a lower risk of death and cardiovascular events and the potential to reduce the incidence of hypertension in prospective cohort studies involving general populations [1], [2]. Therefore, urinary potassium excretion has been a concern in clinical settings.
Patients with chronic kidney disease (CKD) frequently experience potassium metabolism disorders, and the management of which, particularly hyperkalemia, is one of the most important aspects of CKD treatment. Urinary potassium excretion is diminished in these patients [3], [4], and several mechanisms, including a reduction in functioning nephron mass [5], use of a renin–angiotensin–aldosterone system (RAAS) inhibitors [6], and the presence of diabetes mellitus (DM) [7], [8], [9], [10], are associated with this decrease. In contrast, to avoid an increase in serum potassium concentrations associated with CKD, amplification of the normal aldosterone-induced signal for potassium excretion and an increase in potassium excretion per nephron in accordance with the increase in serum potassium concentrations have previously been reported as part of the adaptation of renal potassium secretion in patients with CKD [5], [11]. However, few studies have examined the extent of urinary potassium excretion in detail according to CKD progression or the relationship between urinary potassium excretion and clinical parameters in patients with CKD.
This study aimed to (1) compare the extent of urinary potassium excretion between CKD stages [12] and (2) clarify the relationship between urinary potassium excretion and clinical parameters in patients with CKD.
Methods
Patients and study design
This retrospective study included 989 patients (634 men and 355 women; mean age, 62.3 ± 0.5 years) who met the following criteria: (1) the presence of CKD categorized into stages G1–G5 according to the CKD guidelines edited by the Japanese Society of Nephrology [9] at the Division of Nephrology at Saitama Medical Center in Jichi Medical University between January 2006 and December 2010; (2) completion of urinary electrolyte measurements including potassium and sodium concentrations via 24-hour urine collection; and (3) the absence of dialysis treatment. This study was approved by the Institutional Review Board of the Saitama Medical Center, Jichi Medical University (RIN-13-30), Japan, and it conforms to the provisions of the Declaration of Helsinki (as revised in Tokyo, 2004).
We collected and retrospectively analyzed sociodemographic patient data regarding age, sex, the presence of DM, antihypertensive treatment with RAAS inhibitors including angiotensin-converting enzyme inhibitors and angiotensin receptor blockers, and diuretic treatment with loop and thiazide diuretics. Biochemical variables including blood urea nitrogen, serum creatinine, sodium, potassium, chloride, albumin, and hemoglobin levels were measured. We calculated the estimated glomerular filtration rate (eGFR) using the following equation [12]:where S-Cr indicates the serum creatinine concentration (mg/dL).
Furthermore, 24-hour urine collection was performed for each patient to evaluate urinary sodium, potassium, and protein excretion. The 24-hour urine collection was initiated after the first morning urine was discarded in the patient's toilet. Thereafter, the entire volume of urine was collected in a disposable 3-L container. To avoid the possibility of inadequate urine collection, we trained all patients to properly collect their urine samples and reinforced that 24-hour urine collection must be initiated at a specific time and then completed at the same time the next day.
On the basis of the results of these examinations, the fractional excretion of potassium (FEK) was calculated using the following equation:where the U-K, S-K, U-Cr, and S-Cr indicates the urinary potassium concentration (mEq/L), the serum potassium concentration (mEq/L), the urinary creatinine concentration (mg/dL), and the serum creatinine concentration (mg/dL), respectively.
Statistical analysis
Data are expressed as means ± standard error. A chi-square test was used to assess associations between categorical variables, including the utilization and distribution of RAAS inhibitors and diuretics, complemented by adjusted residual analysis. Correlations between the 2 groups were evaluated using the Pearson correlation coefficient and linear regression analysis, and differences between the 2 groups were evaluated using the unpaired t test. The differences between CKD stages were evaluated using a 1-way analysis of variance and the Scheffe test. Variables that were significantly correlated with urinary potassium excretion in a simple linear regression analysis, including the DM status and use of RAAS inhibitors, were included in the multivariable linear regression analysis to identify factors affecting urinary potassium excretion in patients with CKD. A P value < 0.05 was considered significant.
Results
Patient demographics and clinical characteristics are shown in Table 1. The numbers of patients at each CKD stage were as follows: G1 and G2 combined (G1 + G2): 135; G3a: 107; G3b: 170; G4: 289; and G5: 288. The proportion of patients with DM for CKD stages G4 and G5 significantly increased compared to CKD stages G1 + G2, G3a, and G3b (P < 0.05). The proportions of patients using angiotensin-converting enzyme inhibitors and/or angiotensin receptor blockers increased significantly with worsening of the CKD (P < 0.05, G3b vs. other stages). However, there were no significant differences between G4 and G5. The proportion of patients using loop and/or thiazide diuretics and polystyrene sulfonates also increased significantly with CKD progression (loop and/or thiazide diuretics: P < 0.05, G4 vs. other stages; polystyrene sulfonates: P < 0.01, G1 + G2 vs. G5). Serum potassium concentrations at stage G5 were significantly higher than those at the earlier stages. Furthermore, the values of urinary sodium excretion at stages G4 and G5 were significantly lower than those at CKD stages G1 + G2, G3a, and G3b.
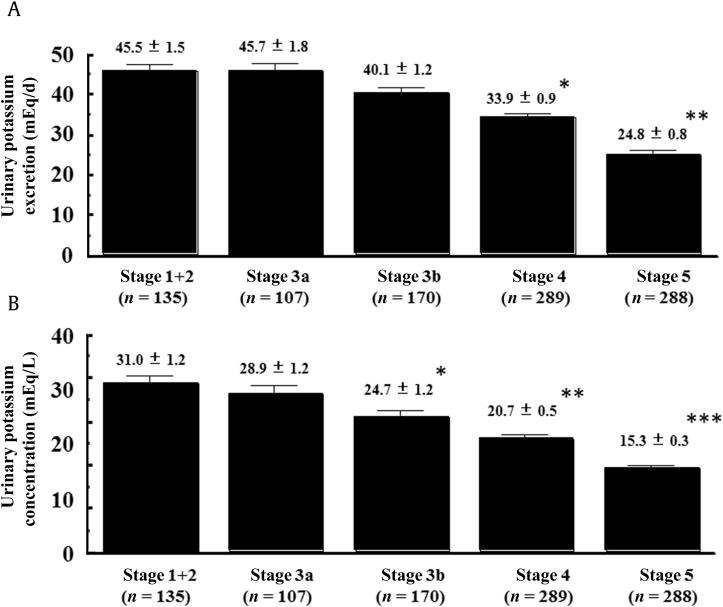
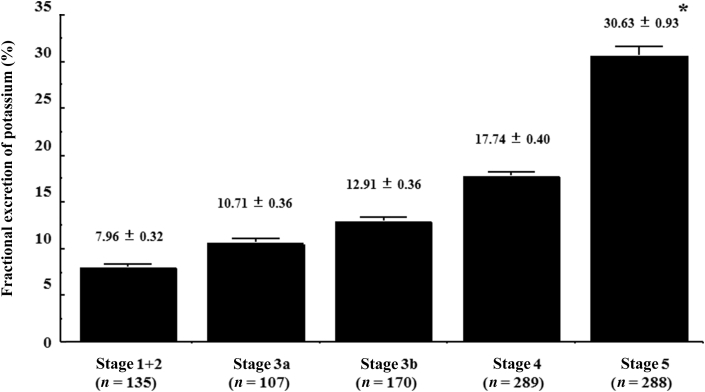
As shown in Fig. 1A, urinary potassium excretion did not differ significantly among stages G1 + G2, G3a, and G3b; however, the values were significantly lower at G4 relative to the earlier stages, and a further significant decrease was observed at G5 (G4: 33.9 ± 0.9 mEq/d, G5: 24.8 ± 0.8 mEq/d; both P < 0.001 vs. earlier stages). In contrast, as shown in Fig. 1B, there was a significant decrease in urinary potassium concentrations at stage G3b relative to earlier CKD stages (G3b vs. G1 + G2: P < 0.01; G3b vs. G3a: P < 0.05), before the significant decrease of urinary potassium excretion at G4. These values were also significantly decreased at stages G4 and G5 relative to earlier stages (G4: 20.7 ± 0.5 mEq/L; G5: 15.3 ± 0.3 mEq/L, both P < 0.001 vs. earlier stages). Furthermore, FEK values tended to increase according to the progression of CKD, and the value at stage G5 was significantly higher than that at the other stages (G5: 30.63 ± 0.93%, P < 0.001; Fig. 2).
Table 2 shows the correlations between urinary potassium excretion and the clinical parameters observed in the present study. Urinary potassium excretion was positively correlated with urinary sodium excretion and eGFR and negatively correlated with age and serum chloride concentrations in a simple linear regression analysis. However, there was no association between urinary potassium excretion and serum potassium concentrations. In addition, we performed a multivariable linear regression analysis including variables that were significantly correlated with urinary potassium excretion in a simple linear regression analysis, DM status, and the use of RAAS inhibitors. The multivariable regression analysis showed that urinary potassium excretion was independently associated with urinary sodium excretion (standardized coefficient, 0.499), eGFR (0.281), and serum chloride concentration (–0.086), whereas age, presence of DM, and use of RAAS inhibitors were not significantly and independently associated with urinary potassium excretion in this study. Furthermore, we examined the differences of urinary potassium excretion in patients with or without DM and in those with or without the use of RAAS inhibitors. As shown in Table 3, there were no differences of urinary potassium excretion with or without DM and with or without the use of RAAS inhibitors at each CKD stage.
Discussion
In this retrospective study involving patients with CKD, a significant decrease in urinary potassium excretion was observed at CKD stage G4 relative to the earlier stages, and this decrease progressed further at stage G5, ultimately reaching approximately 25 mEq/d. Recently, the decrease of urinary potassium excretion, which was less than 1.5 g/d, was associated with an increased risk of death and cardiovascular events in a large-scale epidemiologic cohort study [1]. Urinary potassium excretion of 1.5 g/d corresponded to 38.4 mEq/d; therefore, the risk of death and cardiovascular events may have been increased in patients with stage G4 and G5 CKD in this study because both values of urinary potassium excretion were less than 38.4 mEq/d. However, further study is required to clarify the relationship between the level of urinary potassium excretion in patients with CKD and their prognosis.
Concerning the decrease in urinary potassium excretion in patients with CKD, several reports suggested that potassium excretion ability is diminished because of reductions in renal mass, administration of RAAS inhibitors, and the presence of DM [3], [4], [5], [6], [7], [8], [9], [10]. In the present study, in addition to the influence of CKD progression on the decrease of urinary potassium excretion, the previously reported relationship between urinary potassium excretion and use of RAAS inhibitors was believed to be present at CKD stages G1 + G2–G4, to some extent, because urinary potassium excretion decreased according to increases in the use of RAAS inhibitors at these stages. Furthermore, the proportions of patients with DM for CKD stages G4 and G5 were significantly increased compared to early CKD stages with the decrease of urinary potassium excretion according to CKD progression. As to the relationship between urinary potassium excretion and DM status, insulin was reported to activate the basolateral Na/K pump and apical potassium channels in the cortical collecting duct [13] and enhance renal potassium secretion [13], [14]. Therefore, the presence of DM with insulin deficiency or insulin resistance was expected to reduce urinary potassium excretion. However, according to the multivariable regression analysis and the comparison of urinary potassium excretion in patients with or without DM and in those with or without the use of RAAS inhibitors at each CKD stage, neither the presence of DM nor the use of RAAS inhibitors was associated with urinary potassium excretion in this study. Regarding the influence of DM and RAAS inhibitors on serum potassium handling, previous investigations demonstrated that the presence of DM, the use of RAAS inhibitors, and lowered renal function or reduced eGFR are independent factors that increase serum potassium level [15], [16]. Therefore, factors causing hyperkalemia would differ from those affecting urinary potassium excretion in this study. To clarify urinary potassium handling affected by clinical parameters, including the presence of DM and use of RAAS inhibitors, further studies will be required.
Diuretics such as loop diuretics and thiazides are known to induce hypokalemia through an increase in urinary potassium excretion [17]. In this study, although the proportions of patients using diuretics were significantly smaller at CKD stages G1 + G2–G3b, urinary potassium excretion ability decreased significantly according to the progression of CKD. Therefore, the use of diuretics was not associated with urinary potassium excretion because of the lack of a progressive increase in urinary potassium excretion, even with an increase in the proportion of patients using diuretics according to CKD progression.
In this study, a significant decrease in urinary potassium concentration was revealed at CKD stage G3b before decreases in urinary potassium excretion at CKD stage G4. In chronic renal insufficiency, urine flow in residual nephrons was adaptively enhanced because of a decrease in tubular sodium reabsorption [18], and this adaptive mechanism could contribute to the preservation of urinary potassium excretion at CKD stage G3b, even with a significant decrease in the urinary potassium concentration. Furthermore, we compared FEK values between CKD stages. FEK values denote potassium excretion ability corresponding to urinary creatinine excretion. In patients with CKD, these values indicated a change in urinary potassium excretion corresponding to a decrease in urinary creatinine excretion. As the results illustrated, there were no differences in FEK values among CKD stages G1 + G2 – G4; however, these values increased significantly at CKD stage G5 relative to those observed at earlier stages. In patients with renal disease, FEK values and creatinine clearance were significantly and negatively correlated [19]. According to previous findings and our results, urinary potassium excretion ability would have been maintained in each functioning nephron unit even in advanced CKD stages, compared to the decrease in urinary creatinine excretion.
Although a significant positive relationship between plasma potassium concentration and urinary potassium excretion has been reported in chronic renal insufficiency [20], this was not observed in this study. With respect to the correlation between urinary potassium and sodium excretion, to stimulate urinary potassium excretion, adequate sodium delivery to the distal tubule and cortical collecting duct is necessary for aldosterone action [21]. In addition, the extent of tubular potassium secretion in these segments, which accounts for most of the total level of urinary potassium excretion, is determined by the amount of sodium delivered to the nephrons [22]. Therefore, the positive association between urinary potassium and sodium excretion in this study could be considered adequate, which is consistent with previous reports. However, both urinary potassium and sodium excretion usually decreased according to the progression of CKD [3], [4], [5], [23]. Therefore, it would be difficult to evaluate whether the positive correlation between urinary potassium and sodium excretion is a cause or effect. Furthermore, there was a significant independent correlation between urinary potassium excretion and serum chloride concentrations, although this correlation was extremely weak. Because an increase of the serum chloride concentration, which is sometimes associated with hyperchloremic metabolic acidosis, frequently appears according to the progression of CKD, this association might reflect the result accompanying the progression of CKD.
Regarding the limitations of this study, because serum aldosterone concentrations were not measured, we cannot comment on whether urinary potassium excretion was influenced by the action of aldosterone in patients with CKD. Moreover, the proportion of patients receiving dietary education, including salt and potassium restrictions (salt intake of less than 6 g/d and potassium intake of less than 40 mEq/d), was considered to increase according to the progression of CKD. Therefore, the influence of potassium restriction cannot be excluded from the decreases in urinary potassium excretion and concentrations although serum potassium concentrations increased with worsening of CKD.
In conclusion, this study demonstrated that urinary potassium excretion decreased according to reductions in renal function. Furthermore, urinary potassium excretion was mainly affected by urinary sodium excretion and eGFR in patients with CKD, whereas the presence of DM and use of RAAS inhibitors were not associated with urinary potassium excretion in this study.
 PDF Links
 PubReader
 Full text via DOI
 Download Citation
 Print
Print


")


