Kidney Res Clin Pract > Volume 42(2); 2023 > Article
Honda, Takaki, and Kang: Recent advances in electron microscopy for the diagnosis and research of glomerular diseases

Abstract

Recent technical advances in the detection of backscattered electrons during scanning electron microscopy (SEM) have improved resolution and have provided several new technologies for research and clinical practice in kidney disease. The advances include three-dimensional (3D) electron microscopy (3D-EM), correlative light and electron microscopy (CLEM), low-vacuum SEM (LVSEM), and scanning transmission electron microscopy (STEM). 3D-EM analysis used to be laborious, but recently three different technologies, serial block-face SEM, focused ion beam SEM, and array tomography, have made 3D-EM easier by automating sectioning and the subsequent image acquisition in an SEM. CLEM is a method to correlate light microscopic images, especially immunofluorescent and electron microscopy images, providing detailed ultrastructure of the area of interest where the immunofluorescent marker is located. LVSEM enables the use of SEM on materials with poor electron conductivity. For example, LVSEM makes it possible for high resolution, 3D observation of paraffin sections. Finally, STEM is a method to observe ultrathin sections with improved resolution by using the focused electron beam scanning used in SEM and not the broad electron beam used in transmission electron microscopy. These technical advances in electron microscopy are promising to provide plenty of novel insights for understanding the pathogenesis and diagnosis of various glomerular diseases.

Introduction

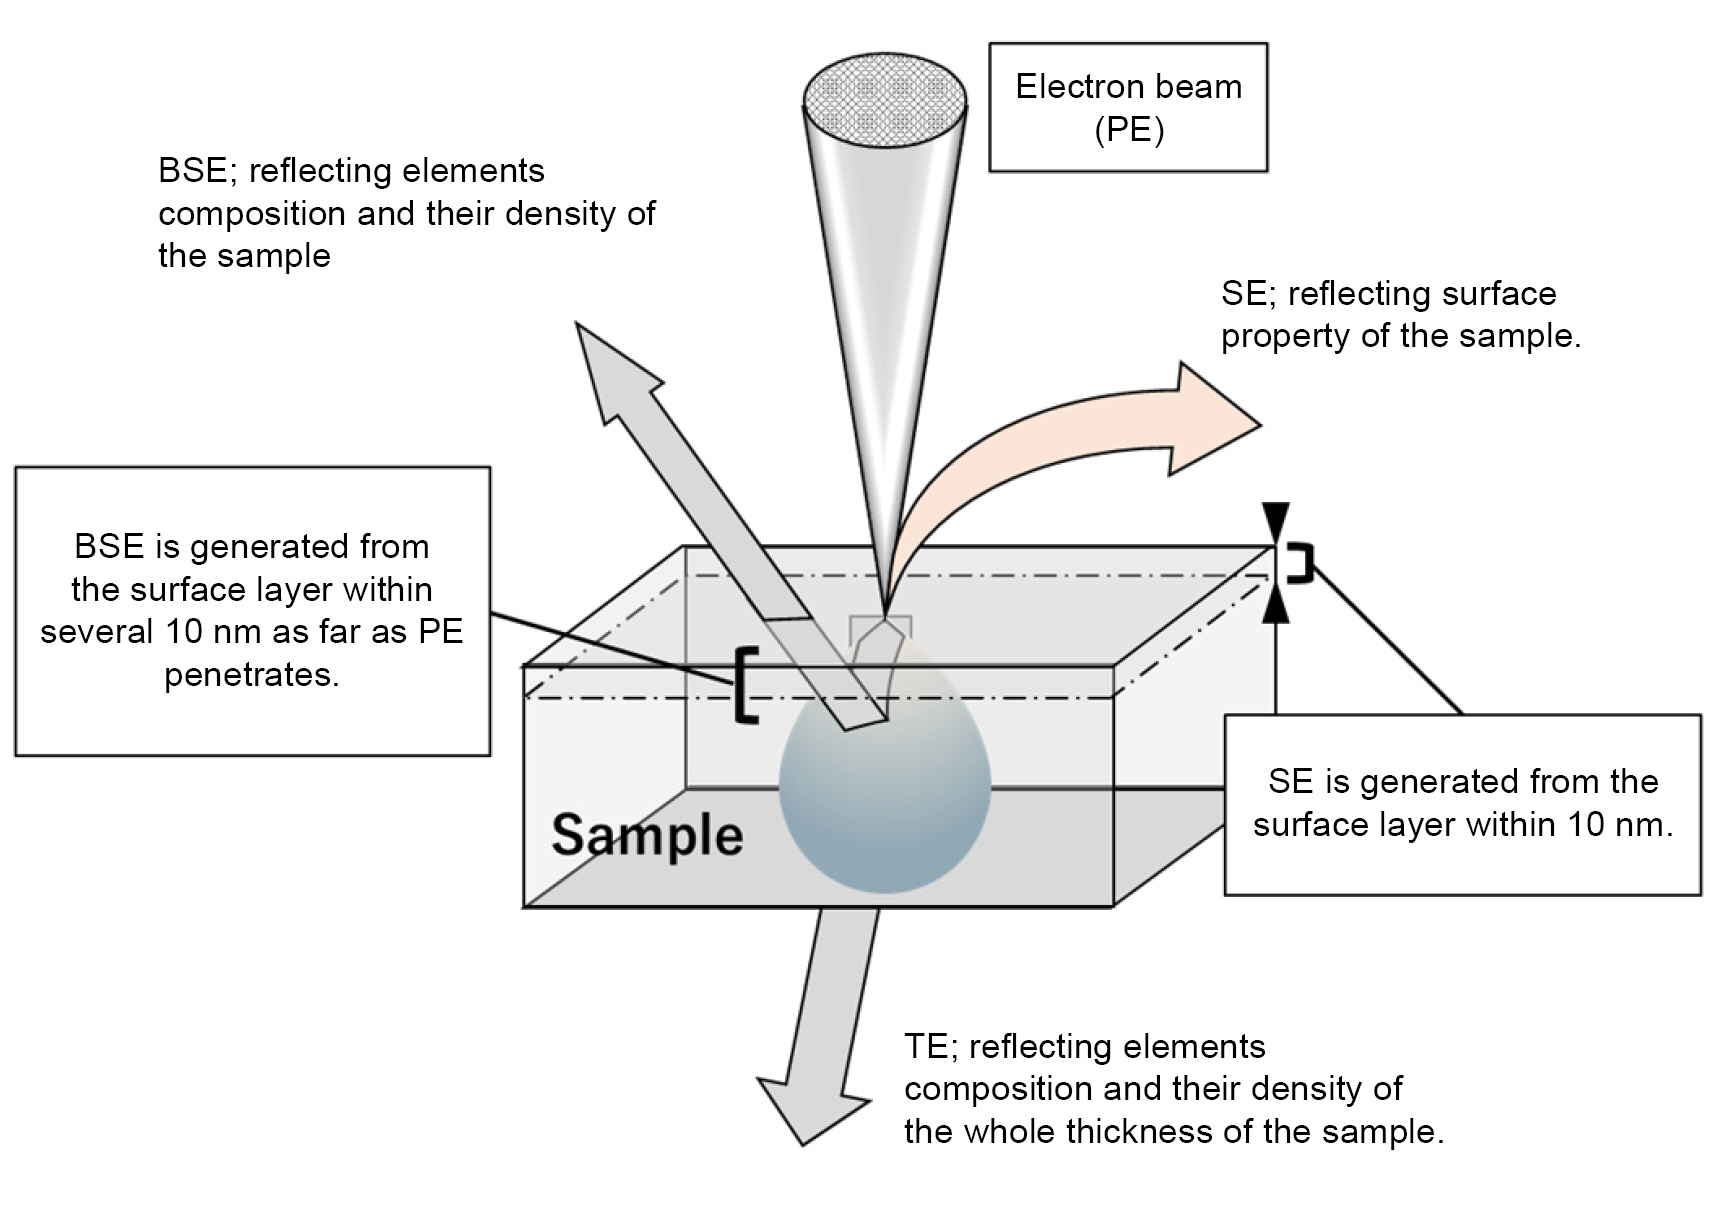
There are two kinds of electron microscopy (EM); transmission EM (TEM) and scanning EM (SEM). TEM has been used for routine examination for kidney biopsy diagnosis, and vast knowledge of various glomerular diseases has been accumulated. The advantage of TEM is its high resolution made possible by the high acceleration voltage (60–200 kV) of its electron beam. In TEM applied to biological specimens, the usual acceleration voltage is 100 kV, which can penetrate the sample to a depth of 100 nm. That is deeper than the usual thickness of ultrathin sections (60–80 nm) and can enable a resolution of 1 nm. Conversely, in an SEM the acceleration voltage is 10 to 30 kV to avoid excessive penetration of the electron beam because the purpose of SEM is to view the surface. SEM acquires surface information by detecting two different kinds of electrons; secondary electrons (SE) and backscattered electrons (BSE). When an electron beam reaches the sample, SE are generated from a superficial zone of the sample with a depth of up to 10 nm, reflecting the surface property of the sample. In contrast, BSE are generated from sample depths on the order of several tens of nm, revealing the elemental composition and density of the sample (Fig. 1). Elements with higher atomic number generate stronger BSE.
Because the amount of BSE is relatively low from the low acceleration voltage of 10 to 30 kV in SEM, BSE used to be difficult to detect, making it challenging to determine surface information. In 1996, Richards and ap Gwynn [1] reported a novel method for viewing the surface of the resin block by detecting BSE in SEM, which promoted the use of SEM. Because of its ease of sample preparation and the lack of a need for ultrathin sectioning, SEM is easier to use compared to TEM. Recently, the improved ability to detect BSE for surface imaging has further extended the utility of SEM, suggesting that SEM may replace TEM for routine EM examinations in the future [2].

Three-dimensional electron microscopy analysis by scanning electron microscopy (volume scanning electron microscopy)

For a better understanding of morphological architecture, a three-dimensional (3D) image is undoubtedly superior to a two-dimensional one. A 3D observation of a cell or tissue can be achieved with considerably high resolution using confocal laser scanning microscopy (CLSM). However, to get further detailed ultrastructural information, EM analysis is required. Although SEM can easily obtain 3D images of the surface, the internal ultrastructure, such as neuronal circuits or cell organelles, cannot be observed by SEM. In addition, the resolution capacity of SEM is also limited compared to TEM, Therefore, acquisition and reconstruction of serial TEM images are necessary to perform 3D ultrastructural analysis at high resolution. The generation and analysis of serial TEM sections for 3D reconstruction requires a highly skilled technique along with a lot of time and labor. These technical obstacles have been overcome by recent advances in automatic serial sectioning and imaging by SEM. Currently, there are three different procedures for 3D ultrastructure imaging; serial block-face (SBF) SEM, focused ion beam (FIB) SEM, and array tomography (Fig. 2) [35]. The methods for sample preparation to make a resin-embedded block and the analytical procedures after acquiring the serial image data are common in all three procedures. The characteristics of each procedure, including advantages, disadvantages, and suitable objects for the research, are discussed below and summarized in Table 1.

Serial block-face scanning electron microscopy

SBF-SEM requires an ultramicrotome installed inside the SEM vacuum chamber. An ultrathin section is cut with a diamond knife, and the exposed surface of the sample is scanned with an electron beam and detected by BSE to capture a TEM-like image. Serial images of the sample can be obtained consecutively, repeating this procedure (Fig. 2A). In this method, the specimen size is usually limited to 0.5 mm, depending on the width of the diamond knife, and the acceleration voltage is restricted to 1–10 kV to avoid damage to the tissue of the next surface sectioned, which limits the system’s ability to achieve high resolutions. The sample size can be up to 1 mm in width, which is as much as the ultramicrotome can cut. Another disadvantage of SBF-SEM is the loss of cut sections, making it impossible to perform further examinations.
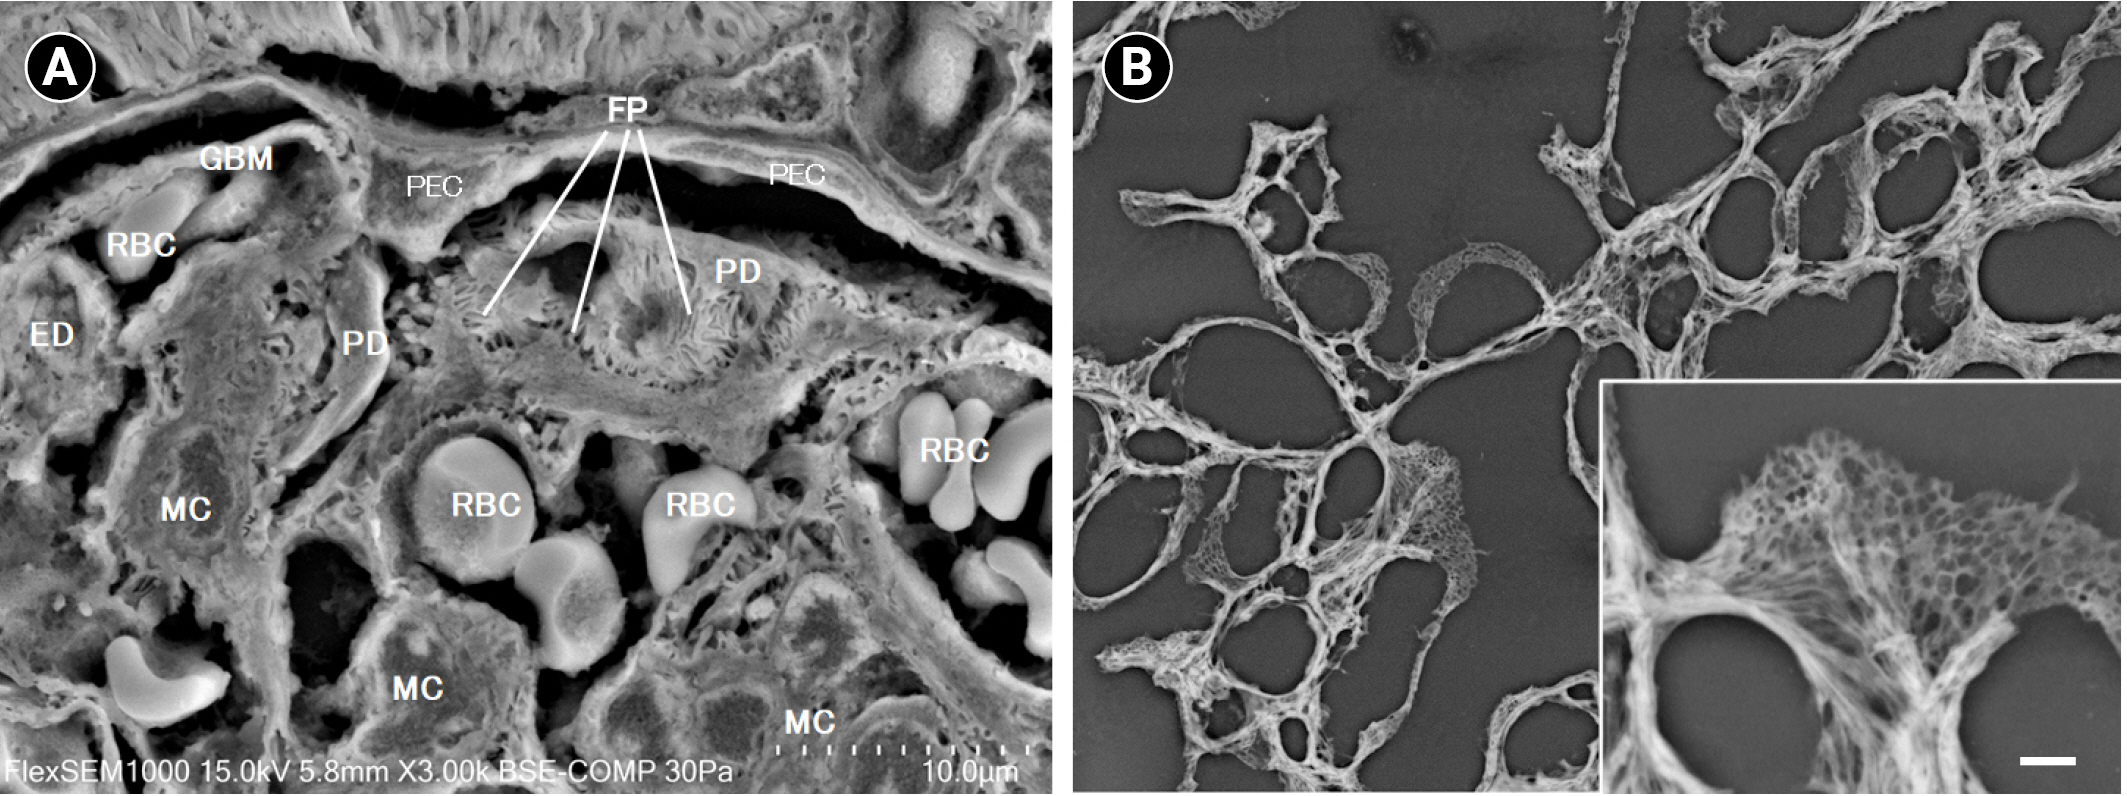
Ichimura et al. [6] investigated the 3D ultrastructure of podocytes using SBF-SEM and revealed that a novel structure of “ridge-like prominences” formed on the basal side of the podocyte cell body and was the primary platform for projecting foot processes. Randles et al. [7] also revealed 3D ultrastructural alterations of podocytes and the glomerular basement membrane (GBM) in a variety of mouse models of human glomerular diseases, such as Alport syndrome, focal segmental glomerulosclerosis, and childhood-onset nephrotic syndrome. Takaki et al. [8] demonstrated 3D morphological alterations of podocytes and mesangial cells in kidney biopsy samples of lupus nephritis and revealed multiple direct contacts of podocyte cytoplasmic processes with the mesangial cell body (Fig. 3). Nagai et al. [9] also demonstrated a similar phenomenon in which podocytes and mesangial cells established intercellular contacts through disrupted GBM in the glomerulus of immunoglobulin A (IgA) nephropathy.

Focused ion beam scanning electron microscopy

A FIB-SEM is equipped with a FIB system for milling the surface of the sample. The image is taken by detecting BSE and creating TEM-like images by SEM. Serial images are acquired by repeating the process of milling and scanning the exposed surfaces (Fig. 2B). Of the three different procedures for 3D ultrastructure imaging, FIB-SEM can achieve the highest image resolution (5 nm) and the thinnest slice thickness, but the sample size is restricted to be as small as 20 μm per side due to the limited area of ion beam current. The other disadvantages of FIB-SEM are sample loss by milling, sample damage by ion beam current, and the high cost of the equipment. Ichimura et al. [10,11] and Myyaki et al. [12] conducted excellent experimental studies using FIB-SEM to demonstrate interesting ultrastructural architectures of podocytes in organ development [10] and in experiments on puromycin nephrosis in rats [11,12].

Array tomography

Array tomography is a method in which ultrathin sections are cut by a stationary diamond knife attached at the edge of water-filled boat. The series of cut sections are then automatically or semiautomatically mounted on a substrate, such as a glass slide [13], silicon plate [14], or electron conductive tape [15]. Thereafter, the samples on the substrate are automatically observed by SEM connected to the sectioning equipment or are transferred to another SEM and imaged manually (Fig. 2C). The advantages of this method are its applicability to large samples of up to several millimeters (3 × 3 mm2), its preservation of the sections for subsequent electron-staining or immunostaining and reexamination, and its usefulness for CLEM [16]. Because the apparatus for cutting and mounting sections can be separated from the SEM, the cost can be reduced when the existing SEM is used for manual image acquisition. Array tomography is also a useful technology when the preserved ultrathin sections are efficiently utilized in later examinations, such as in immuno-EM, to create fascinating images of cells and tissues.

Low-vacuum scanning electron microscopy

Low-vacuum SEM (LVSEM) is designed to apply SEM to materials with poor electron conductivity. ‘Low vacuum’ means that evaporated ion particles with both positive and negative charges are present in the SEM chamber, effectively preventing the electron charge-up phenomenon on the sample surface, the main obstacle for SEM observation, especially when it is applied to biological specimens that have not been coated with a metal. The low vacuum also allows the apparatus to be small, such as table-top size. As a result, several low-cost and easy-to-use LVSEMs have been provided by EM companies.
Inaga et al. [17,18] introduced a novel method to analyze paraffin-embedded kidney biopsy sections with LVSEM. This method enabled rapid and convenient electron microscopic observation without any special procedures for EM and provided a wide-range observation of biopsy specimens using identical sections from observation with light microscopy (LM) [19]. In this examination, periodic acid methenamine- and Masson-stained sections were useful for the observation because they contained a heavy metal, silver or tungsten, respectively, which provided metal staining for EM and led to clearer images of the glomerular structures, like GBM and mesangium (Fig. 4A). Furthermore, this method revealed the 3D glomerular morphology because the section was cut at several μm thicknesses, resulting in unexpected, interesting implications for understanding the pathology of a variety of glomerular diseases (Fig. 4B). Okada et al. used LVSEM to demonstrate 3D alterations of GBM in Alport syndrome and thin basement membrane disease [20] and podocytes and GBM in patients with pediatric nephrotic syndrome [21]. Masuda et al. [22] applied LVSEM to investigate GBM injury in IgA nephropathy and revealed GBM abnormalities combined with abnormal immunostaining of type IV collagen α2 and α5 chains in the same section of biopsy material. Recently, two studies on kidney allografts demonstrated that LVSEM was useful for early diagnosis for transplant glomerulopathy in chronic antibody-mediated rejection [23,24].
Recently, Sawaguchi et al. [25] reported a precise method to perform an informative 3D survey using a 30-μm-thick paraffin section, facilitating the investigation of face-side (instead of sectioned) images of cell/tissue architectures, rarely seen in the usual thin-section observations. In research practice, Mukai et al. [26] established a novel and convenient method to demonstrate the 3D structure of endothelial glycocalyx observed by LVSEM.
We anticipate that LVSEM can give useful information in the ordinary diagnosis of kidney biopsy, providing insights into the glomerular pathology. In 2017, the study organization of LVSEM for Renal Biopsy was founded by Japanese renal pathologists and nephrologists interested in and engaging in this enterprising technique (https://lvsem.org). We hope that the activity of this study organization will contribute to the progress in the research and clinical practice of nephrology in the future.

Correlative light and electron microscopy

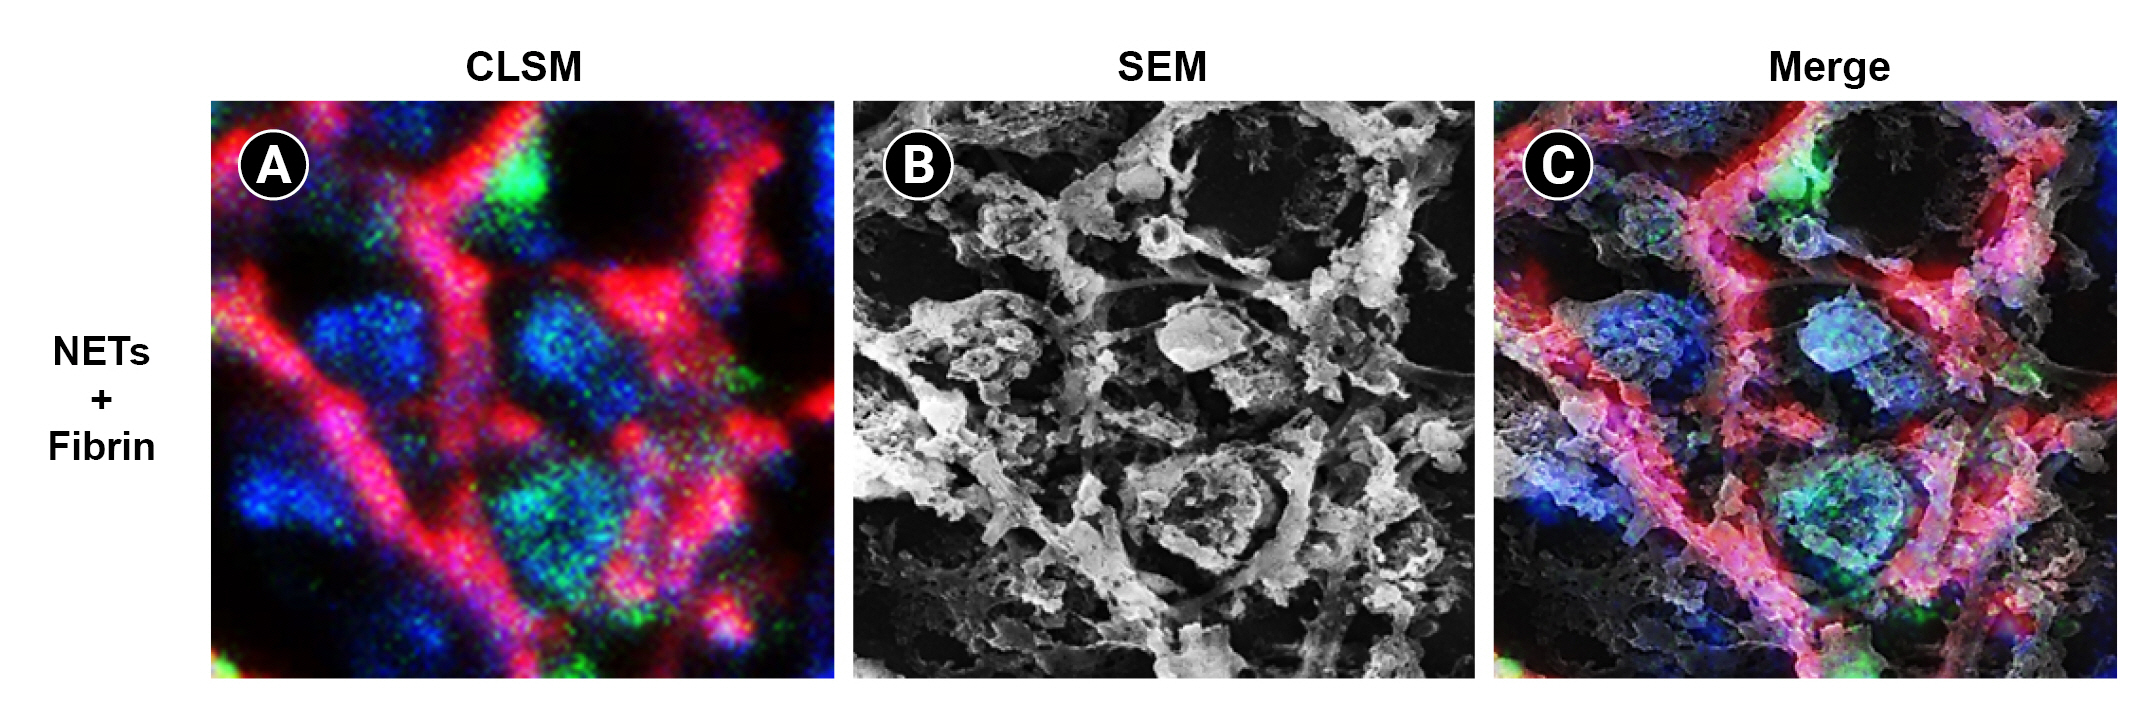
Correlative light and EM (CLEM) is a method to correlate an LM image with an EM image, enabling visualization of the ultrastructural morphology of the region of interest where the LM marker, such as a fluorescent protein or dye, is located [27,28]. Because CLEM can be applied to several methodologies, including different microscopic modalities and image processing techniques, it has great potential for use in future research in a variety of fields of medicine and science. The LM image is usually taken from the section using immunofluorescence (IF) or immunohistochemistry (IHC), and the EM image is taken from the same section after metal staining for TEM or SEM. Then, both images are merged by a digital graphic application. The following procedures are performed in a typical CLEM analysis: 1) IF or IHC staining, 2) LM imaging, 3) heavy metal coating (sputtering) or staining, 4) EM imaging by TEM or SEM, and 5) merging both images by graphic software. At the beginning of CLEM, Takizawa and Robinson [29] introduced a method to stain the ultrathin section cut from a resin-embedded block using a bifunctional marker for IF and EM, a fluorescent ultrasmall immunogold probe, FluoroNanogold (Nonoprobes, Yaphank, NY, USA), and then observed the stained section by TEM. Later, Koga et al. [30] developed another CLEM method using semi-thin resin sections stained by fluorescent nanogold and observed the same fields by CLSM and SEM. Recently, SEM has been preferred for EM imaging, resulting in a variety of samples for immunostaining methods. Onouchi et al. [31] performed an excellent CLEM study that employed CLSM and SEM using formalin-fixed paraffin-embedded autopsy lung sections to demonstrate high-resolution 3D images of neutrophil extracellular traps (NETs) and fibrin fibrils (Fig. 5). These technologies can be applied to kidney biopsy samples, but several critical conditions must be investigated carefully, such as fixation, embedding, and sectioning, to preserve the morphological quality for ultrastructural observation.

Scanning transmission electron microscopy

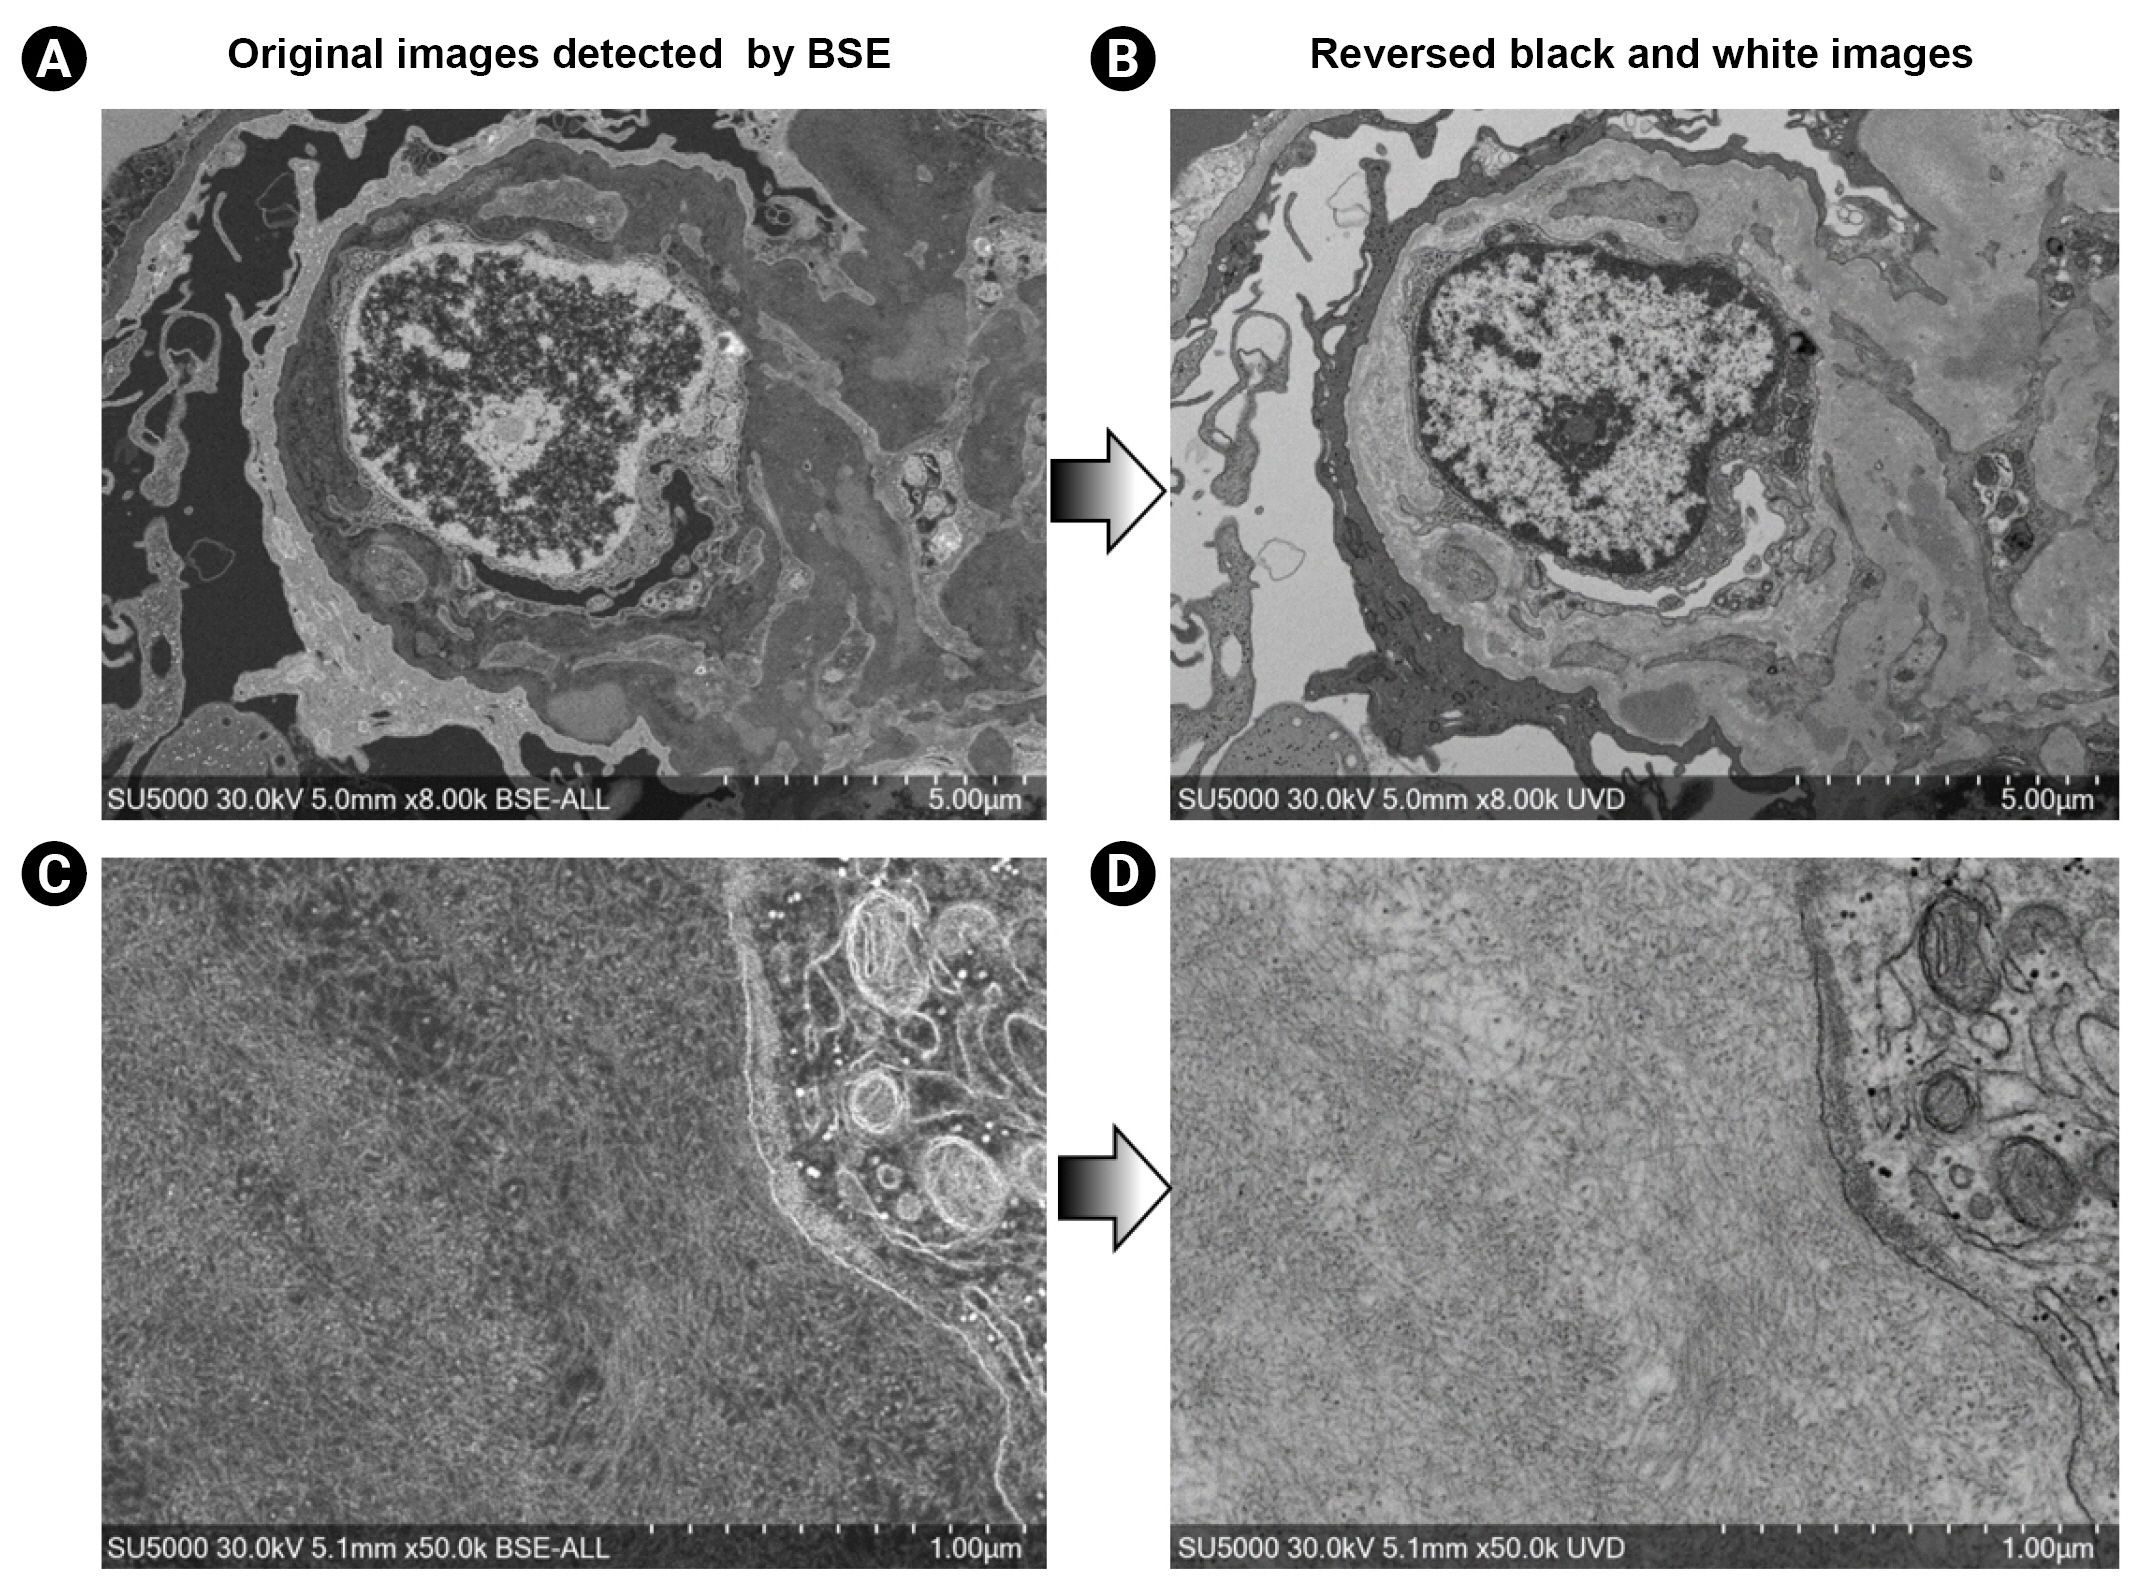
A higher resolution can be achieved by the stronger acceleration voltage in TEM and a more focused electron beam in SEM. Scanning transmission EM (STEM) is a method to combine both procedures to greatly improve the resolution. This method observes ultrathin sections not by the broad electron beam used in TEM but by the focused scanning electron beam used in SEM and has been employed in material science and technology, achieving a resolution of 40.5 pm [32]. However, STEM has not been applied to biological specimens because it is unsuitable for low-contrast specimens. Aoyama et al. [33] have applied STEM to observe cultured cells embedded in resin and cut into 1-μm-thick sections. In their study, STEM tomography successfully demonstrated very fine ultrastructural 3D images of mitochondria. In STEM, the emitted electron beam permeates through the sample and hits the reflection plate located under the sample. After that, the signal is generated as SE and detected by an ultra variable detector (UVD) in the SEM (Fig. 6). Because the sample is thicker, noise signals are easily generated from the sample and the reflection plate, increasing the signal-to-noise ratio and interfering with clear imaging. A novel scintillation holder is installed under the sample instead of the reflection plate to overcome this problem, enabling an increase in STEM signal and improving the detection by the UVD [34]. Using STEM methods, we can demonstrate a high-resolution TEM-like image by observing the ultrathin section of human kidney biopsy samples with SEM instead of TEM (Fig. 7). The technical advances in STEM will soon promote applying STEM to biological research and provide plenty of insights to understand the pathology of glomerular disease. It may also dramatically improve the resolution quality of LVSEM, allowing LVSEM to serve as a substitute for TEM in future clinical practices of kidney biopsy diagnosis.

Conclusions and future prospective

TEM has been necessary for the diagnosis of kidney biopsy, and this situation will not change. However, the technical complexity and high cost of TEM limit its use in many hospitals and institutes. Recent advances in EM, especially in SEM, promote the expansion of the use of SEM in a variety of directions, such as TEM-like imaging by SEM without complex techniques, automated 3D ultrastructural imaging, application of paraffin-embedded sections for ultrastructural observation by LVSEM, and STEM techniques to improve the resolution of ordinary SEM. In addition, CLEM imaging can provide fantastic images to help understand the physiology and pathology of various organs and cells. EM technology has progressed in this half-century, and many advances in renal pathology and nephrology are indebted to EM. We believe this situation will be the same during the next half of the century and provide plenty of novel insights for understanding the pathogenesis and diagnosis of a variety of glomerular diseases in the future.

Notes

Conflicts of interest

All authors have no conflicts of interest to declare.

Authors’ contributions

Conceptualization: KH, TT

Data curation: KH, TT, DK

Writing–original draft: KH, TT

Writing–review & editing: KH, TT

All authors read and approved the final manuscript.

Figure 1.

Backscattered electrons (BSE) and secondary electrons (SE) of scanning electron microscopy.

The emitted electron (primary electron [PE]) beam generates three kinds of electrons after reaching the sample: transmission electrons (TE), SE, and BSE. TE are affected by the elemental composition and density of the sample and are detected at the detection plate under the sample in TE microscopy (TEM). SE are generated at the surface and affected by the surface irregularities and contours of the sample surface to a depth of up to 10 nm. BSE, also called posterior scattered electrons, are derived from the surface layer consisting of several tens of nanometers nm and are affected by the elemental composition, density, and concave-convex nature of the surface. BSE intensity depends on the atomic number and the acceleration voltage, which influences the depth of penetration of the PE into the sample. Thus, the acceleration voltage should be properly adjusted to acquire the surface information of the sample.
j-krcp-21-270f1.jpg
Figure 2.

Schematic illustrations of the methodological fundamentals of serial block-face (SBF)-scanning electron microscopy (SEM), focused ion beam (FIB)-SEM, and array tomography.

(A) SBF-SEM. An ultramicrotome is installed in the SEM, and an ultrathin section is cut with a diamond knife. Then imaging with backscattered electrons (BSE) is performed. The process is repeated automatically to obtain images serially. (B) FIB-SEM. An FIB emitter is installed in the SEM, and thin slicing (milling) is performed. The surface characteristics are detected by BSE and imaged by SEM. The milling and imaging processes are performed automatically and serially. Because of the restricted area of the ion beam current, the sample size is limited to the smallest size of the three methods, and the milling slice is the thinnest among the three methods. (C) Array tomography. Serial sections are cut by a stationary diamond knife attached at the edge of a water-filled boat and are mounted in an array on a supporting substrate. The substrate is usually made of electron-conducting tape, a glass slide, or a silicon wafer. Recently, automatic sectioning or imaging equipment has been developed that combines with SEM.
j-krcp-21-270f2.jpg
Figure 3.

Three-dimensional (3D) configuration of the glomerular structure by serial block-face (SBF)-scanning electron microscopy (SEM).

A resin-embedded kidney biopsy sample of a patient with lupus nephritis was cut to a thickness of 80 nm, and 550 slices were serially imaged by SEM. Consecutive images of 225 slices (19 μm thick) were analyzed by segmentation (coloring) of the podocytes, mesangial cells, and glomerular basement membranes (GBMs), and then reconstructed into a 3D image. (A, B) SBF-SEM showing the podocyte infolding into the GBM and mesangial matrix (black arrow in A and red square in B). (C) 3D Reconstruction showing the podocyte (yellow) infolding deeply into the GBM and mesangial matrix (green) surrounding the mesangial cells (blue).
Reprinted from the article of Takaki et al. (Clin Exp Nephrol 2019;23:773-781) [8] with original copyright holder’s permission.
j-krcp-21-270f3.jpg
Figure 4.

Low-vacuum scanning electron microscopy (LVSEM) images of paraffin-embedded sections.

(A) Normal rat glomerulus (×3,000) and (B) human glomerulus of membranous nephropathy (×1,500; inset, ×4,000). (A) A normal rat kidney was fixed with 2.5% glutaraldehyde and embedded in paraffin. The section was cut into 4-μm-thick slices and mounted on a glass slide. After deparaffinization, the section was stained with uranyl acetate and lead citrate by immersion. LVSEM observation was performed using a FlexSEM-1000 (30 Pa, 15 kV acceleration voltage, detected by backscattered electrons [BSE]; Hitachi Hitech, Tokyo, Japan). The three-dimensional (3D) ultrastructure of the podocyte (PD) foot process (FP) could be observed along with the cut surface of the mesangial cells (MCs) and matrix. (B) A frozen section of kidney biopsy obtained from a patient with membranous nephropathy was first used for immunofluorescent examination and then fixed with formalin, stained with periodic acid methenamine silver, and observed by LVSEM using a TM-3000 (30 Pa, 15 kV acceleration voltage, detected by BSE; Hitachi Hitech). The glomerular basement membrane (GBM) stained with silver was brightly apparent, whereas the cellular components of the glomerulus were not depicted because of a lack of silver staining. Close observation of the GBM revealed numerous small pores or craters formed in the GBM, which represented the presence of immune complex deposits in membranous nephropathy (white bar in inset, 2 μm). By LVSEM, 3D observation of the glomerular structures (e.g., GBM) can be easily performed using routine kidney biopsy samples in frozen or formalin-fixed paraffin-embedded sections, when heavy metal staining (e.g., silver or uranium/lead) is used.
ED, endothelial cell; PEC, parietal epithelial cell; RBC, red blood cell.
j-krcp-21-270f4.jpg
Figure 5.

Correlative light and electron microscopy (CLEM) images of neutrophil extracellular traps (NETs) and fibrin fibrils of a lung from a human autopsy.

(A) Lung tissues from an autopsy of legionnaire’s pneumonia, fixed with formalin and embedded in paraffin, were examined with immunofluorescent imaging to reveal fibrinogen gamma chain (FGG) in red, lactoferrin (LF) in green, and nucleic acid (DAPI) in blue, which were observed by confocal laser scanning microscopy (CLSM, LSM710; Carl Zeiss, Oberkochen, Germany). (B) The same region of the same section was observed and imaged by scanning electron microscopy (SEM, S-4000; Hitachi Hitech, Tokyo, Japan). (C) Both images were merged. NETs are observed as a cluster of globular materials containing LF (blue) and nuclear materials containing DAPI (blue). Simultaneously, thick fibrous bundles are formed as a cluster of fine fibrin filaments containing FGG (red). Thus, the CLEM image demonstrated the ultrastructural changes of NETs and fibrin where fibrin filaments were attached and intermingled with globular materials in the legionnaire’s pneumonia lung of the autopsied patient. Scale bars = 5 μm.
Reprinted from the article of Onouchi et al. (Acta Histochem Cytochem 2016;49:141-147) [31] with original copyright holder’s permission.
j-krcp-21-270f5.jpg
Figure 6.

Schematic illustration of the detection system in scanning transmission electron microscopy (STEM).

In STEM, an emitted electron beam permeates through the sample and hits a reflection plate located under the sample. After that, the signal is generated as secondary electrons (SE) and is detected by an ultra variable detector (UVD) with scanning electron microscopy. Some SE are generated from the sample surface and also detected by the UVD. Because the sample is thicker, noise signals are easily generated both from the sample and the reflection plate, increasing the signal-to-noise ratio and interfering with clear imaging. Therefore, a novel scintillation holder is installed under the sample, which enables an increase in the STEM signal and improves the detection of UVD.
j-krcp-21-270f6.jpg
Figure 7.

Scanning transmission electron microscopy (STEM) images of kidney biopsy samples obtained from a patient with lupus nephritis (A, B; ×8,000) and amyloidosis (C, D; ×50,000).

The original STEM image (A, C) detected by backscattered electrons (BSE) is the opposite of the transmission electron microscopy (TEM) image in black-and-white color. Therefore, a color conversion is required to obtain a TEM-like image (B, D). STEM technology enables the performance of high-resolution analysis comparable to TEM by using SEM installed with a novel scintillation holder to reduce noise for clearer imaging. The images were taken by a SU-5000 (30 kV acceleration voltage; Hitachi Hitech, Tokyo, Japan) and detected by BSE.
j-krcp-21-270f7.jpg
Table 1.
Comparison of three-dimensional ultrastructure analysis techniques by SEM
Variable SBF-SEM FIB-SEM Array tomography (ultramicrotome + SEM)
Fully automated data acquisition Yes Yes No (partly possible for cutting or imaging)
Sections preserved for post-processing and “random-access” imaging (re-imaging) No No Yes
The maximal size of the sample (x × y) 500 × 500 μm2 20 × 20 μm2 3 × 3 mm2
Minimal sectioning/milling thickness ≥25 nm ≥5 nm ≥30 nm
Metal staining for EM pre-embedding (en bloc) pre-embedding (en bloc) pre-embedding (en bloc) and/or post-sectioning
Immunostaining for LM pre-embedding (en bloc) pre-embedding (en bloc) pre-embedding (en bloc) and/or post-sectioning
Problems specific to each technique Slice debris, surface charging, sensitivity to electron dose Redeposition of vaporized materials Wrinkled sections, occasional section damage or loss
The acquisition time and dataset size for different volumes (μm3)
 10 × 10 × 10 2 hours, 0.4 GB 39 hours, 8 GB 23 hours, 37 GB
 20 × 20 × 20 4 hours, 3.2 GB 10 days, 8 GB 2 days, 30 GB
 50 × 50 × 50 22 hours, 50 GB 4 months, 1 TB 6 days, 460 GB
 100 × 100 × 100 5 days, 400 GB not available 15 days, 3.7 TB
Cost for set-up ++ +++ +
Cost for maintenance ++ +++ +

EM, electron microscopy; FIB, focused ion beam; LM, light microscopy; SBF, serial block-face; SEM, scanning electron microscopy.

Quoted with modification in part from the article of Titze and Genoud (Biol Cell 2016;108:307-323) [4].

References

1. Richards RG, ap Gwynn I. A novel method for viewing heavy metal stained and embedded biological tissue by field emission scanning electron microscopy. Scanning Microsc 1996;10:111–119.
pmid
2. Koga D, Kusumi S, Watanabe T. Backscattered electron imaging of resin-embedded sections. Microscopy (Oxf) 2018;67:196–206.
crossref
3. Briggman KL, Bock DD. Volume electron microscopy for neuronal circuit reconstruction. Curr Opin Neurobiol 2012;22:154–161.
crossref pmid
4. Titze B, Genoud C. Volume scanning electron microscopy for imaging biological ultrastructure. Biol Cell 2016;108:307–323.
crossref pmid
5. Kubota Y, Sohn J, Kawaguchi Y. Large volume electron microscopy and neural microcircuit analysis. Front Neural Circuits 2018;12:98.
crossref pmid pmc
6. Ichimura K, Miyazaki N, Sadayama S, et al. Three-dimensional architecture of podocytes revealed by block-face scanning electron microscopy. Sci Rep 2015;5:8993.
crossref pmid pmc
7. Randles MJ, Collinson S, Starborg T, et al. Three-dimensional electron microscopy reveals the evolution of glomerular barrier injury. Sci Rep 2016;6:35068.
crossref pmid pmc
8. Takaki T, Ohno N, Saitoh S, Nagai M, Joh K. Podocyte penetration of the glomerular basement membrane to contact on the mesangial cell at the lesion of mesangial interposition in lupus nephritis: a three-dimensional analysis by serial block-face scanning electron microscopy. Clin Exp Nephrol 2019;23:773–781.
crossref pmid
9. Nagai M, Saitoh S, Takaki T, et al. Glomerular cellular interactions following disruption of the glomerular basement membrane in IgA nephropathy: ultrastructural analyses by 3-dimensional serial block-face scanning electron microscopy. Kidney Med 2020;2:222–225.
crossref pmid pmc
10. Ichimura K, Kakuta S, Kawasaki Y, et al. Morphological process of podocyte development revealed by block-face scanning electron microscopy. J Cell Sci 2017;130:132–142.
crossref pmid
11. Ichimura K, Miyaki T, Kawasaki Y, Kinoshita M, Kakuta S, Sakai T. Morphological processes of foot process effacement in puromycin aminonucleoside nephrosis revealed by FIB/SEM tomography. J Am Soc Nephrol 2019;30:96–108.
crossref pmid
12. Miyaki T, Kawasaki Y, Hosoyamada Y, et al. Three-dimensional imaging of podocyte ultrastructure using FE-SEM and FIB-SEM tomography. Cell Tissue Res 2020;379:245–254.
crossref pmid
13. Micheva KD, Smith SJ. Array tomography: a new tool for imaging the molecular architecture and ultrastructure of neural circuits. Neuron 2007;55:25–36.
crossref pmid pmc
14. Koike T, Kataoka Y, Maeda M, et al. A device for ribbon collection for array tomography with scanning electron microscopy. Acta Histochem Cytochem 2017;50:135–140.
crossref pmid pmc
15. Kubota Y, Sohn J, Hatada S, et al. A carbon nanotube tape for serial-section electron microscopy of brain ultrastructure. Nat Commun 2018;9:437.
crossref pmid pmc
16. Wacker I, Schroeder RR. Array tomography. J Microsc 2013;252:93–99.
crossref pmid
17. Inaga S, Hirashima S, Tanaka K, et al. Low vacuum scanning electron microscopy for paraffin sections utilizing the differential stainability of cells and tissues with platinum blue. Arch Histol Cytol 2009;72:101–106.
crossref pmid
18. Inaga S, Kato M, Hirashima S, et al. Rapid three-dimensional analysis of renal biopsy sections by low vacuum scanning electron microscopy. Arch Histol Cytol 2010;73:113–125.
crossref pmid
19. Miyazaki H, Uozaki H, Tojo A, et al. Application of low-vacuum scanning electron microscopy for renal biopsy specimens. Pathol Res Pract 2012;208:503–509.
crossref pmid
20. Okada S, Inaga S, Kitamoto K, et al. Morphological diagnosis of Alport syndrome and thin basement membrane nephropathy by low vacuum scanning electron microscopy. Biomed Res 2014;35:345–350.
crossref pmid
21. Okada S, Inaga S, Kawaba Y, et al. A novel approach to the histological diagnosis of pediatric nephrotic syndrome by low vacuum scanning electron microscopy. Biomed Res 2014;35:227–236.
crossref pmid
22. Masuda Y, Yamanaka N, Ishikawa A, et al. Glomerular basement membrane injuries in IgA nephropathy evaluated by double immunostaining for α5(IV) and α2(IV) chains of type IV collagen and low-vacuum scanning electron microscopy. Clin Exp Nephrol 2015;19:427–435.
crossref pmid
23. Yokoyama H, Okada S, Yamada Y, et al. Low-vacuum scanning electron microscopy may allow early diagnosis of human renal transplant antibody-mediated rejection. Biomed Res 2020;41:81–90.
crossref pmid
24. Onishi H, Oguchi H, Shinoda K, et al. Pathological analysis of early transplant glomerulopathy in renal allografts using low-vacuum scanning electron microscopy. Nephron 2020;144(Suppl 1):71–78.
crossref pmid
25. Sawaguchi A, Kamimura T, Yamashita A, et al. Informative three-dimensional survey of cell/tissue architectures in thick paraffin sections by simple low-vacuum scanning electron microscopy. Sci Rep 2018;8:7479.
crossref pmid pmc
26. Mukai S, Takaki T, Nagumo T, et al. Three-dimensional electron microscopy for endothelial glycocalyx observation using Alcian blue with silver enhancement. Med Mol Morphol 2021;54:95–107.
crossref pmid
27. Sjollema KA, Schnell U, Kuipers J, Kalicharan R, Giepmans BN. Correlated light microscopy and electron microscopy. Methods Cell Biol 2012;111:157–173.
crossref pmid
28. Gibson KH, Vorkel D, Meissner J, Verbavatz JM. Fluorescing the electron: strategies in correlative experimental design. Methods Cell Biol 2014;124:23–54.
pmid
29. Takizawa T, Robinson JM. FluoroNanogold is a bifunctional immunoprobe for correlative fluorescence and electron microscopy. J Histochem Cytochem 2000;48:481–486.
crossref pmid
30. Koga D, Kusumi S, Shodo R, Dan Y, Ushiki T. High-resolution imaging by scanning electron microscopy of semithin sections in correlation with light microscopy. Microscopy (Oxf) 2015;64:387–394.
crossref pmid
31. Onouchi T, Shiogama K, Mizutani Y, Takaki T, Tsutsumi Y. Visualization of neutrophil extracellular traps and fibrin meshwork in human fibrinopurulent inflammatory lesions: III. Correlative light and electron microscopic study. Acta Histochem Cytochem 2016;49:141–147.
crossref pmid pmc
32. Shibata N, Kohno Y, Findlay SD, Sawada H, Kondo Y, Ikuhara Y. New area detector for atomic-resolution scanning transmission electron microscopy. J Electron Microsc (Tokyo) 2010;59:473–479.
crossref pmid
33. Aoyama K, Takagi T, Hirase A, Miyazawa A. STEM tomography for thick biological specimens. Ultramicroscopy 2008;109:70–80.
crossref pmid
34. Hosoya K, Dan Y, Muto A. Development of STEM imaging in SEM using photon detector. Microsc Microanal 2019;25(Suppl 2):552–553.
crossref
TOOLS
METRICS Graph View
  • 4 Web of Science
  • 3 Crossref
  • 4 Scopus
  • 10,229 View
  • 127 Download
ORCID iDs

Kazuho Honda
https://orcid.org/0000-0003-4179-8832

Takashi Takaki
https://orcid.org/0000-0003-2498-5505

Dedong Kang
https://orcid.org/0000-0002-2474-8609

Related articles


ABOUT
BROWSE ARTICLES
EDITORIAL POLICY
FOR CONTRIBUTORS
Editorial Office
#301, (Miseung Bldg.) 23, Apgujenog-ro 30-gil, Gangnam-gu, Seoul 06022, Korea
Tel: +82-2-3486-8736    Fax: +82-2-3486-8737    E-mail: registry@ksn.or.kr                

Copyright © 2024 by The Korean Society of Nephrology.

Developed in M2PI

Close layer