


Introduction
The incidence rate of new-onset diabetes mellitus (DM) after kidney transplantation (KT) at 12 months posttransplant is 20% to 50%. DM after transplantation is associated with increased risks of graft rejection, infection, cardiovascular disease, and death [1–3]. Multiple risk factors have been implicated in DM development. Non-modifiable risk factors for new-onset DM include older age; African American, Hispanic, or South Asian ethnicity; genetic background; positive family history of DM; polycystic kidney disease; and previously diagnosed glucose intolerance. Modifiable risk factors for new-onset DM after KT include obesity; metabolic syndrome; hepatitis C virus or cytomegalovirus infection; and therapy with corticosteroids, calcineurin-inhibitor drugs (especially tacrolimus [Tac]), or sirolimus [4].
Induced pluripotent stem cell (iPSC) technology has been developed to differentiate iPSCs into almost any organ-specific cell type. This technology may enable the generation of disease-relevant tissues from patients in scalable quantities. The use of patient-derived iPSCs has helped in the research of pathophysiological mechanisms of various diseases. The iPSC-derived organs and organoids are also currently being evaluated in regenerative therapy, which is proceeding toward clinical trials, and disease modeling, which facilitates drug-screening efforts for discovering novel therapeutics [5,6].
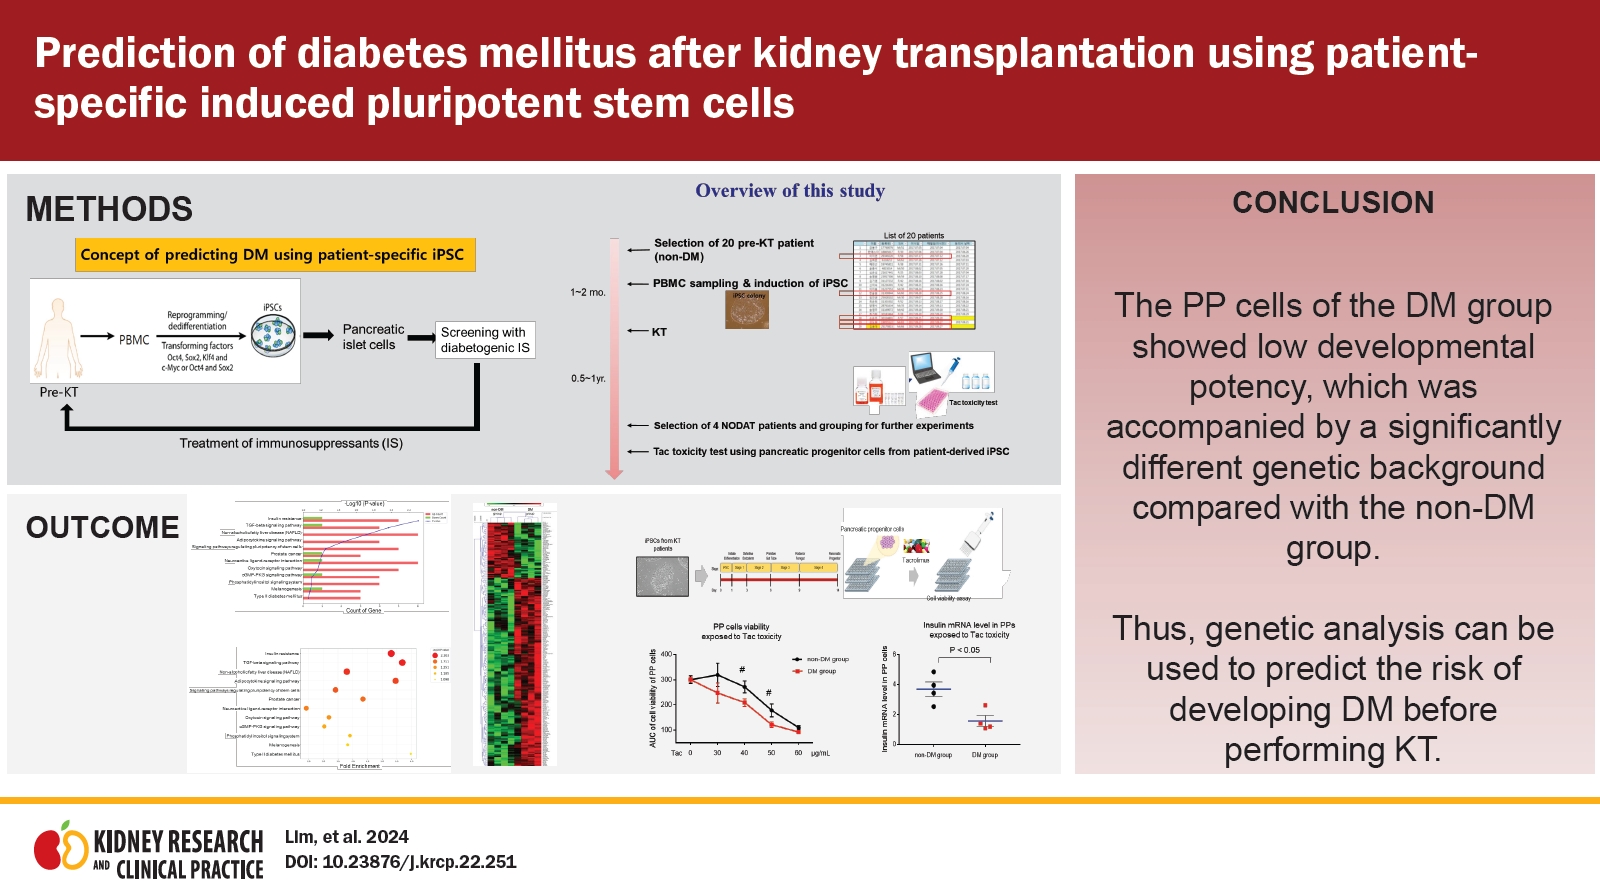
Therefore, we designed this study to investigate the feasibility of a novel DM prediction model involving patient iPSC cells. We reprogrammed patient-specific iPSCs from peripheral blood mononuclear cells (PBMCs) before performing KT. At approximately 1 year after KT, we compared the genetic differences between the DM and non-DM groups by RNA-sequencing analysis to reveal genetic links with insufficient pancreatic beta cell function or maturation.
Pancreatic progenitor (PP) cells, which are multipotent cells with the potential to develop into endocrine, exocrine, or epithelial cells, provide a powerful model system for examining the molecular characteristics of differentiating fetal-like pancreatic cells and for genetic analysis of pancreatic disease [7–9]. Therefore, we next compared the differentiation potential of PP cells between the DM and non-DM groups by evaluating the morphology and differentiation of marker expression.
To determine whether the DM group after KT is likely to be susceptible to immunosuppressive agents, we also tested cell viability and insulin expression of PP cells from the DM and non-DM groups during Tac-induced toxicity. Our results showed that the PP cells of the DM group showed low developmental potency accompanied by a significantly different genetic background compared with the non-DM group. We expect that the results of our study will provide a rationale for prediction of the risk of DM after KT.
Methods
Study population
The Institutional Review Board of The Catholic University of Korea, Seoul St. Mary’s Hospital approved this study (No. KC16TISI0774). Formal informed consent was obtained from the patients. We recruited pre-KT patients (n = 20) who had never been treated with anti-DM medication and who had provided PBMCs for experiments. Among the 20 patients, five were diagnosed with DM at 1 year after KT; we selected matched patients with DM (n = 4) and non-DM individuals (n = 4) based on the clinical index (Supplementary Table 1, 2; available online).
Induced pluripotent stem cell differentiation
The iPSCs from four patients with DM and four non-DM individuals were generated using PBMCs, as previously described [10]. Briefly, PBMCs were cultured for 4 days at 37 °C in an incubator with 5% CO2 in StemSpan medium (09650; STEMCELL Technologies), which includes StemSpan CC100 (02690; STEMCELL Technologies), to expand CD34-positive cells. The expanded PBMCs were transfected using the CytoTune-iPS Sendai Reprogramming Kit (A16517; Life Technologies), which includes the Yamanaka factors (Oct4, Sox2, KLF4, and c-Myc). PBMCs were induced to form iPSCs via centrifugation; the resultant attached cells were expanded and purified by colony picking.
Pancreatic progenitor cell differentiation
Human iPSCs were subcultured in dishes coated with Matrigel (354277; Corning Life Sciences) at 37 °C in an incubator with 5% CO2. Fresh mTeSR1 medium (05850; STEMCELL Technologies) was used as the culture medium and was replaced daily. The iPSCs were split using trypsin-ethylenediaminetetraacetic acid (TE) (15400054; Life Technologies) at 70% confluence, and 10 μM of a rho-associated kinase inhibitor (1254; TOCRIS Bioscience) was added to the newly passaged cells. The STEMdiff PP kit (05120; STEMCELL Technologies) provided the culture medium for differentiation into PP cells.
Cell Counting Kit-8 assay
The iPSC-derived PP cells were differentiated in 96-well microplates for the Cell Counting Kit-8 (CCK-8) assay. After differentiation, the cells were subjected to various Tac treatments for specified durations. CCK-8 solution (CK04-01; Dojindo Molecular Technologies) was added to each well for 2 hours. Absorbance was measured at 450 nm using a VersaMax ELISA Reader (Molecular Devices).
Quantitative real-time-polymerase chain reaction
RNA was extracted from iPSCs or PP cells using RNA-Bee (CD-105B; Tel-Test), as per the manufacturer’s instructions. First-strand complementary DNA was synthesized and subjected to quantitative real-time polymerase chain reaction (qRT-PCR) using SYBR Green Master Mix (DYRT1200; Dyne Bio Inc.) in a LightCycler 480 system (Roche). Target gene expression was normalized to that of glyceraldehyde 3-phosphate dehydrogenase (GAPDH) using the change-in-threshold method. Primer sequences are listed in Supplementary Table 3 (available online).
Flow cytometry
The iPSCs or iPSC-derived PP cells were dissociated using TE (15400054). The cells were washed twice with FACS buffer (phosphate-buffered saline [PBS] containing 1% bovine serum albumin and 10-mM sodium azide), permeabilized for 30 minutes using flow cytometry fixation and permeabilization solution (554714; BD Biosciences), washed with wash buffer, stained with anti-OCT3/4 (60093AD.1; STEMCELL Technologies) and anti-insulin (565689; BD Biosciences) antibodies for 1 hour each, and then washed with FACS buffer. Samples were analyzed using a BD LSRFortessa cell analyzer (BD Biosciences). Data were analyzed using the FlowJo V10 Single Cell Analysis Software (TreeStar Inc.).
Suspension culture of pancreatic progenitor cells
For further maturation of PP cells, suspension culture was performed as previously described [11]. PP cells were treated with 5 mg/mL dispase (07913; STEMCELL Technologies) for 5 minutes, followed by gentle pipetting to obtain cell clumps (<100 µm). The cell clusters were transferred into a polystyrene 125 mL Spinner Flask (3152; Corning Life Sciences) and spun at 80 to 100 rpm overnight in suspension with DMEM-HG (10-017-CV; Corning Life Science) supplemented with 1-μmol/L ALK5 inhibitor II (ALX-270-445-M005; Enzo Life Sciences), 100-ng/mL Noggin (6057-NG-100; R&D Systems), and 1% B27 (17504077; Life Technologies).
Immunofluorescence staining
Cell clusters were obtained in 1.5 mL tubes after suspension culture for insulin staining. The cell clusters were then incubated with 4% paraformaldehyde for 15 minutes at 4 °C and washed three times in PBS at room temperature (RT). Cells were then incubated with 0.1% Triton X-100 for 10 minutes and 10% normal donkey serum for 1 hour at RT. Samples were then incubated with primary antibodies, anti-insulin (18-0067; Invitrogen), anti-OCT3/4 (5279; Santa Cruz Biotechnology), anti-SOX2 (365823; Santa Cruz Biotechnology), and anti-SSEA4 (MAB4304; Millipore Sigma) antibodies, at 4 °C overnight. The following day, cells were incubated with a secondary Cyanine3 (Jackson ImmunoResearch)-conjugated antibody for 2 hours at RT. Cells were then stained with 4′,6-diamidine-2-phenylindole (DAPI; Vector Laboratories) for nucleic acid staining. Images were obtained using a Zeiss LSM700 confocal microscope (Carl Zeiss MicroImaging GmbH).
Electron microscopy
PP cells were fixed in 2.5% glutaraldehyde, 0.1 M phosphate buffer, and 1% OSO4 and then embedded in Epon 812. Ultrathin sections were cut, stained with uranyl acetate/lead citrate, and photographed under a JEM-1200EX transmission electron microscope (JEOL Ltd.). The sections were randomly scanned at 20 spots per sample at 5,000× magnification.
Library preparation and sequencing
For control and test RNAs, library construction was performed using the QuantSeq 3’ mRNA-Seq Library Prep Kit (Lexogen, Inc.), according to the manufacturer’s instructions. In brief, total RNA samples (500 ng each) were prepared; an oligo-dT primer containing an Illumina-compatible sequence at its 5′ end was hybridized to the RNA and reverse transcribed. After RNA template degradation, second-strand synthesis was initiated by a random primer containing an Illumina-compatible linker sequence at its 5′ end. The double-stranded library was purified using magnetic beads to remove all reaction components. The library was amplified to add the complete adapter sequences required for cluster generation. The final library was purified from the PCR components. High-throughput sequencing was performed as single-end 75-bp sequencing using a NextSeq 500 system (Illumina, Inc.).
Data analysis
QuantSeq 3’ mRNA-Seq reads were aligned using Bowtie2 [12]. Bowtie2 indices were either generated from the genome assembly sequence or representative transcript sequences for alignment to the genome and transcriptome. The alignment file was used for assembling transcripts, estimating their abundance, and detecting differential gene expression. Differentially expressed genes (DEGs) were identified on the basis of counts from unique and multiple alignments using coverage in BEDtools [13]. The read count data were processed on the basis of the TMM + CPM normalization method with EdgeR within R (R Development Core Team, 2020) using Bioconductor [14]. Gene classification was based on searches performed in the DAVID (https://david.ncifcrf.gov/home.jsp) and Medline databases (https://www.ncbi.nlm.nih.gov/).
Statistical analyses
Data are expressed as mean ± standard error of at least three independent experiments. Multiple comparisons between groups were performed by one-way analysis of variance with the Bonferroni post hoc test using the Prism software (version 7.03 for Windows; GraphPad Software). Statistical significance was set at p < 0.05.
Results
Generation of induced pluripotent stem cells from peripheral blood mononuclear cells of pre-kidney transplantation patients
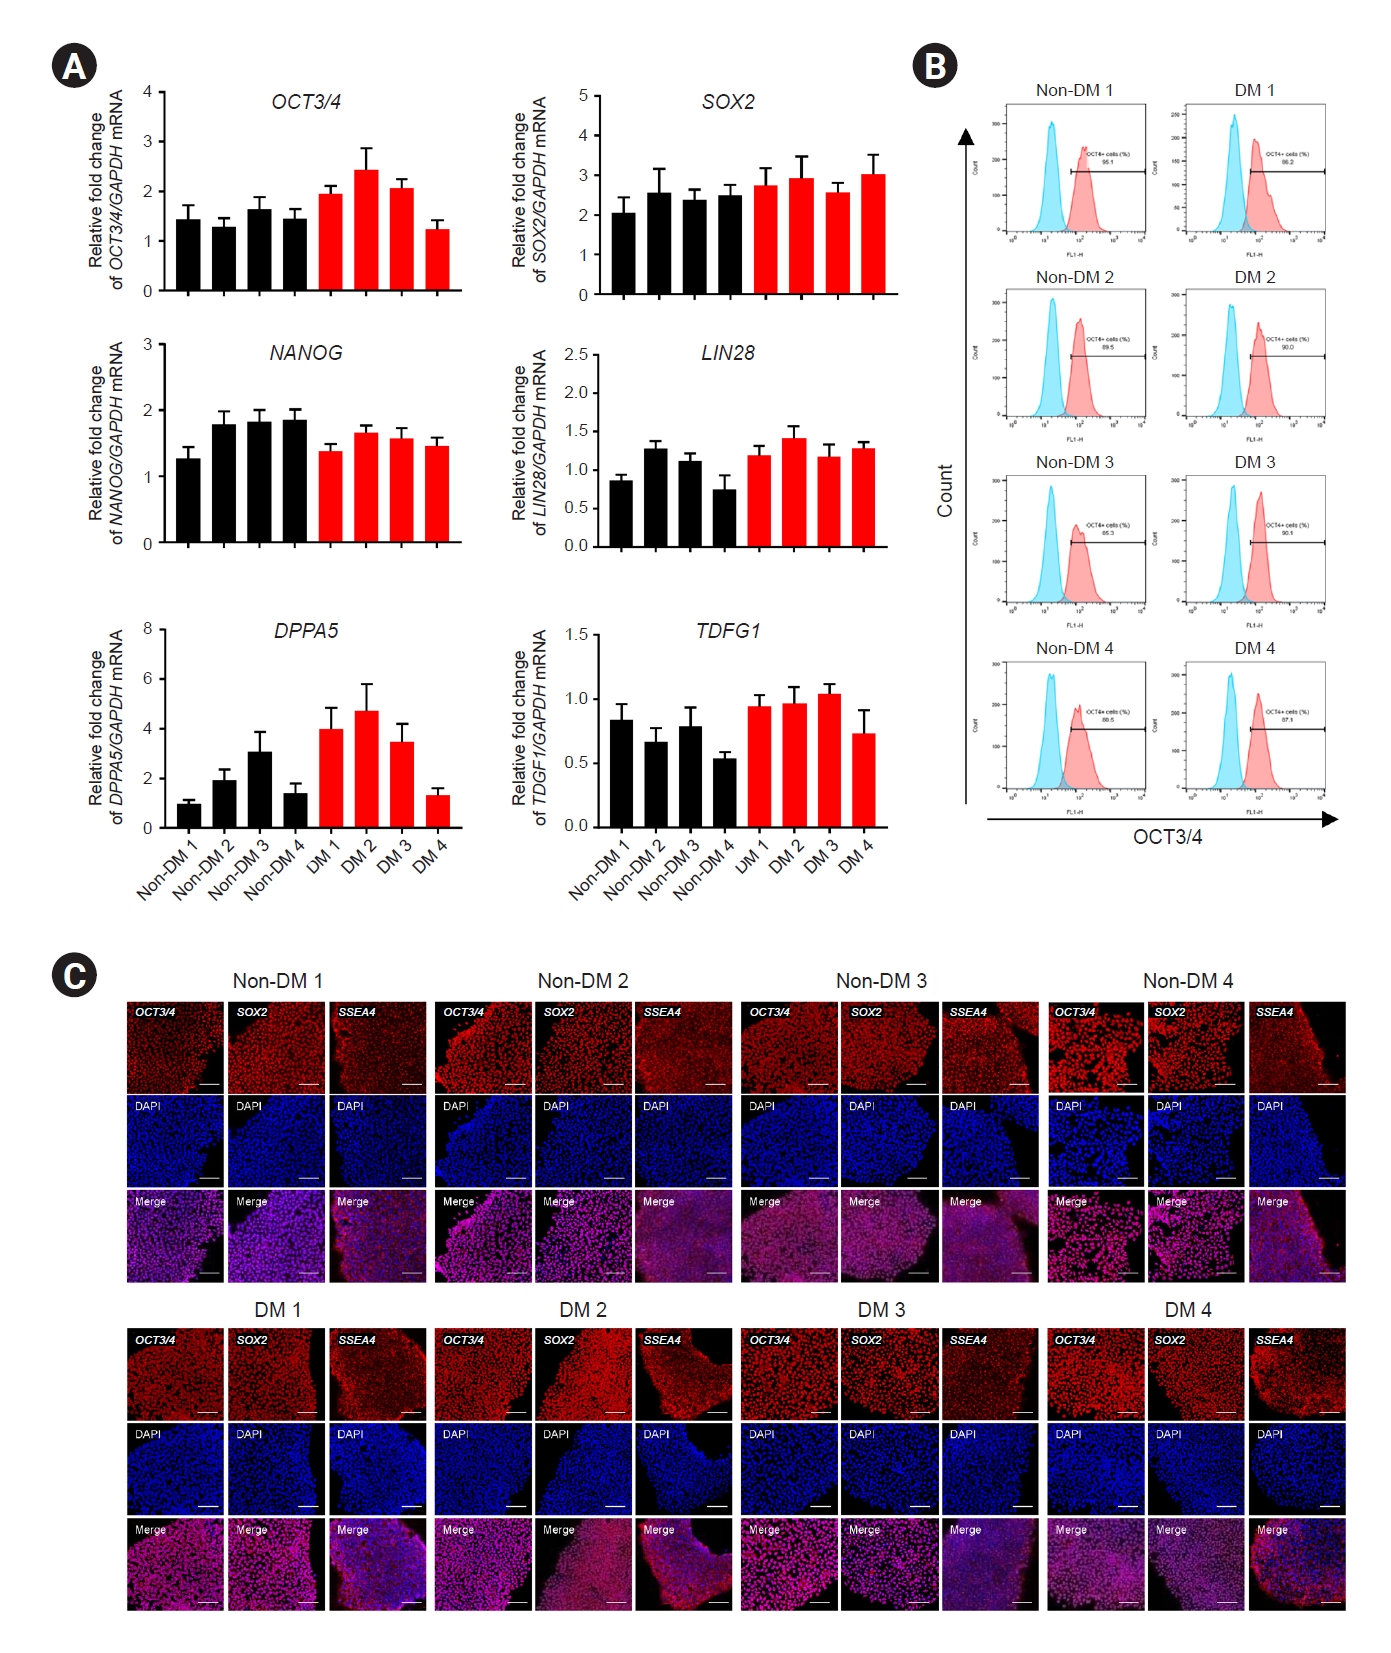
PBMCs were induced to form iPSCs using Sendai viruses expressing Yamanaka factors (Oct4, Sox2, KLF4, and c-Myc). The reprogramming method was based on a previously described protocol involving serial centrifugation [10]. Colonies were generated from somatic cells after approximately 18 days. PCR analysis revealed that iPSCs expressed GAPDH, OCT3/4, SOX2, NANOG, LIN28, DPPA5, and TDGF1 messenger RNAs (mRNAs) (Fig. 1A). Flow cytometry revealed that approximately 90% of the iPSCs were positive for the pluripotency marker OCT3/4 (Fig. 1B). In addition, we confirmed the expression of the pluripotency markers OCT3/4, SOX2, SSEA4, KLF4, TRA-1-61, and TRA-1-81 using immunofluorescence (Fig. 1C; Supplementary Fig. 1A, Supplementary Methods, available online). To confirm that the iPSCs generated were genomically normal, we analyzed their karyotypes using the Giemsa-trypsin-Giemsa banding method. The iPSCs showed a normal karyotype of 44 + XX or 44 + XY, except in the case of DM 3 (trisomy 20) (Supplementary Fig. 1B, Supplementary Methods available online).
Gene and functional enrichment analyses in patient-specific induced pluripotent stem cells of the diabetes mellitus group
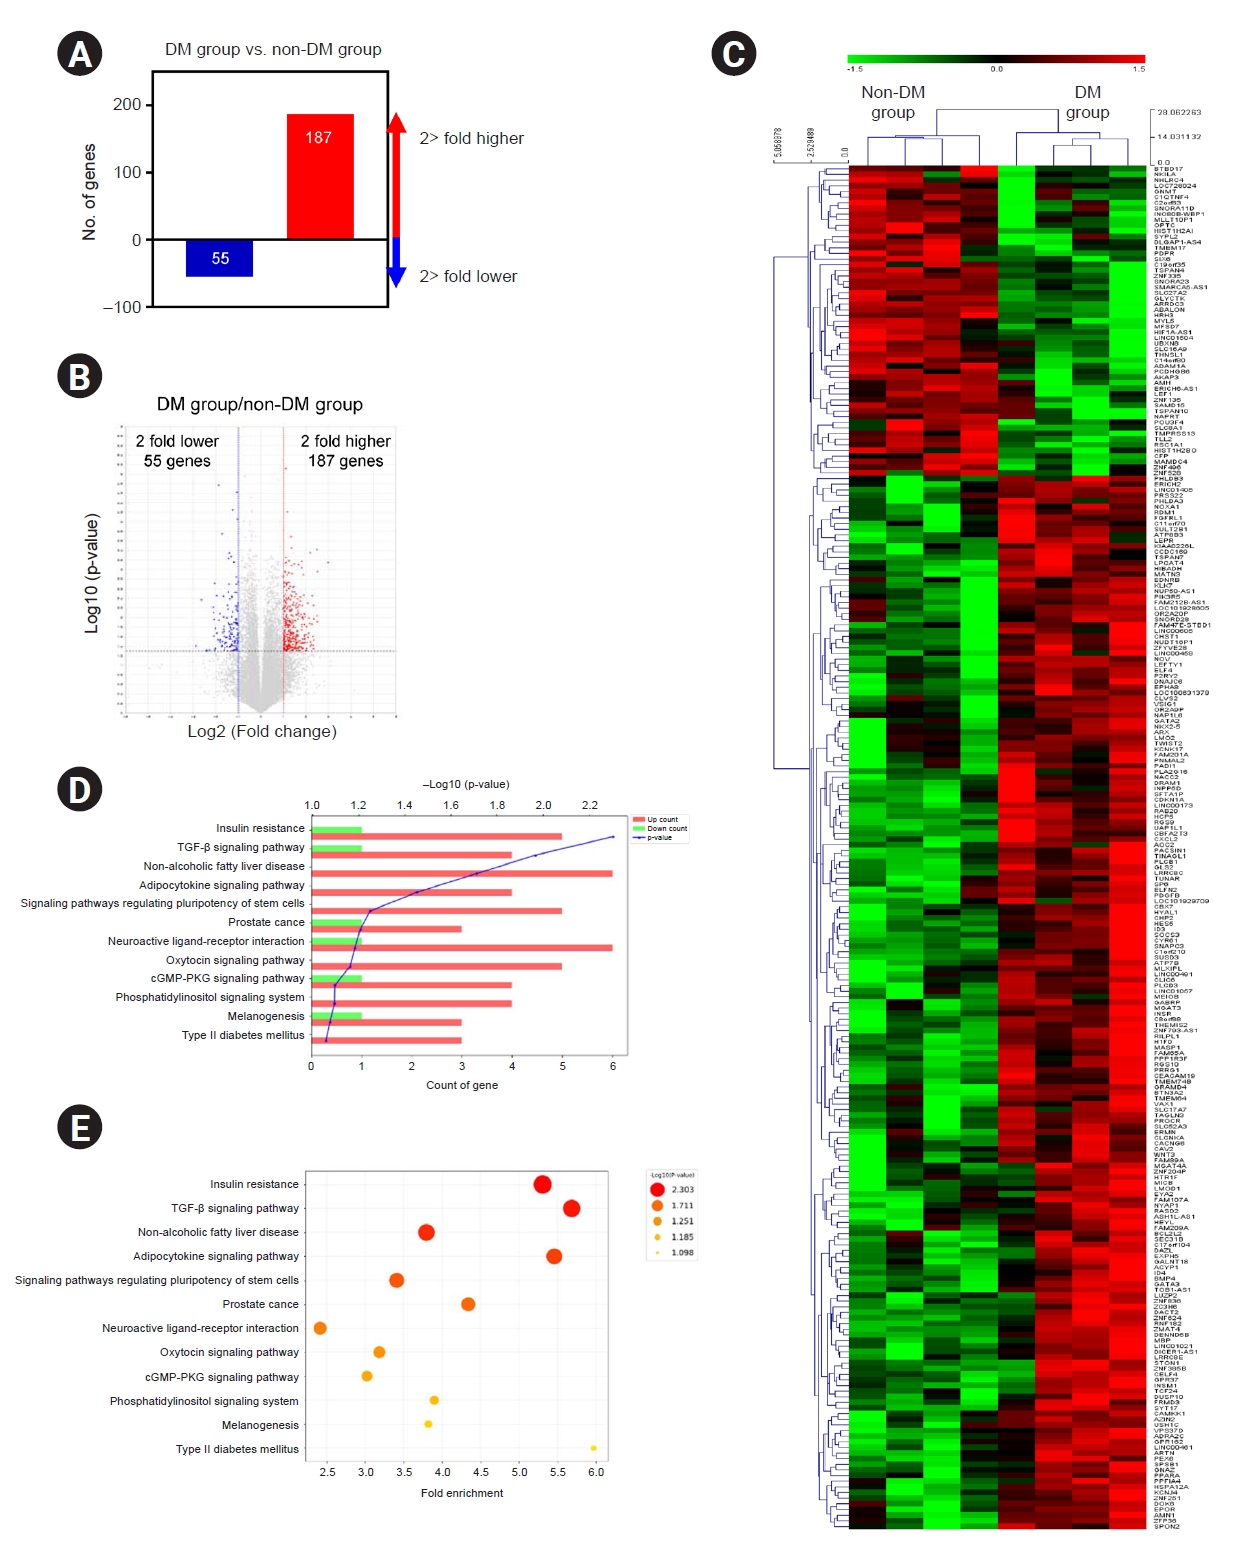
To investigate the differences in the gene expression profiles of patient-specific iPSCs between the DM and non-DM groups, we performed transcriptomic analysis using RNA-seq. RNA-seq analysis was used to identify DEGs on the basis of the DM:non-DM ratio. A total of 242 DEGs with a p-value of <0.05 were identified, of which 187 genes showed two-fold upregulation and 55 genes showed two-fold downregulation (Fig. 2A). A volcano plot of the RNA-seq results illustrating the DEG findings with respect to the DM:non-DM ratio is shown in Fig. 2B. On plotting the hierarchical clustering heat map of all DEGs, we found that most DEGs showed consistently higher or lower expression in individuals with DM (Fig. 2C).
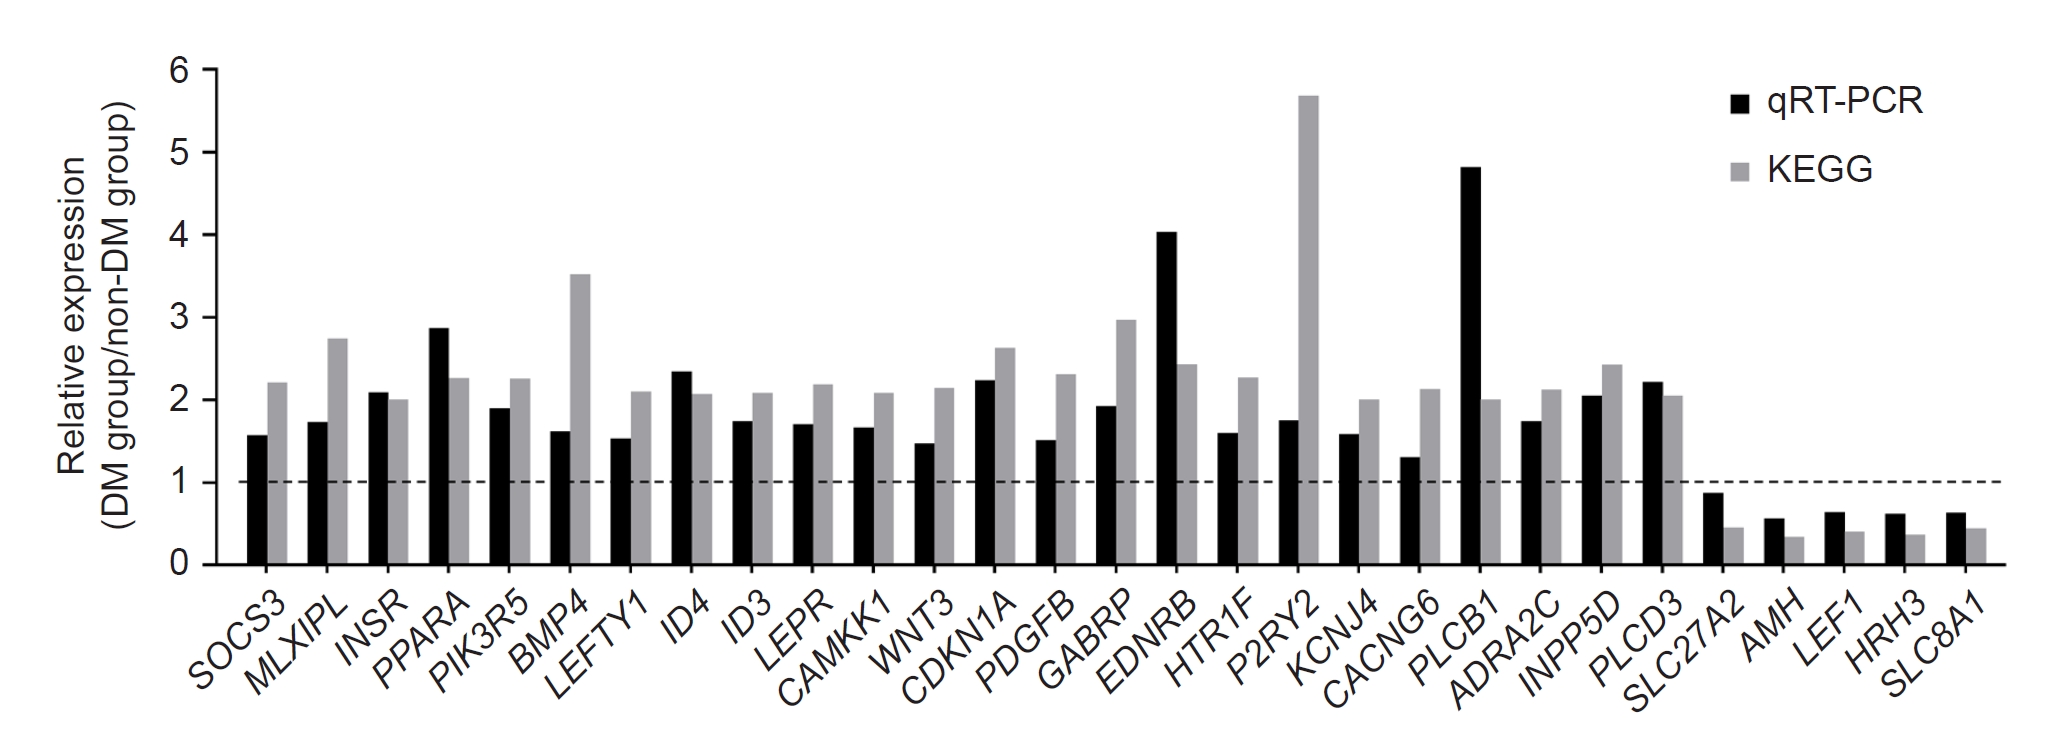
Kyoto Encyclopedia of Genes and Genomes (KEGG) enrichment analysis was performed to predict the potential functions of the DEGs. The top 12 pathways are listed in Fig. 2D and E, and the 29 annotated transcripts pertaining to these pathway terms are indicated in Supplementary Table 4 (available online). Using qRT-PCR, we verified the validity of the annotated transcripts (Fig. 3).
Differentiation of induced pluripotent stem cells into pancreatic progenitor cells
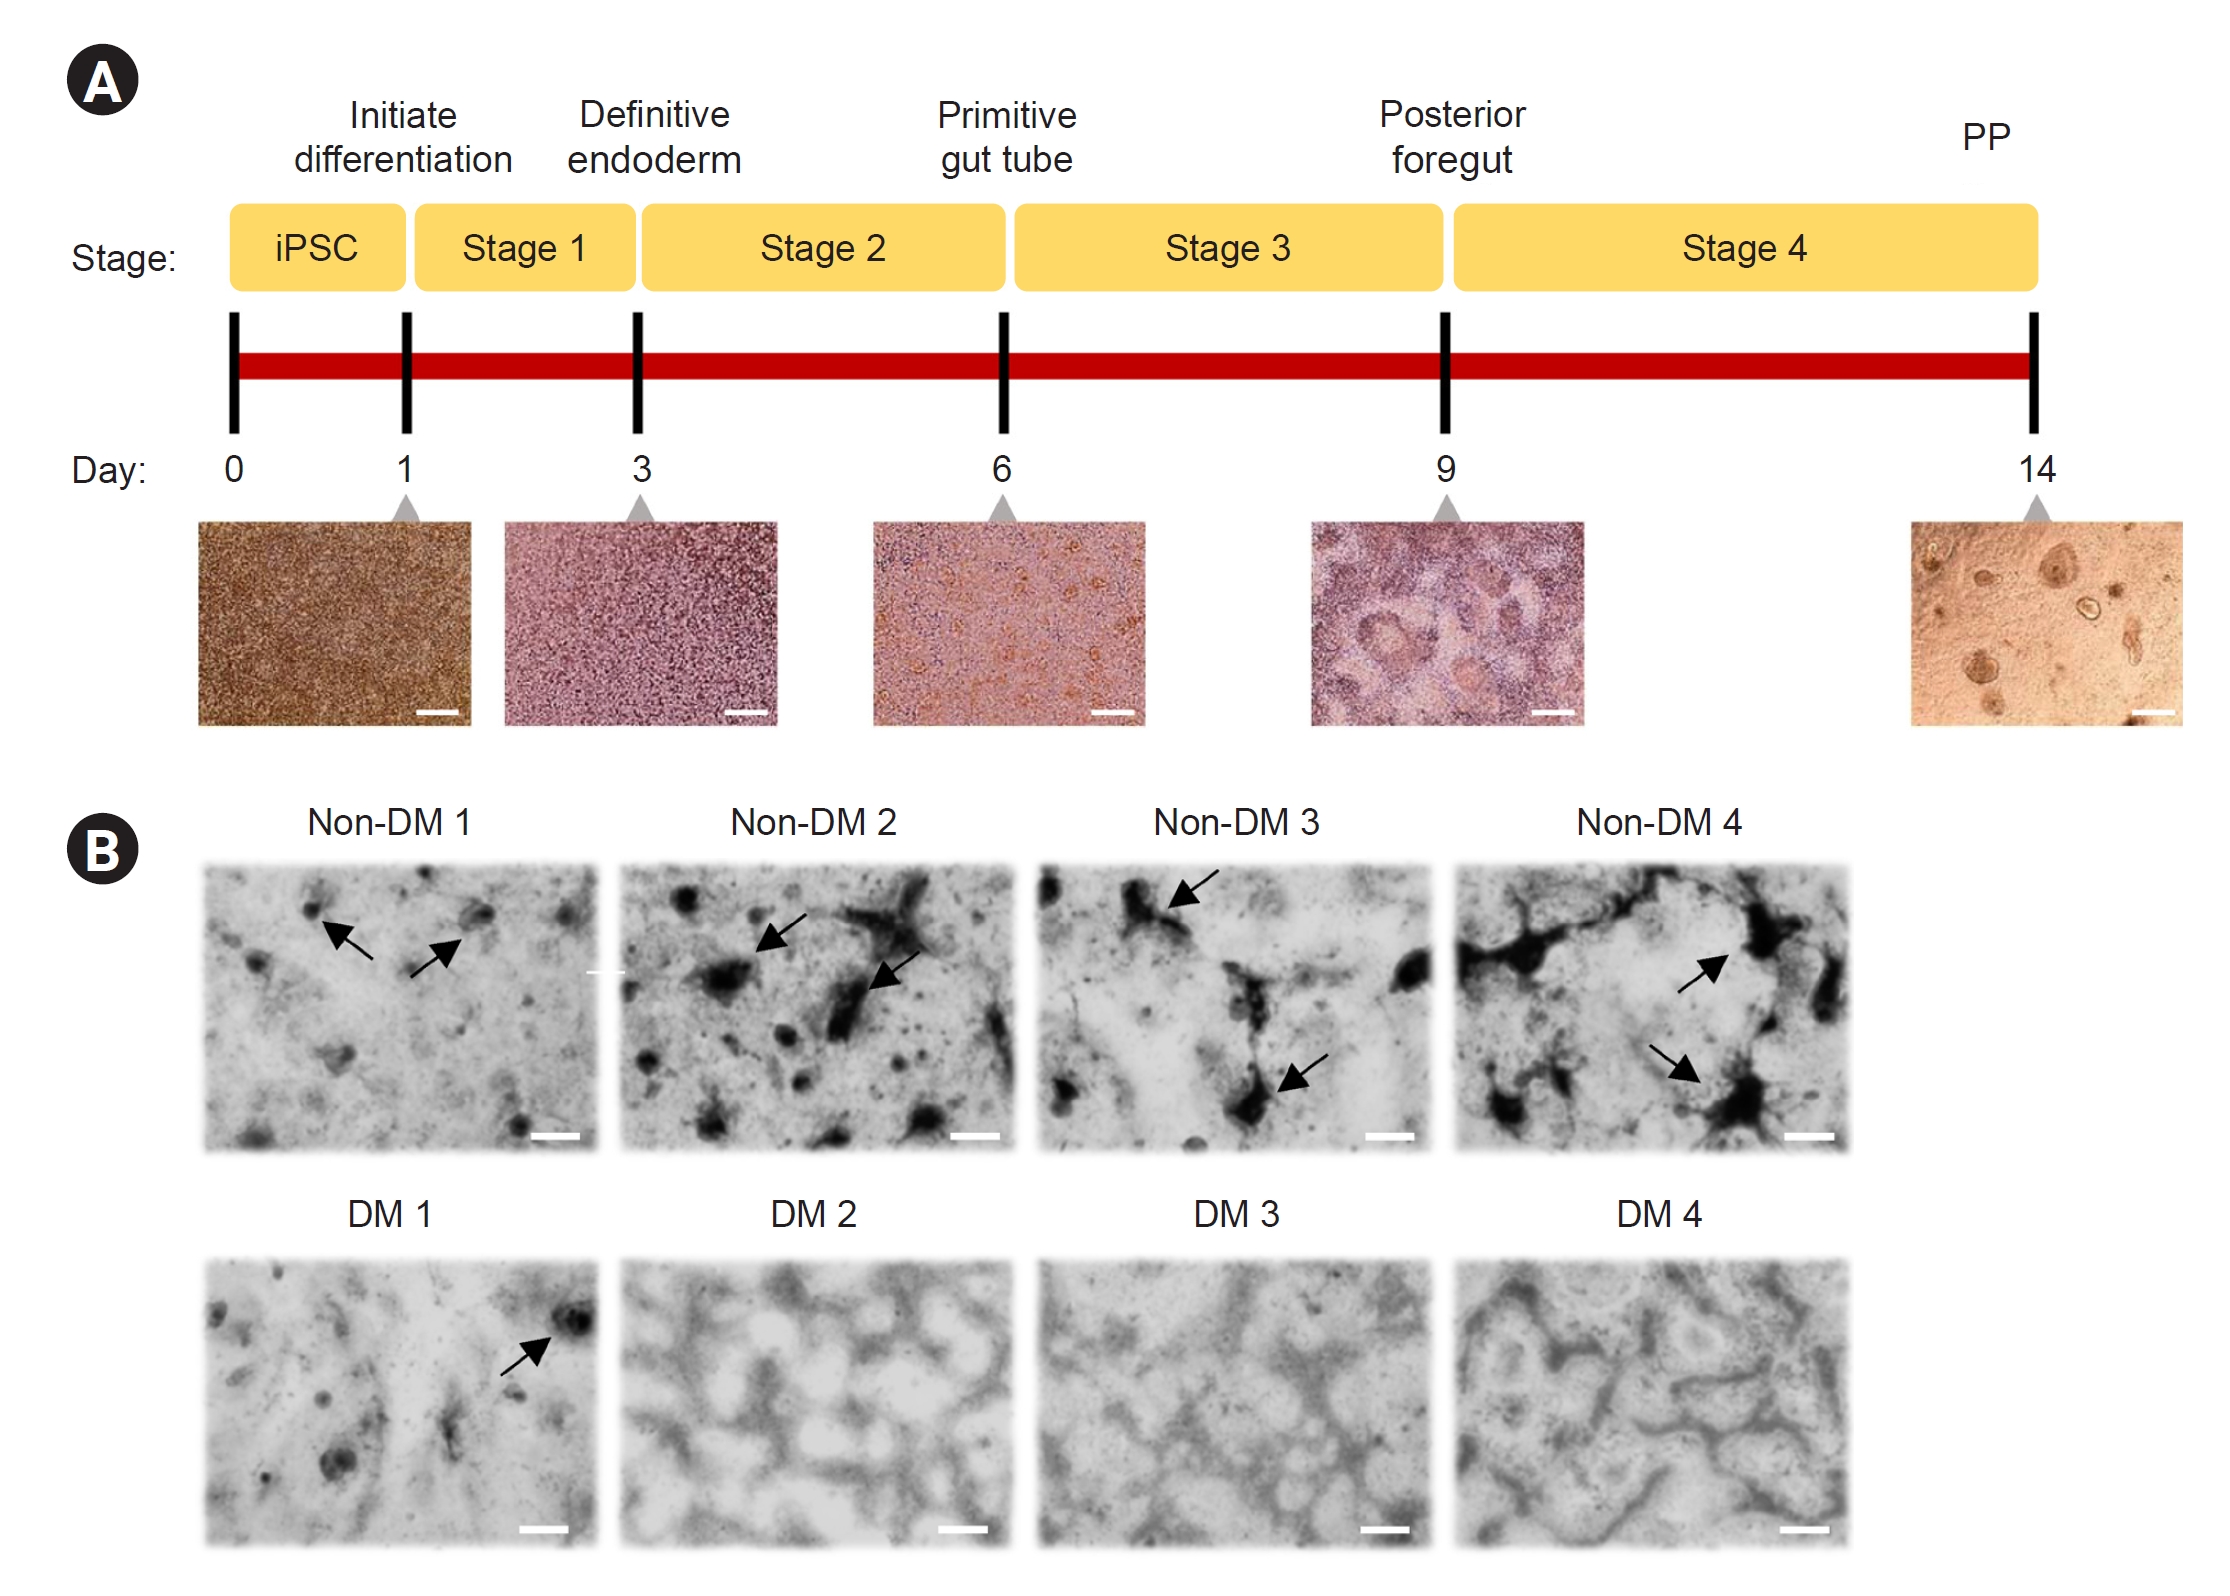
To confirm the differentiation of iPSCs into functional endocrine cells, we used a standardized simple protocol to confirm the expression of key markers, including PDX-1, NKX6.1, and SOX9, because insulin-secreting cells from iPSCs are difficult to cultivate in vitro. The protocol involves four stages over 14 days of PP cell formation (Fig. 4A): definitive endoderm (end stage 1), primitive gut tube (end stage 2), posterior foregut endoderm (end stage 3), and PP cells (end stage 4). Representative images of cell morphological features (cell aggregation in high-density regions) at the end of each differentiation stage are shown in Fig. 4B.
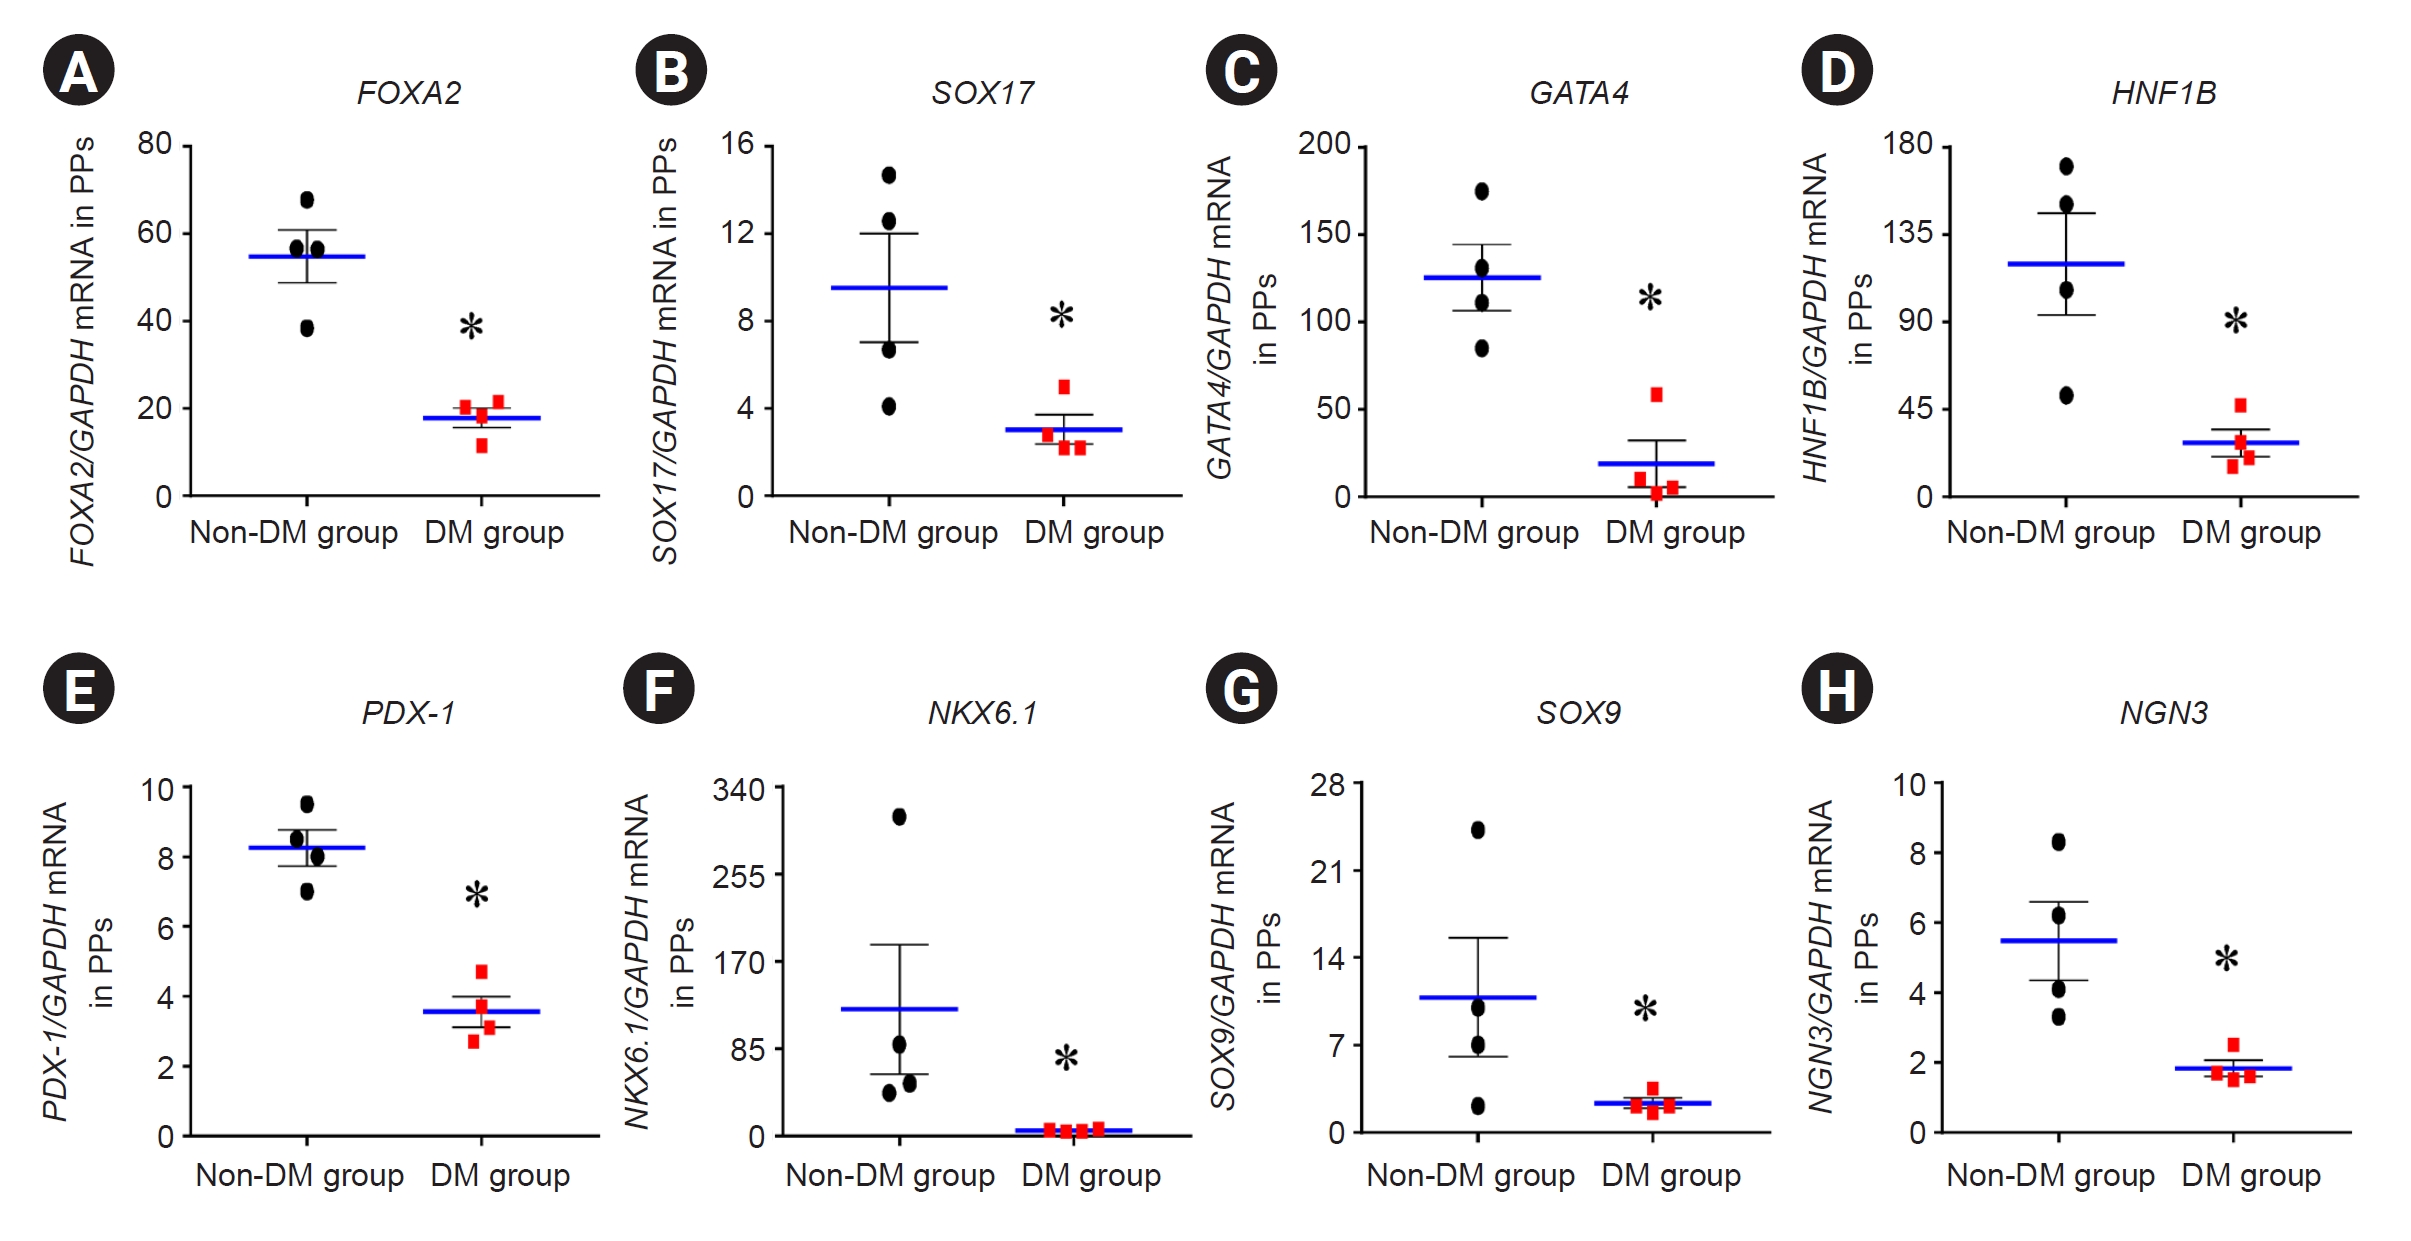
Expression of differentiation markers for pancreatic progenitor cells
We performed qRT-PCR for differentiation markers (FOXA2, SOX17, GATA4, HNF1B, PDX-1, NKX6.1, SOX9, and NGN3) in PP cells in the DM and non-DM groups (Fig. 5). The mRNA expression of these genes in the DM group was significantly lower than that in the non-DM group (Fig. 5) (FOXA2, 17.9 ± 2.2 vs. 54.9 ± 6.1; SOX17, 3.1 ± 0.7 vs. 9.5 ± 2.5; GATA4, 19.0 ± 13.3 vs. 125.4 ± 19.0; HNF1B, 27.8 ± 7.0 vs. 120.0 ± 26.2; PDX-1, 3.6 ± 0.4 vs. 8.3 ± 0.5; NKX6.1, 5.4 ± 0.5 vs. 123.3 ± 63.4; SOX9, 2.3 ± 0.4 vs. 10.8 ± 4.7; and NGN3, 1.8 ± 0.2 vs. 5.5 ± 1.1; p < 0.05 vs. non-DM group in all genes).
Effect of tacrolimus on insulin expression in patient induced pluripotent stem cell-derived pancreatic progenitor cells
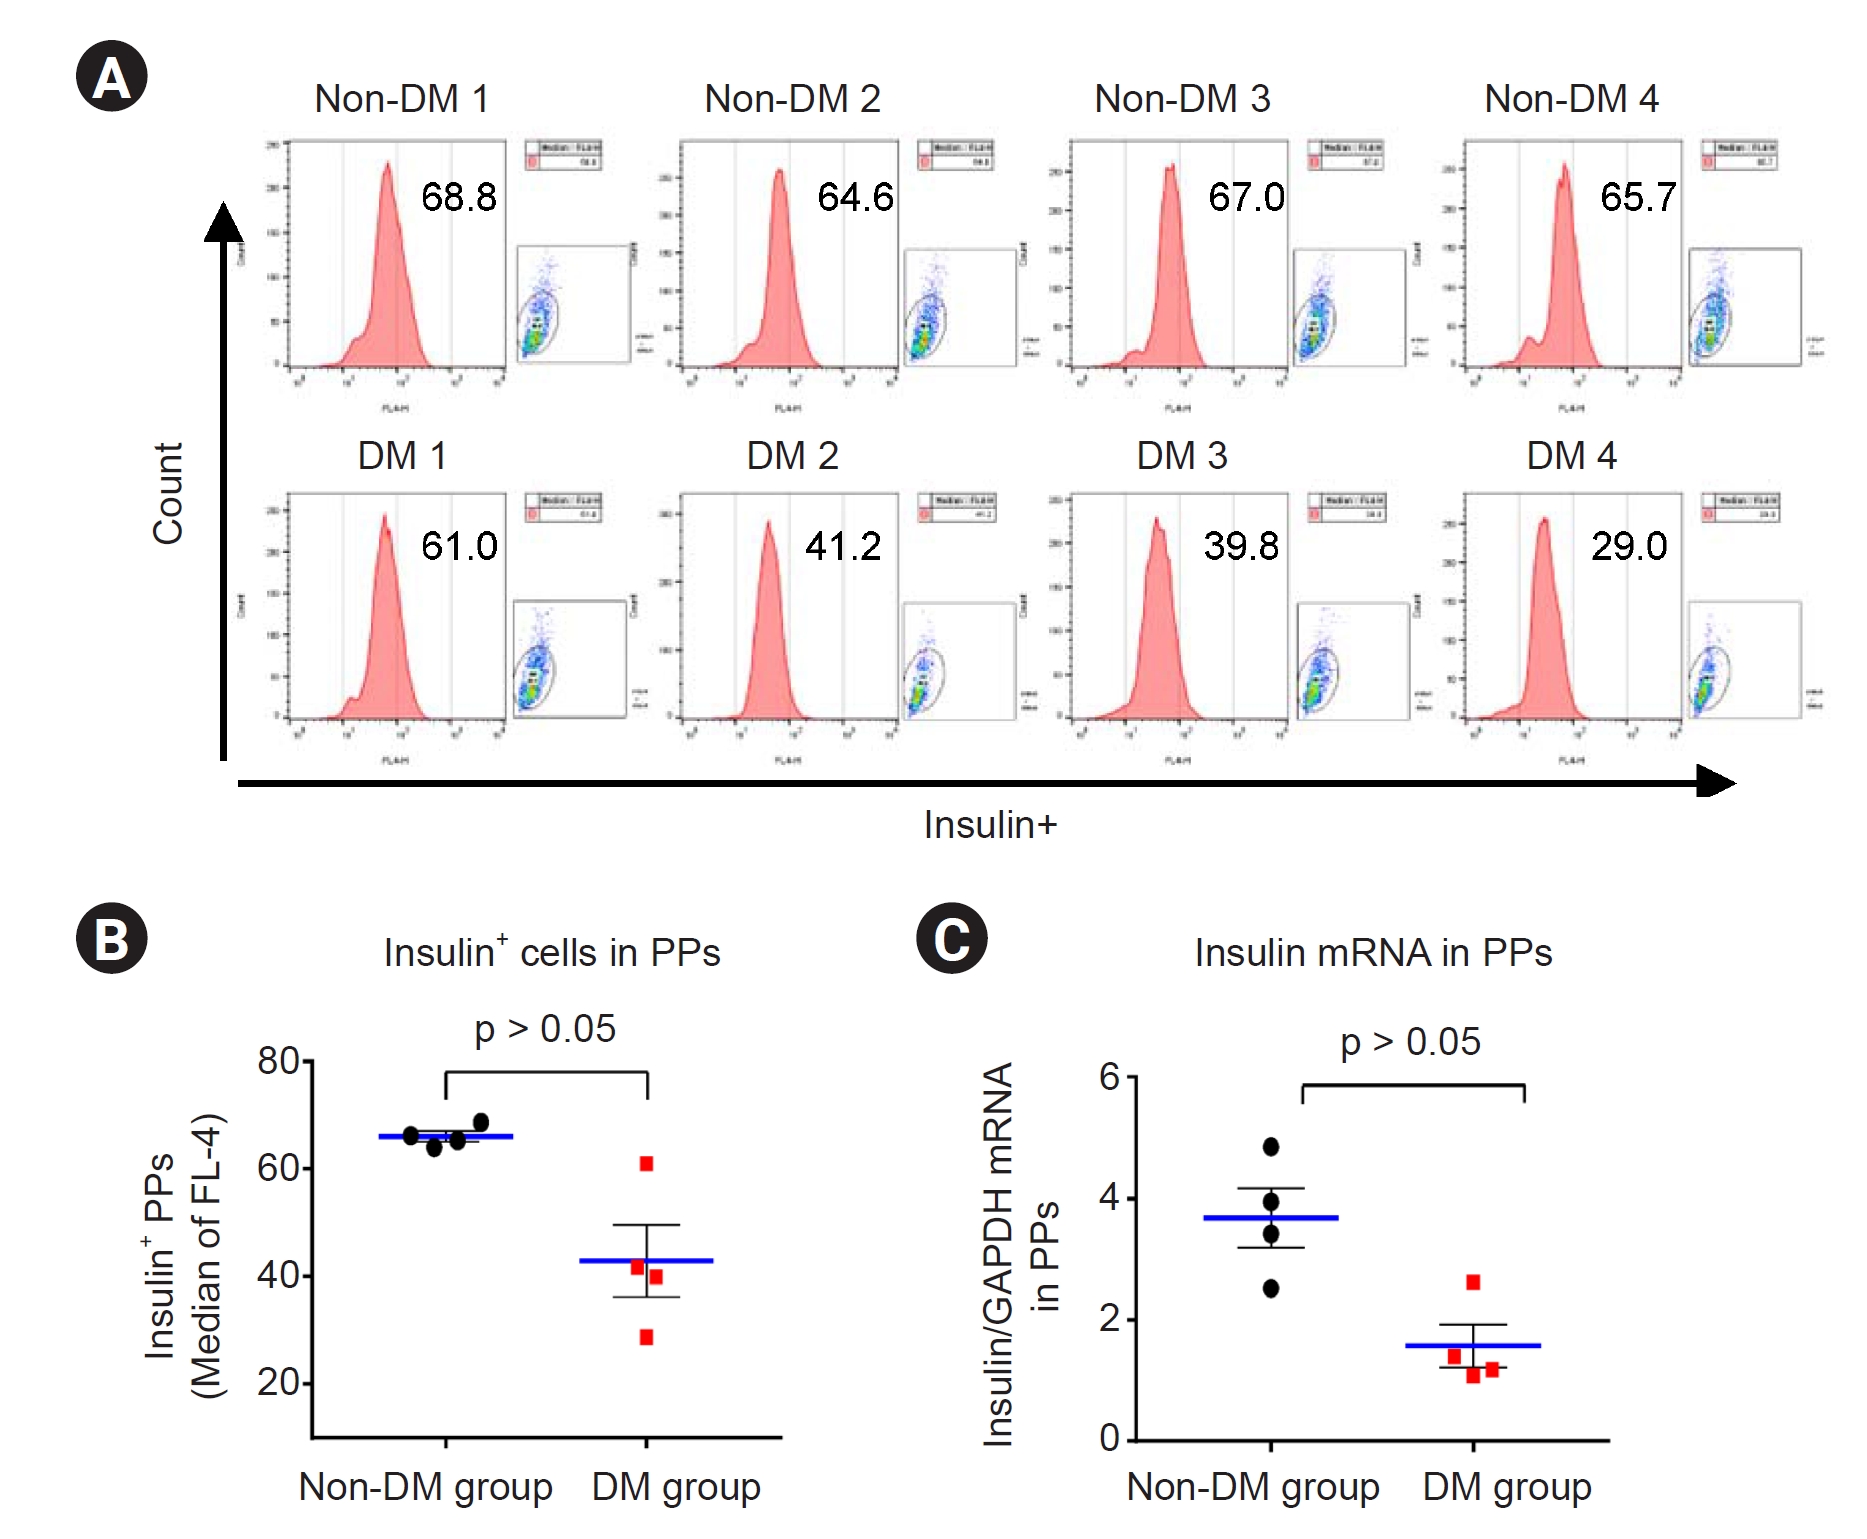
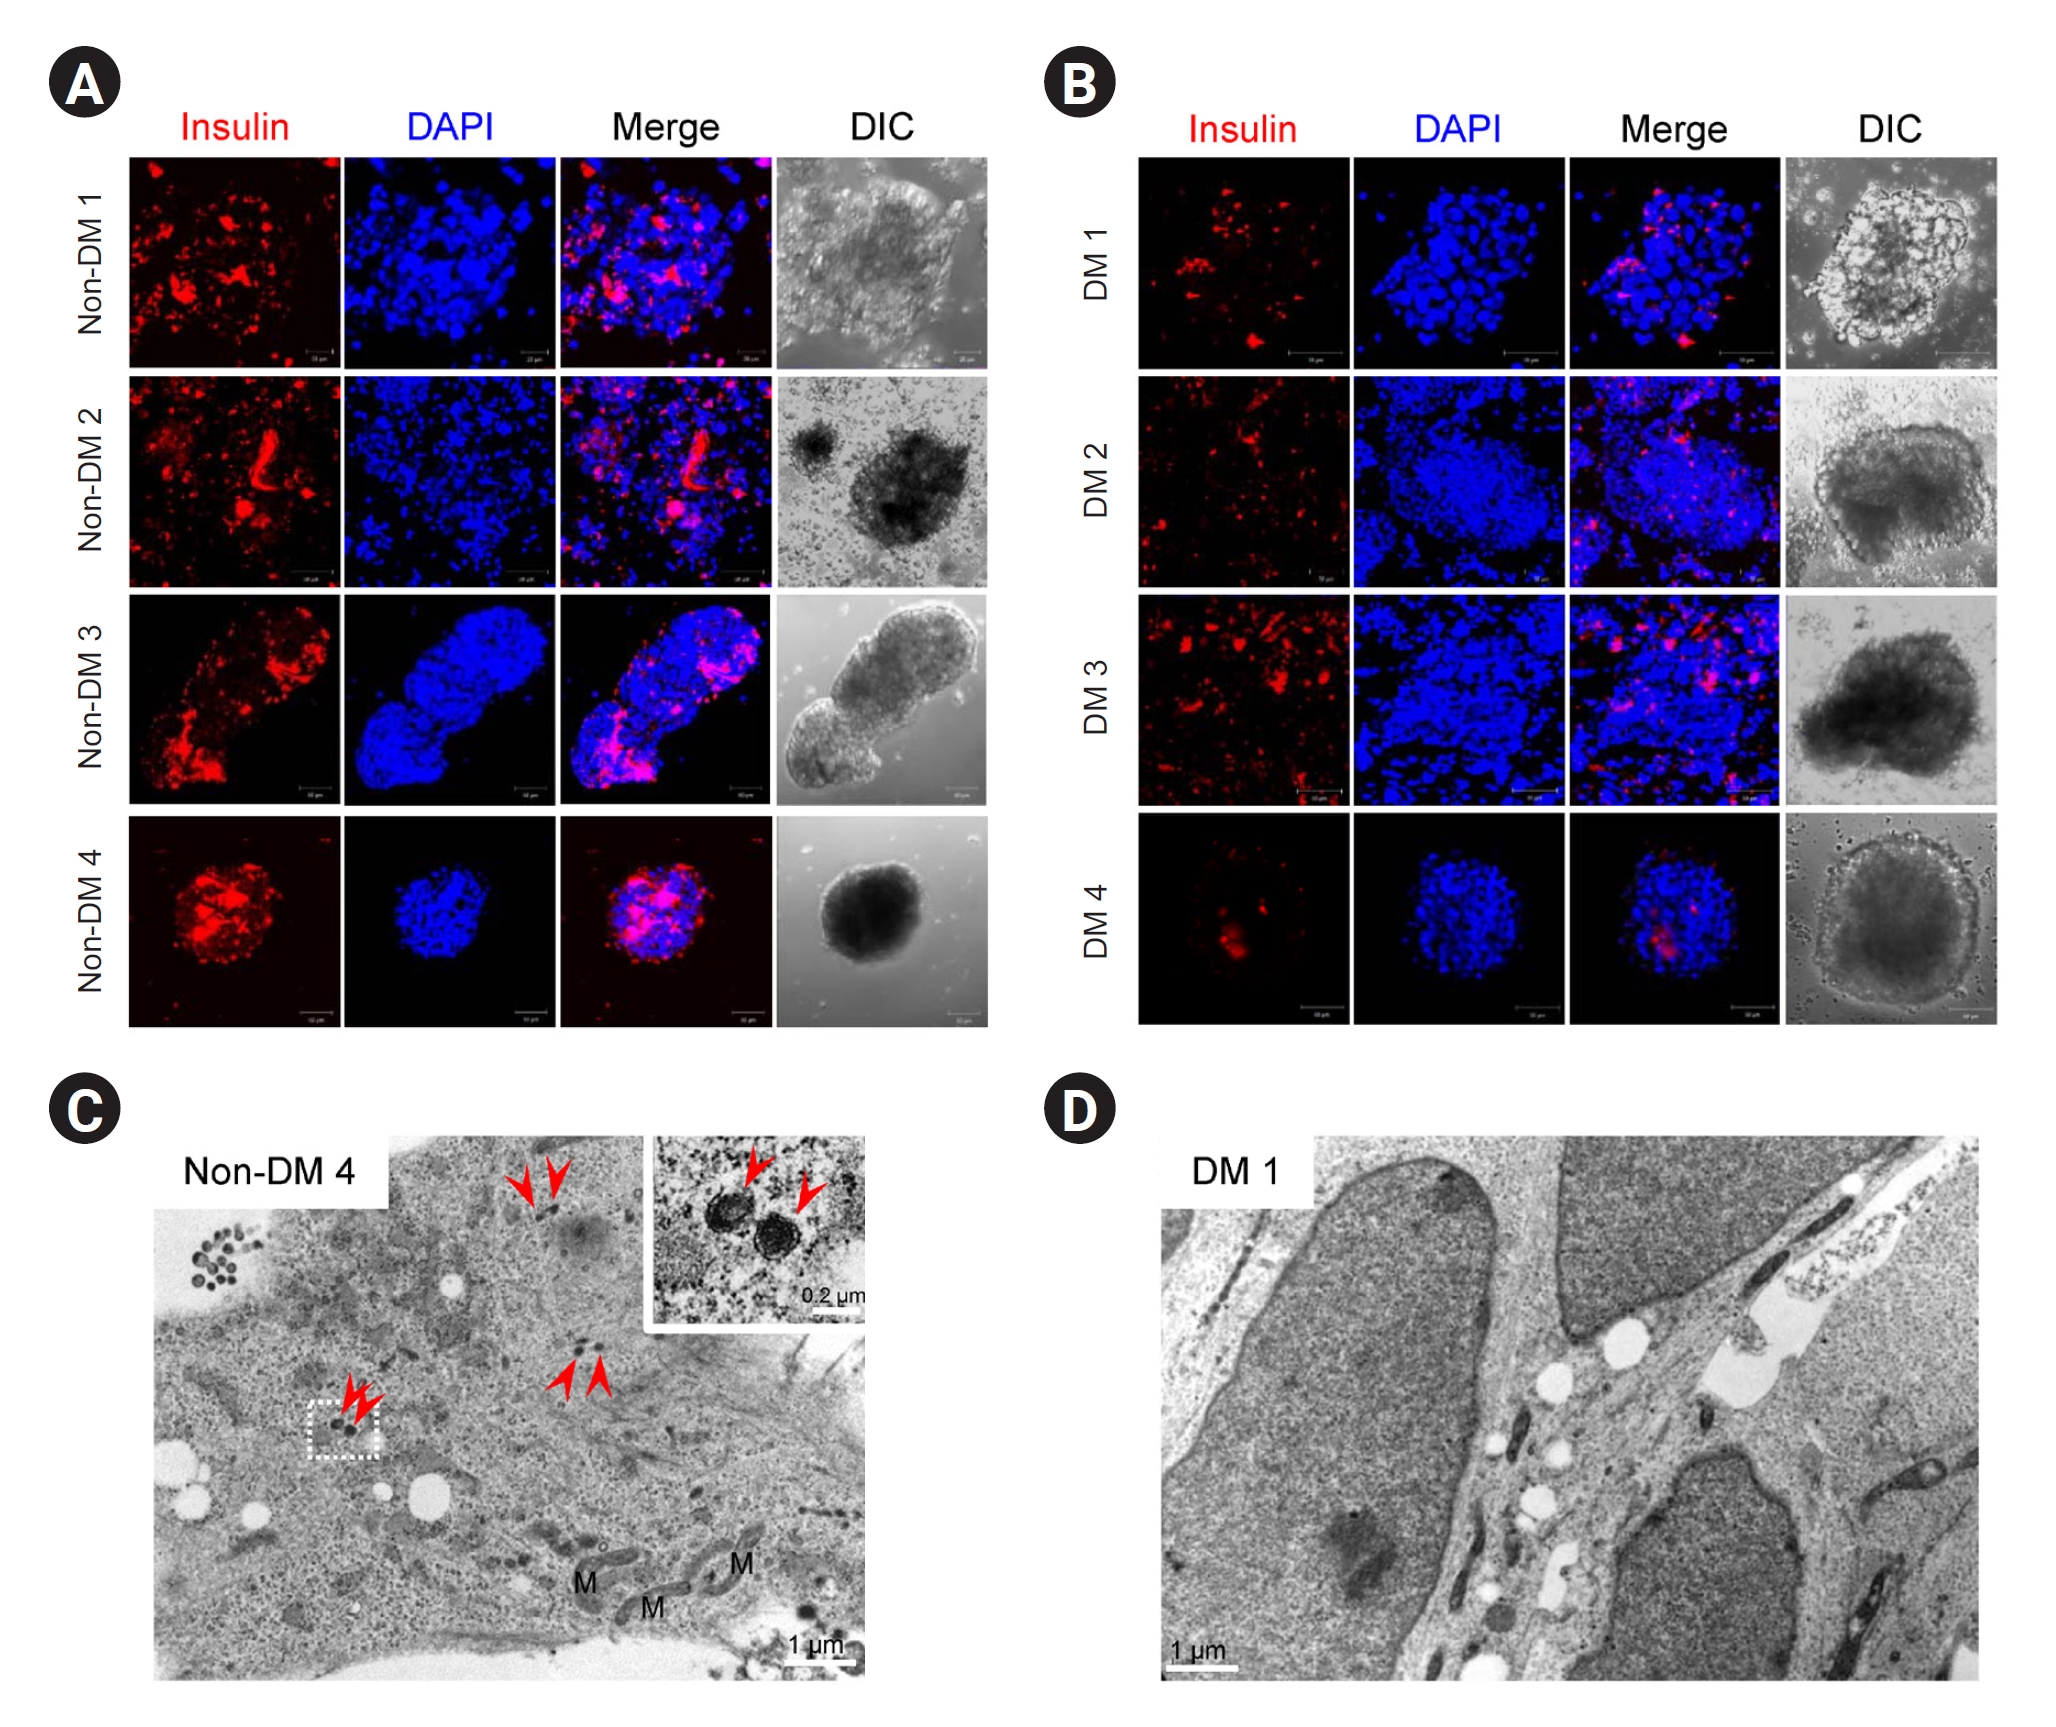
Next, we confirmed the insulin levels in the PP cells from each group. Insulin protein and mRNA expression levels were detected via flow cytometry and qRT-PCR, respectively, in the differentiated PP cells. The results showed significantly lower insulin expression in the DM group than in the non-DM group (flow cytometry: 43 ± 7 vs. 66 ± 1, p < 0.05 vs. non-DM group; qRT-PCR: 1.6 ± 0.4 vs. 3.7 ± 0.5, p < 0.05 vs. non-DM group) (Fig. 6). Suspension cultures were performed for PP cells from each group for further maturation. Immunofluorescence results showed that insulin immunoreactivity was lower in the DM group than in the non-DM group (Fig. 7A, B). Electron microscopy (EM) revealed that insulin granules were present in PP cells in the non-DM group but not in those in the DM group (Fig. 7C, D).
Effect of tacrolimus on cell viability in patient induced pluripotent stem cell-derived pancreatic progenitor cells
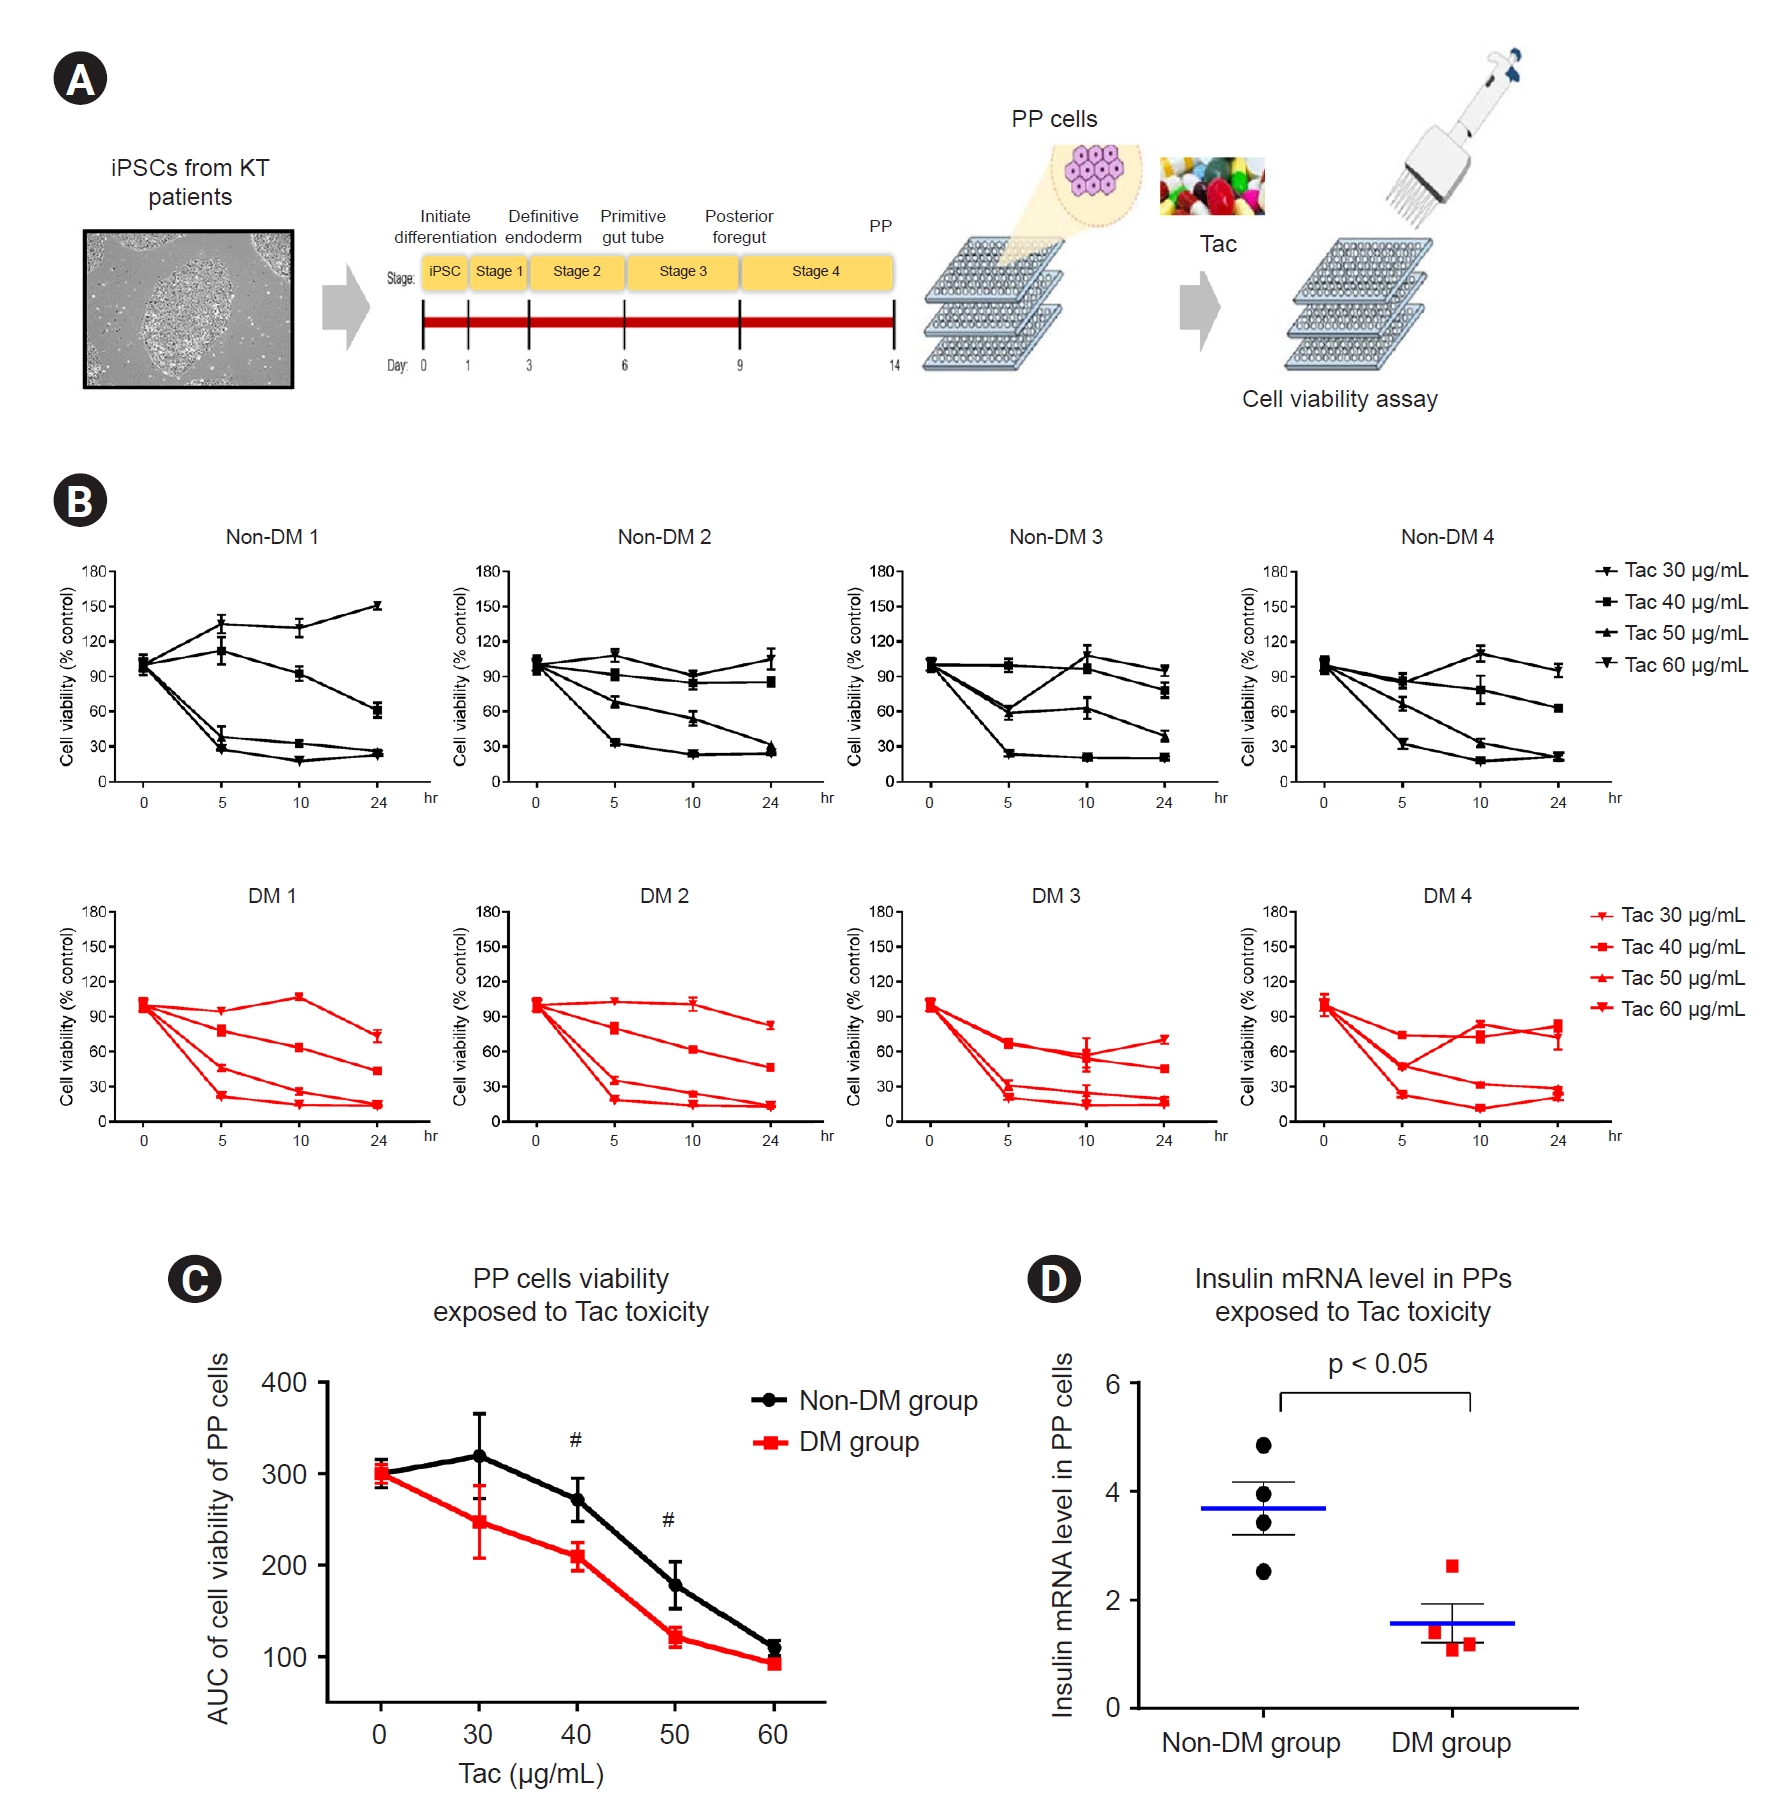
We examined Tac-induced toxicity in PP cells. We differentiated the patient-specific iPSCs (non-DM individuals, n = 4; DM patients, n = 4) in a 96-well plate using the standardized protocol during the four stages over the 14-day course of PP cell formation. At the end of the differentiation stage, Tac was administered for 24 hours at serial doses of 0, 30, 40, 50, and 60 μg/mL, and toxicity was confirmed via a cell viability assay using CCK-8 (Fig. 8A). We calculated the area under the curve, indicating the individual cell viability rates at various Tac levels and exposure times (Fig. 8B).
The average cell viability results for each group are shown in Fig. 8C. In PP cells obtained from the DM group during Tac treatment (40- and 50-μg/mL Tac), cell viability was significantly lower than that in the non-DM group (40 μg/mL Tac: 215 ± 5 vs. 271 ± 7, p < 0.05 vs. non-DM group; 50 μg/mL Tac: 121 ± 3 vs. 178 ± 7, p < 0.05 vs. non-DM group, p < 0.05 vs. non-DM group). The insulin mRNA levels in the PP cells of the DM group were also markedly lower than those in the non-DM group when 50 μg/mL Tac was used (14 ± 3 vs. 50 ± 4, p < 0.05 vs. non-DM group) (Fig. 8D).
Discussion
Our results showed that KT patient-derived iPSCs can be used to predict DM before performing KT. Whole transcriptome and functional enrichment analyses of KT patient-derived iPSCs showed that insulin resistance, type 2 DM, and transforming growth factor beta (TGF-β) signaling pathways are significantly associated between the group of DM and non-DM. The efficiency of differentiation of PP cells from iPSCs was lower in patients with DM than in non-DM individuals, and iPSC-derived PP cells in the insulin generation-related system were more vulnerable in patients with DM than in non-DM individuals. Moreover, Tac toxicity screening showed a significant decrease in the number of PP cells of the DM group, suggesting that these cells are more susceptible to Tac toxicity. Therefore, our results revealed a genetic link between insufficient maturation of iPSCs into PP cells in the DM group.
We compared the reprogramming efficacy and pluripotency marker expression of the DM and non-DM groups. PBMCs were used as a platform for iPSC reprogramming because blood collection is less invasive than skin biopsy. For reprogramming, we used the Sendai virus transfection method. We did not detect any differences in reprogramming efficacy or pluripotency marker expression between patients with DM and non-DM individuals. Thus, iPSCs from patients with DM have similar pluripotent potential as cells from non-DM individuals.
A recent study examined clinical and genetic factors associated with new-onset DM after transplantation in a renal transplant population via a genome-wide association study [15]. The study revealed seven single nucleotide polymorphisms associated with genes implicated in the beta-cell apoptotic pathway, which may be the primary pathologic process in new-onset DM after transplantation [16,17]. We evaluated the transcriptomes of patient iPSCs using RNA-sequencing analysis to determine whether there were differences in genetic background between the DM and non-DM groups.
Using KEGG analysis, we performed functional and pathway enrichment analyses of the DEGs. Among the top 12 pathways, we focused on insulin resistance and type 2 DM, which included the DEGs SOCS3, MLXIPL, INSR, PPARA, PIK3R5, and SLC27A2. We also found that the TGF-β signaling pathway was strongly associated with iPSCs in the DM group. The in vitro protocol for differentiation of iPSCs into insulin-positive cells, including PP cells, involved inhibition of TGF-β signaling using a receptor antagonist, TGF-β R1 kinase inhibitor, and ALK5 inhibitor [7,8,11,18,19]. This suggests that downregulation of TGF-β signals is important during pancreatic development and beta-cell maturation. Taken together, these results indicate that genetic alterations in patients with DM are likely to play an important role in DM onset after KT.
Based on the above results, we evaluated the efficacy of PP cell differentiation in both groups. During differentiation into iPSC-PPs, we observed differences between the DM and non-DM groups in terms of differentiation efficacy. The iPSCs from the DM group consistently generated fewer PP cells than those from the non-DM group, and the mRNA levels of PP cell differentiation-related genes from both groups using qRT-PCR. The number of insulin-positive cells and insulin mRNA expression levels were significantly lower in patients with DM than in non-DM individuals. Confocal microscopy and EM showed decreased insulin expression in patients with DM. These findings suggest that patient-derived iPSCs exhibit defective differentiation of disease-related cells, and that PP cells show functional and morphologic defects in DM; therefore, PP cells can be used to predict DM.
Currently, there is no consensus regarding the preferred immunosuppression regimen to prevent DM, and individuals with DM are likely to be susceptible to immunosuppressive agents. Tac is the most popular treatment for preventing transplant rejection, but little is known about the methods for predicting beta cell injury in individuals. Therefore, we tested Tac-induced toxicity in iPSCs and PP cells and compared cell survival rates and insulin expression. The PP cells of the DM group showed significantly lower cell viability and insulin mRNA expression than those of the non-DM group; such differences were not observed for the iPSCs (Supplementary Fig. 2, Supplementary Methods available online). These findings demonstrate that PP cells derived from patients with DM are more vulnerable to Tac toxicity than are those from non-DM individuals.
Our study has several limitations. First, it included only a few individuals per group, which is insufficient for representing overall new onset of DM population. Second, our study focused on Tac-induced DM; however, research involving other drugs, such as steroids, may also be required to evaluate DM. Third, potential target molecules need to be validated using inhibitors to confirm their functional roles.
In conclusion, we developed a novel approach for predicting DM before KT using patient-specific iPSCs. The model established in this study could be used to understand the pathophysiology of new-onset DM after KT, which may aid in developing novel therapeutics and predicting the risk of DM.
 PDF Links
 PubReader
 ePub Link
 Full text via DOI
 Download Citation
 Supplement table 1
 Print
Print


")


