


Introduction
Sepsis-associated acute kidney injury (S-AKI) is a common organ dysfunction encountered in sepsis and is associated with high mortality and increased risk of chronic comorbidity development [1,2]. As the risk of adverse outcomes depends on the severity of AKI, critical cases requiring renal replacement therapy (RRT) have the worst prognoses [3]. In contrast, patterns of reversal following episodes of S-AKI are diverse; and a considerable number of patients do not exhibit renal recovery, eventually progressing to chronic kidney disease (CKD) [4]. Patients without renal recovery have a higher risk of long-term mortality than those exhibiting even partial recovery [5,6]. The recovery status can also determine the risk of progression to CKD and end-stage renal disease [7,8]. Taken together, early recognition of injury and estimation of reversibility are fundamental to providing optimal therapy to patients with sepsis who are afflicted with or are at risk of S-AKI. Nevertheless, the current armamentarium is limited to providing precision medicine; and most emerging biomarkers have focused on damage estimation, not on recovery [9]. Techniques reflecting renal reserve and reversibility may help guide unmet clinical issues in the management of S-AKI populations. These issues include the ability to stop RRT and affect some degree of renal function recovery.
The pathophysiological mechanism underlying S-AKI is not fully understood; thus, therapy for this condition remains reactive and nonspecific. Restoration of renal perfusion using fluids and vasopressors has been the main target when managing patients with or at risk of AKI; however, its role in S-AKI is unclear. The contribution of renal hypoperfusion to S-AKI seems to be highly complex. S-AKI may occur in the absence of global renal hypoperfusion and in the presence of normal or increased renal blood flow [10–12]. Moreover, alterations in microcirculation have been shown to play a major role in S-AKI [13,14]. Research has reported that microcirculatory abnormalities can persist even after the restoration of macrocirculatory parameters such as arterial pressure and oxygen delivery [15], and microcirculatory function has prognostic significance in patients with sepsis [15,16]. In this context, the estimation of renal microcirculatory function may help to accurately assess disease progression and facilitate optimal treatments. Various techniques for assessing microcirculatory function have been investigated to establish their clinical utility in patients with sepsis. Renal contrast-enhanced ultrasonography (CEUS) is an attractive candidate for quantifying microcirculatory perfusion, and its measurements seem to correlate well with parameters obtained from the gold-standard method, para-aminohippurate clearance [17]. In addition, a previous study examining CEUS found that a decrease in cortical renal perfusion was observed in patients with septic shock; and impaired perfusion was associated with severe AKI [18]. CEUS is emerging as a useful method for the identification of renal conditions. Nevertheless, there is a paucity of studies that have analyzed the use of CEUS in S-AKI. Moreover, the relationship between CEUS-assessed microvascular perfusion and renal recovery following S-AKI has not been studied.
In this retrospective study, we aimed to explore the impact of cortical microvascular function, estimated using CEUS, on renal outcomes in patients who underwent acute RRT for S-AKI. CEUS-derived microcirculatory parameters were evaluated according to clinical variables that reflect disease severity and renal recovery. In addition, we compared the cortical microvascular perfusion of participants with S-AKI with that of healthy individuals and patients with CKD.
Methods
This study was approved by the Institutional Review Board (IRB) of the Chung-Ang University Hospital (No. 2112-033-19397). Owing to the retrospective nature of the study and the anonymization of data, the IRB waived the requirement for the obtainment of written consent from the patients.
Patients
The medical records of adult patients (aged ≥18 years) who underwent CEUS between December 2017 and September 2021 were analyzed. CEUS was performed in 34 patients who received acute RRT for S-AKI. S-AKI was defined as the presence of both AKI and sepsis according to the Kidney Disease: Improving Global Outcomes (KDIGO) clinical practice guidelines for AKI [19] and the third International Consensus Definitions for Sepsis and Septic Shock, respectively [20]. Among the 34 patients, 11 had missing data and were excluded. Data from the remaining 23 were included in the final analysis.
In addition, we recruited and evaluated data from 35 individuals who underwent CEUS during the study period—18 patients with CKD and 17 individuals without kidney disease. CKD was defined as chronic abnormalities of kidney structure or function according to the KDIGO clinical practice guidelines for CKD [21], while healthy individuals were defined as those with normal renal function without any evidence of kidney damage such as hematuria or proteinuria. We sought to identify the reasons for performing CEUS in each case from the medical records. In the CKD group, CEUS was performed in 16 individuals (88.9%) participating in a clinical trial—nine (50.0%) for imaging before renal biopsy and seven (38.9%) for determining the presence of structural disorders. The remaining two individuals (11.1%) in the CKD group underwent CEUS to assess renal perfusion. In contrast, in the healthy group, CEUS was performed for research in 12 individuals (70.6%)—seven (41.2%) as healthy volunteers, four (23.5%) for differentiating renal cystic lesions, and one (5.9%) for determining structural abnormalities. Among the remaining individuals, three (17.6%) underwent CEUS for differentiating renal cystic lesions and two (11.8%) underwent CEUS for determining structural abnormalities.
Contrast-enhanced ultrasonography protocol and image analysis
CEUS was performed in an ultrasound examination room. Participants with S-AKI underwent the examination after stabilization and transition to the general ward. Renal ultrasonography (RS80A; Samsung Medison) was performed using a 1–7 MHz curvilinear transducer probe by an experienced radiologist with prior experience in the use of CEUS for research [22]. The renal length was measured as the maximum pole-to-pole distance on a longitudinal plane; the larger, thicker, and more accessible of the two kidneys was selected as the representative kidney for the CEUS examination.
The patients were instructed to breathe quietly while lying down in the supine or contralateral decubitus position. Contrast-specific imaging mode was used with a mechanical index of 0.08. Image depth, focus, gain, and frame rate were optimized at the beginning of each examination and kept constant during the study. A small volume (1.5 mL) of a microbubble contrast agent (SonoVue; Bracco) was injected as a bolus intravenously, followed by flushing with saline (5 mL). Contraindications for SonoVue include a history of allergies to sulfur hexafluoride or any of the other components, right-to-left cardiac shunts, severe pulmonary hypertension (defined as pulmonary artery pressure of >90 mmHg), uncontrolled systemic hypertension, and adult respiratory distress syndrome. Images were collected throughout the passage of the contrast agent, and all images and digital dynamic cine clips were registered and stored.
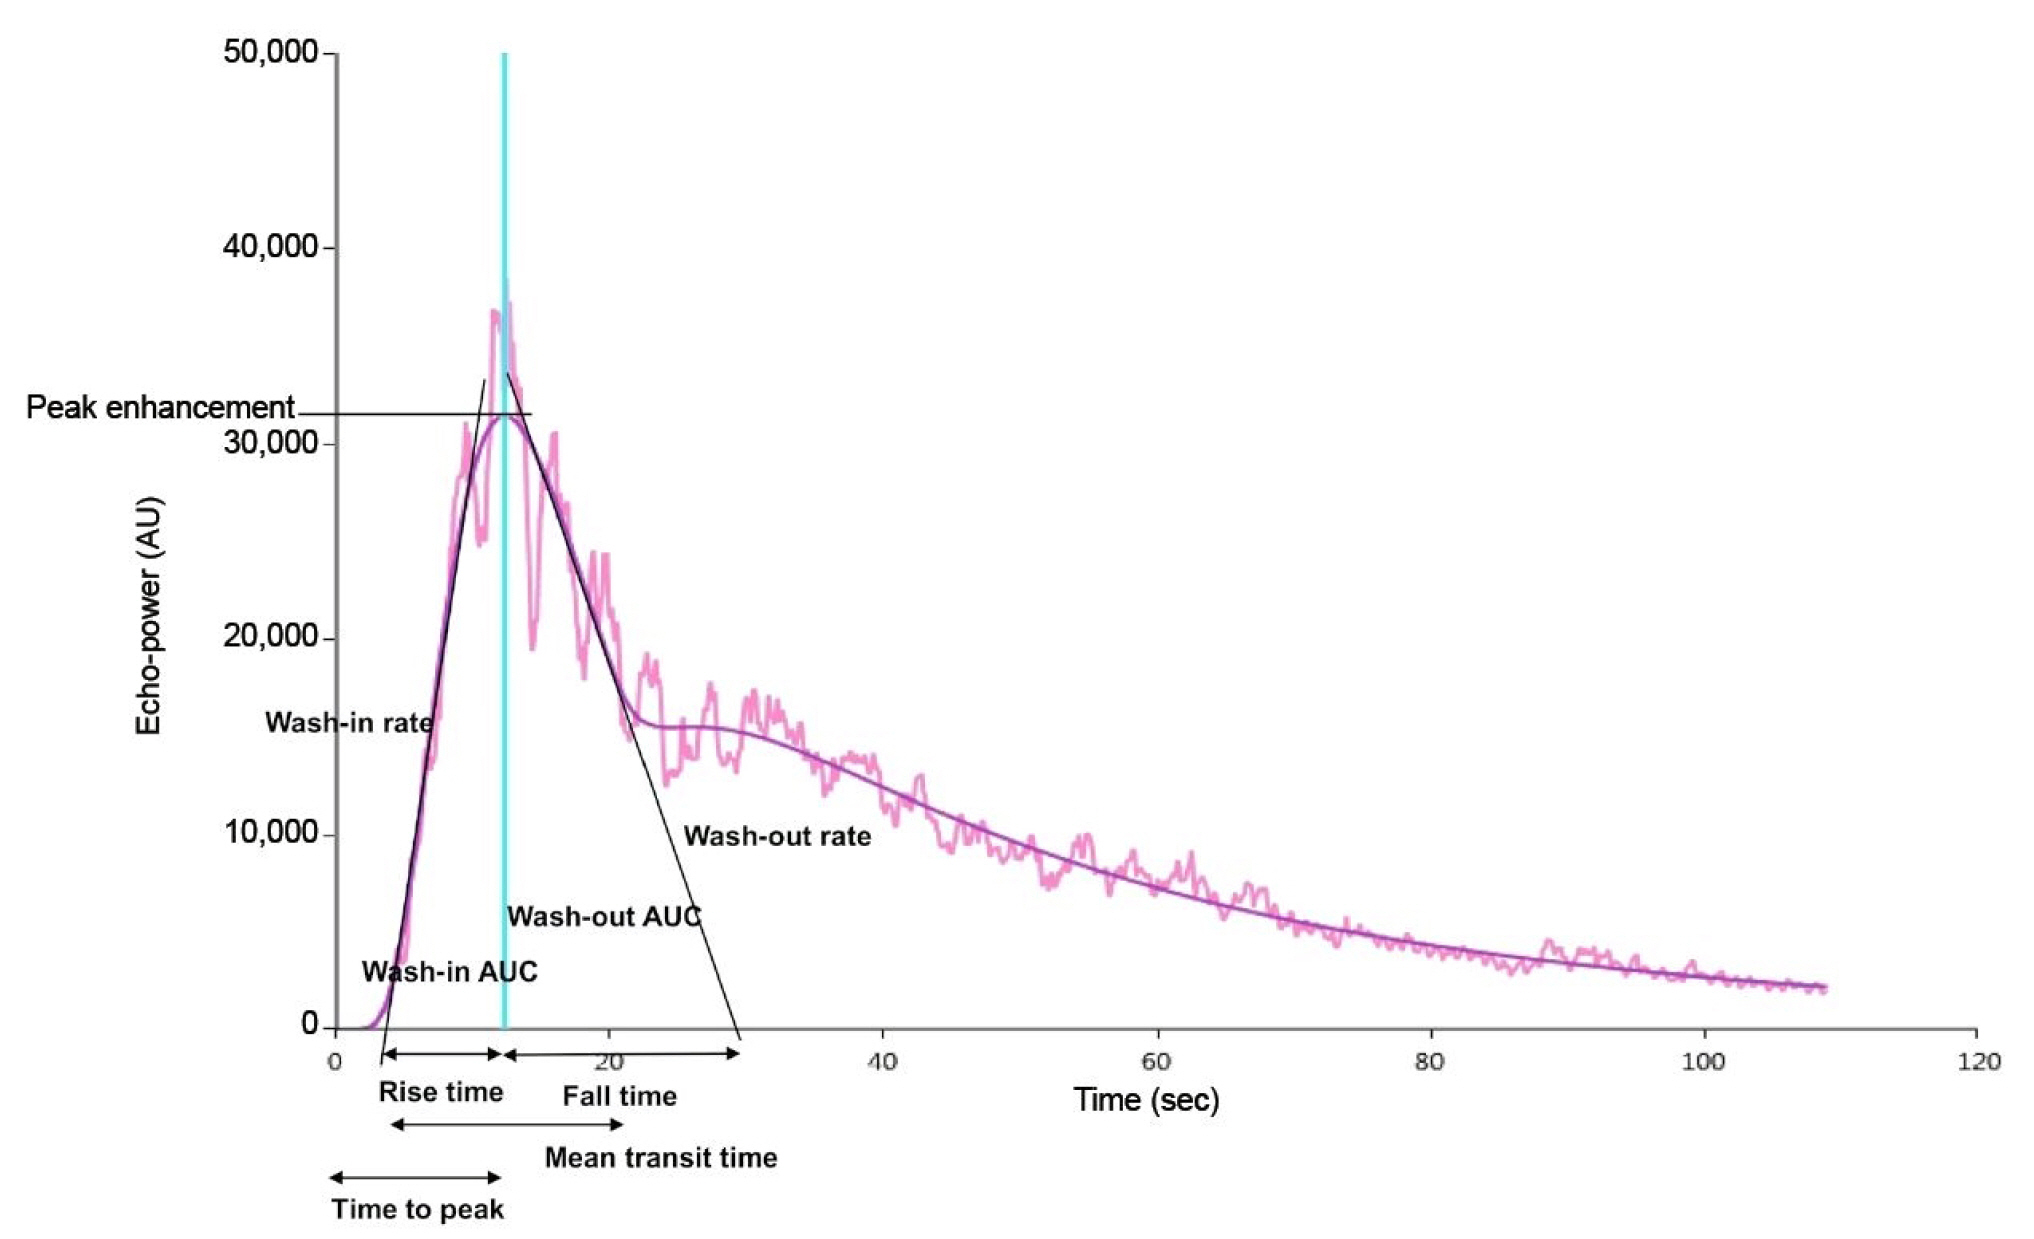
The ultrasonography sequence was exported in digital imaging and communication in medicine format and analyzed offline using a software package (VueBox; Bracco Research). The region of interest was highlighted to enclose the largest visible area of the renal cortex on the surface closest to the ultrasonography probe. The time-intensity curve was illustrated according to the quality of fit, and only those with indices of ≥85% were selected for analysis. The time-intensity curve was used to determine these CEUS-derived microcirculatory parameters (Fig. 1): microvascular blood volume, which is indicated by peak enhancement; wash-in area under the curve (AUC); wash-in perfusion index; wash-out AUC; microvascular flow velocity, which is indicated by rise time, mean transit time, time to peak, and fall time; and microvascular blood flow, which is indicated by wash-in rate and wash-out rate [23,24].
Data collection
In participants on RRT following S-AKI, clinical data, including age, sex, comorbidities, cause of infection, urine output, and RRT duration, were collected. The comorbidity burden was assessed using the modified Charlson comorbidity index [25], and disease severity was assessed using the Sequential Organ Failure Assessment (SOFA) score [20]. Parameters to calculate the SOFA score and define sepsis were obtained at the time of RRT initiation. We obtained available inpatient and outpatient serum creatinine levels, and baseline renal function was estimated using the outpatient nadir creatinine level within 7 to 365 days before admission [26].
The data obtained from the participants in the healthy and CKD groups included age, sex, comorbidities, medication history, and serum creatinine levels. The estimated glomerular filtration rate (eGFR) was calculated using the CKD Epidemiology Collaboration formula [27].
Definitions
Renal recovery was defined as sustained independence from RRT for at least 14 days [28]. The RRT duration was calculated from the initiation of RRT to day 60. In addition, renal function following S-AKI was estimated using the nadir level of serum creatinine from the time of RRT termination to discharge under stable conditions following an episode of S-AKI, and the eGFR in patients who did not experience renal recovery was assumed to be 6 mL/min/1.73 m2 [29].
Statistical analysis
Continuous variables were expressed as median (with interquartile range [IQR]) and were compared using the Mann-Whitney test or Kruskal-Wallis test. Categorical variables, expressed as numbers (percentages), were analyzed using the chi-square test; and the Bonferroni correction was used for pairwise comparisons among the groups. In the CKD group, Cox regression analysis was used to determine which CEUS derivatives were associated with CKD progression. In contrast, in the S-AKI group, correlations between CEUS-derived parameters and clinical variables were evaluated using Pearson correlation coefficients. Logistic regression analysis was conducted to determine the odds ratio (OR) and predicted probability of the microcirculatory parameters for renal recovery; and multivariate analysis used age, sex, Charlson comorbidity index, and SOFA score for adjustment. We further evaluated the receiver operating characteristic (ROC) curves of CEUS derivatives for renal recovery. All statistical analyses were performed using PASW Statistics version 18 (IBM Corp.). A two-sided p-value of <0.05 was considered significant.
Results
Clinical characteristics among the healthy, chronic kidney disease, and sepsis-associated acute kidney injury groups
The clinical characteristics are detailed in Table 1. Individuals with CKD had a median eGFR of 45.2 mL/min/1.73 m2 (IQR, 15.9–99.3 mL/min/1.73 m2) and urinary protein-to-creatinine ratio of 2.8 g/g Cr (IQR, 1.9–7.8 g/g Cr). The CKD group included six individuals (33.3%) with an eGFR of ≥60 mL/min/1.73 m2, five individuals (27.8%) with an eGFR of 30–60 mL/min/1.73 m2, and seven individuals (38.9%) with an eGFR of <30 mL/min/1.73 m2. In total, 12 (66.7%) and six patients (33.3%) had glomerulonephritis and diabetic kidney disease, respectively. Patients in the S-AKI group were older than those in the healthy and CKD groups (p < 0.001). However, baseline eGFR levels were only available in four patients (17.4%) in the S-AKI group; the median for these was 24.3 mL/min/1.73 m2 (IQR, 14.4–62.3 mL/min/1.73 m2).
Comparisons of contrast-enhanced ultrasonography-derived cortical microcirculatory parameters according to the disease groups
The intergroup differences in the CEUS-derived parameters are detailed in Table 1. Patients with CKD had lower time-to-peak values than healthy individuals (p = 0.04, Bonferroni-corrected). However, the rise time, time to peak, and fall time were prolonged in patients with S-AKI receiving RRT compared to those in healthy individuals (p = 0.045, p = 0.01, and p = 0.096, respectively, Bonferroni-corrected). No significant deviations were observed when comparing the microcirculatory derivatives between the CKD and S-AKI groups.
In the CKD group, the peak enhancement, wash-in AUC, wash-in perfusion index, and wash-out AUC values decreased according to the CKD stage progression (p = 0.04, p = 0.03, p = 0.04, and p = 0.06, respectively). Individuals in the CKD group were followed up for a median of 16 months (IQR, 3–44 months), and four individuals (22.2%) required long-term RRT due to progression to end-stage renal disease. However, no association between CEUS derivatives and renal survival was found.
Association between cortical microcirculatory parameters and disease severity in patients with renal replacement therapy-dependent sepsis-associated acute kidney injury
The median time elapsed from RRT implementation to CEUS evaluation was 12 days (IQR, 8–20 days). The correlations between clinical variables and CEUS derivatives were determined (Table 2). The SOFA scores, use of vasopressors or mechanical ventilation, and presence of shock were not related to the parameters obtained using CEUS. However, rise and fall times were slightly delayed with an increase in the blood lactate level (r = 0.36, r = 0.49 and p = 0.10, p = 0.02, respectively). The mean transit time was proportional to the C-reactive protein level (r = 0.41, p = 0.05). In contrast, the urine output at the time of CEUS was associated with peak enhancement, wash-in AUC, wash-in perfusion index, and wash-out AUC despite statistical insignificance (r = 0.36, r = 0.41, r = 0.37, and r = 0.35, respectively; p = 0.09, p = 0.06, p = 0.09, and p = 0.098, respectively).
Predicting renal recovery following sepsis-associated acute kidney injury requiring renal replacement therapy using contrast-enhanced ultrasonography-derived cortical microcirculatory parameters
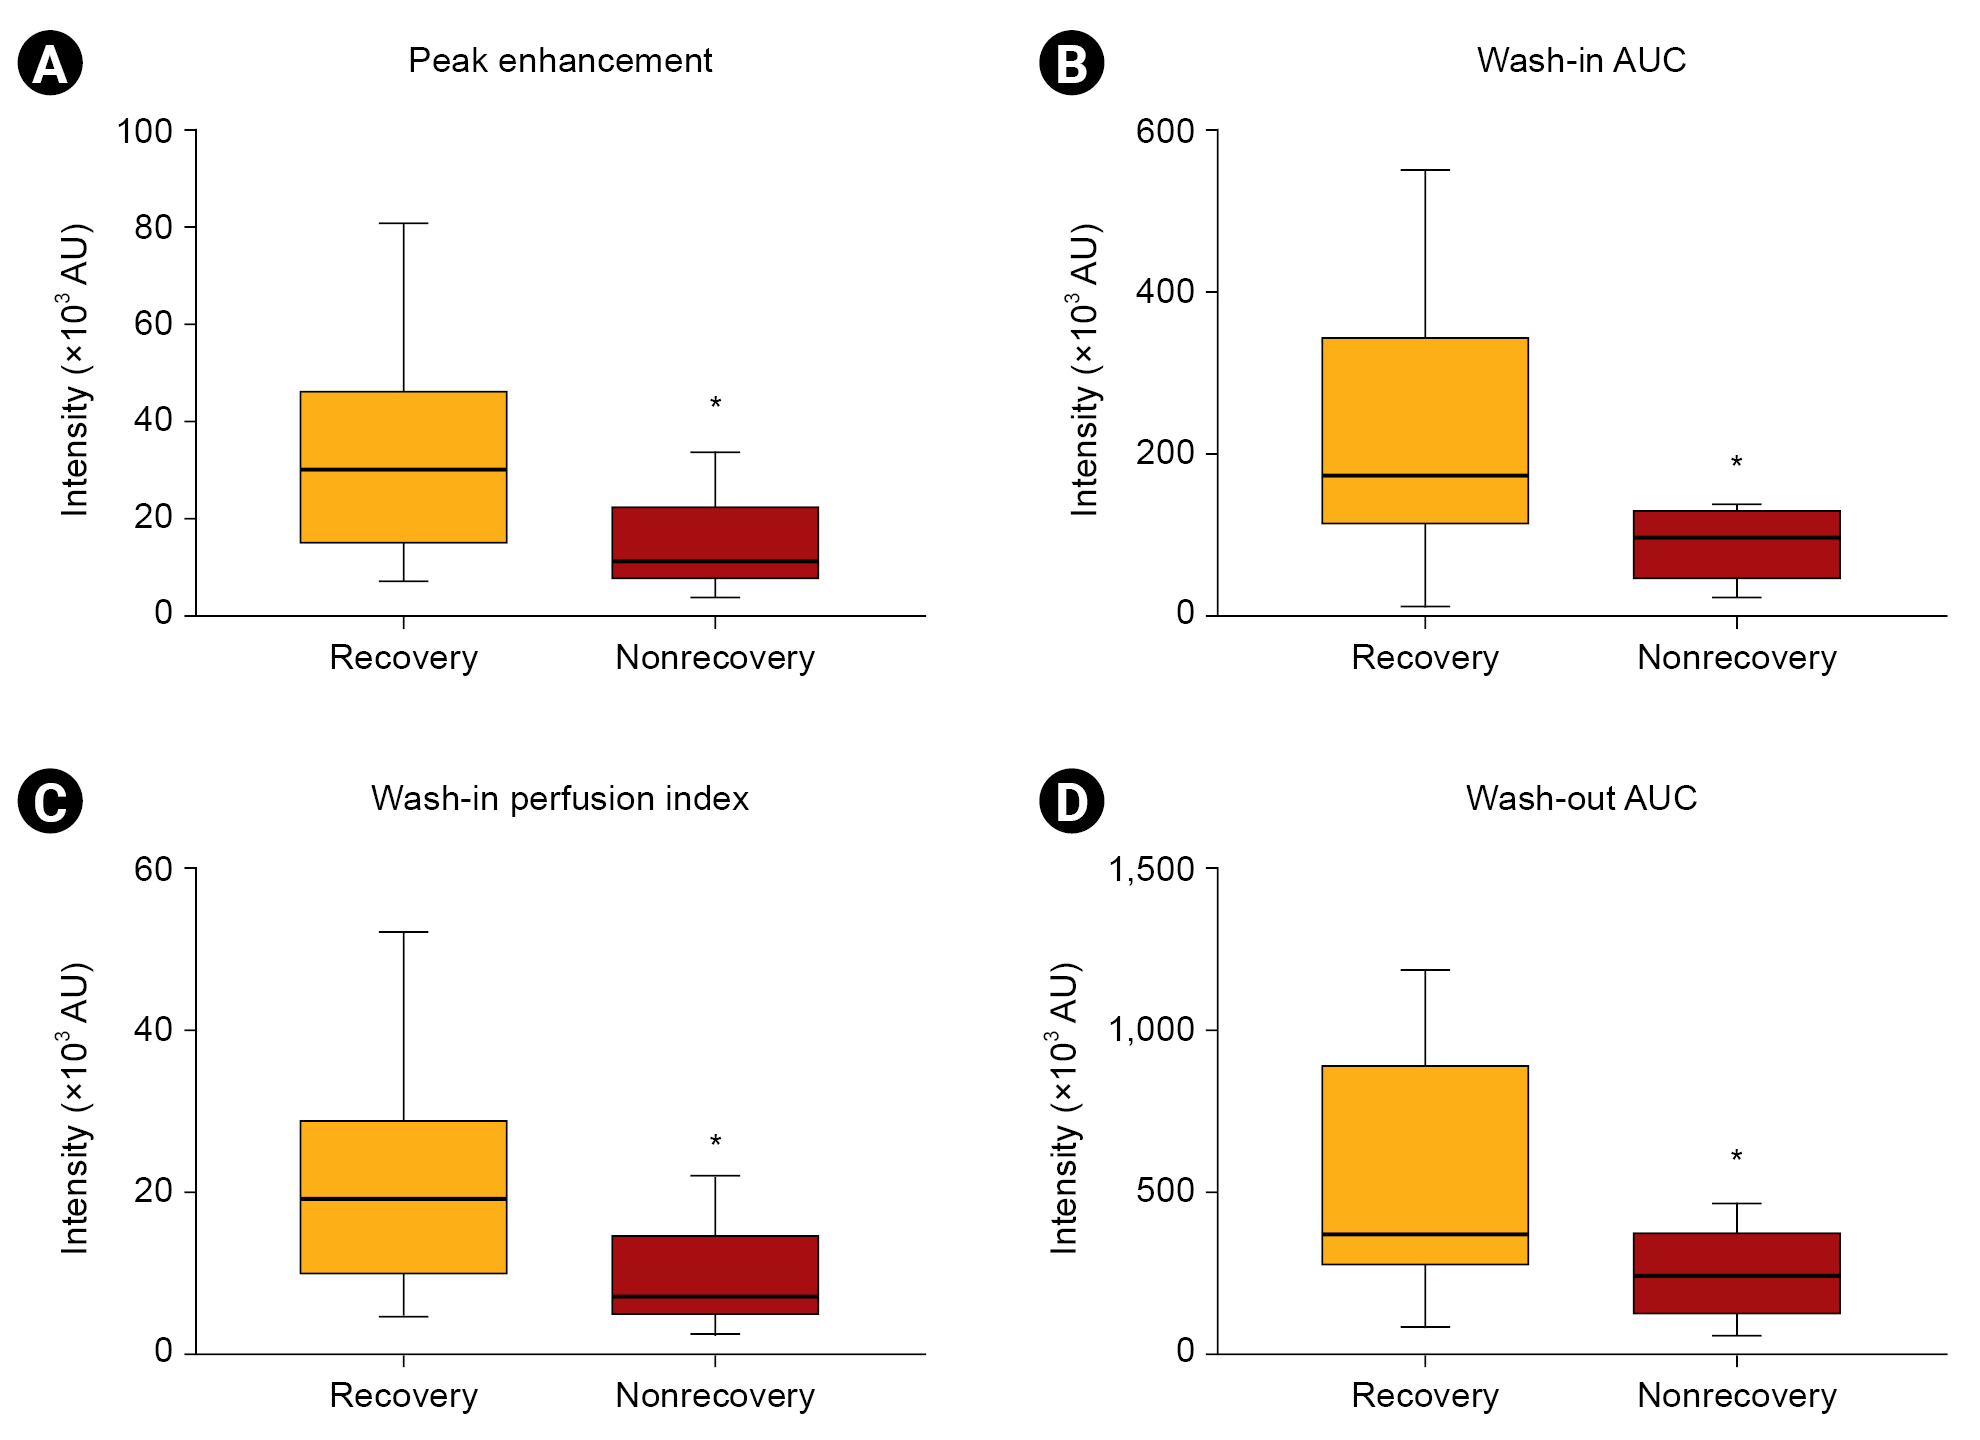
Renal recovery occurred in 14 patients (60.9%) who received acute RRT following S-AKI, and the median duration of RRT was 21 days (IQR, 6–60 days) (Table 3). Renal length was 10.8 cm (IQR, 10.1–11.6 cm) in participants who recovered and 10.2 cm (IQR, 9.4–10.9 cm) in those who did not recover (p = 0.11). CEUS-derived parameters were compared (Fig. 2), and we observed that peak enhancement, wash-in AUC, wash-in perfusion index, and wash-out AUC were higher in patients who recovered renal function than in those who did not (p = 0.03, p = 0.01, p = 0.03, and p = 0.046, respectively). These were also related to the duration of RRT (r = −0.40, r = −0.48, r = −0.41, and r = −0.52, respectively; p = 0.06, p = 0.02, p = 0.05, and p = 0.01, respectively). In contrast, other derivatives, such as rise time, mean transit time, time to peak, and fall time, were irrelevant with respect to renal recovery and the duration of RRT. Renal function following S-AKI was 11.4 mL/min/1.73 m2 (IQR, 6.0–44.7 mL/min/1.73 m2), and a relationship between microcirculatory parameters and renal function following S-AKI was not observed.
The OR of CEUS derivatives in predicting renal recovery following S-AKI in patients undergoing RRT was calculated (Table 4). Despite the lack of statistical significance, there were some interesting trends in the relationship between renal recovery and CEUS parameters, including peak enhancement, wash-in AUC, wash-in perfusion index, and wash-out AUC (p = 0.09, p = 0.07, p = 0.09, and p = 0.08, respectively).
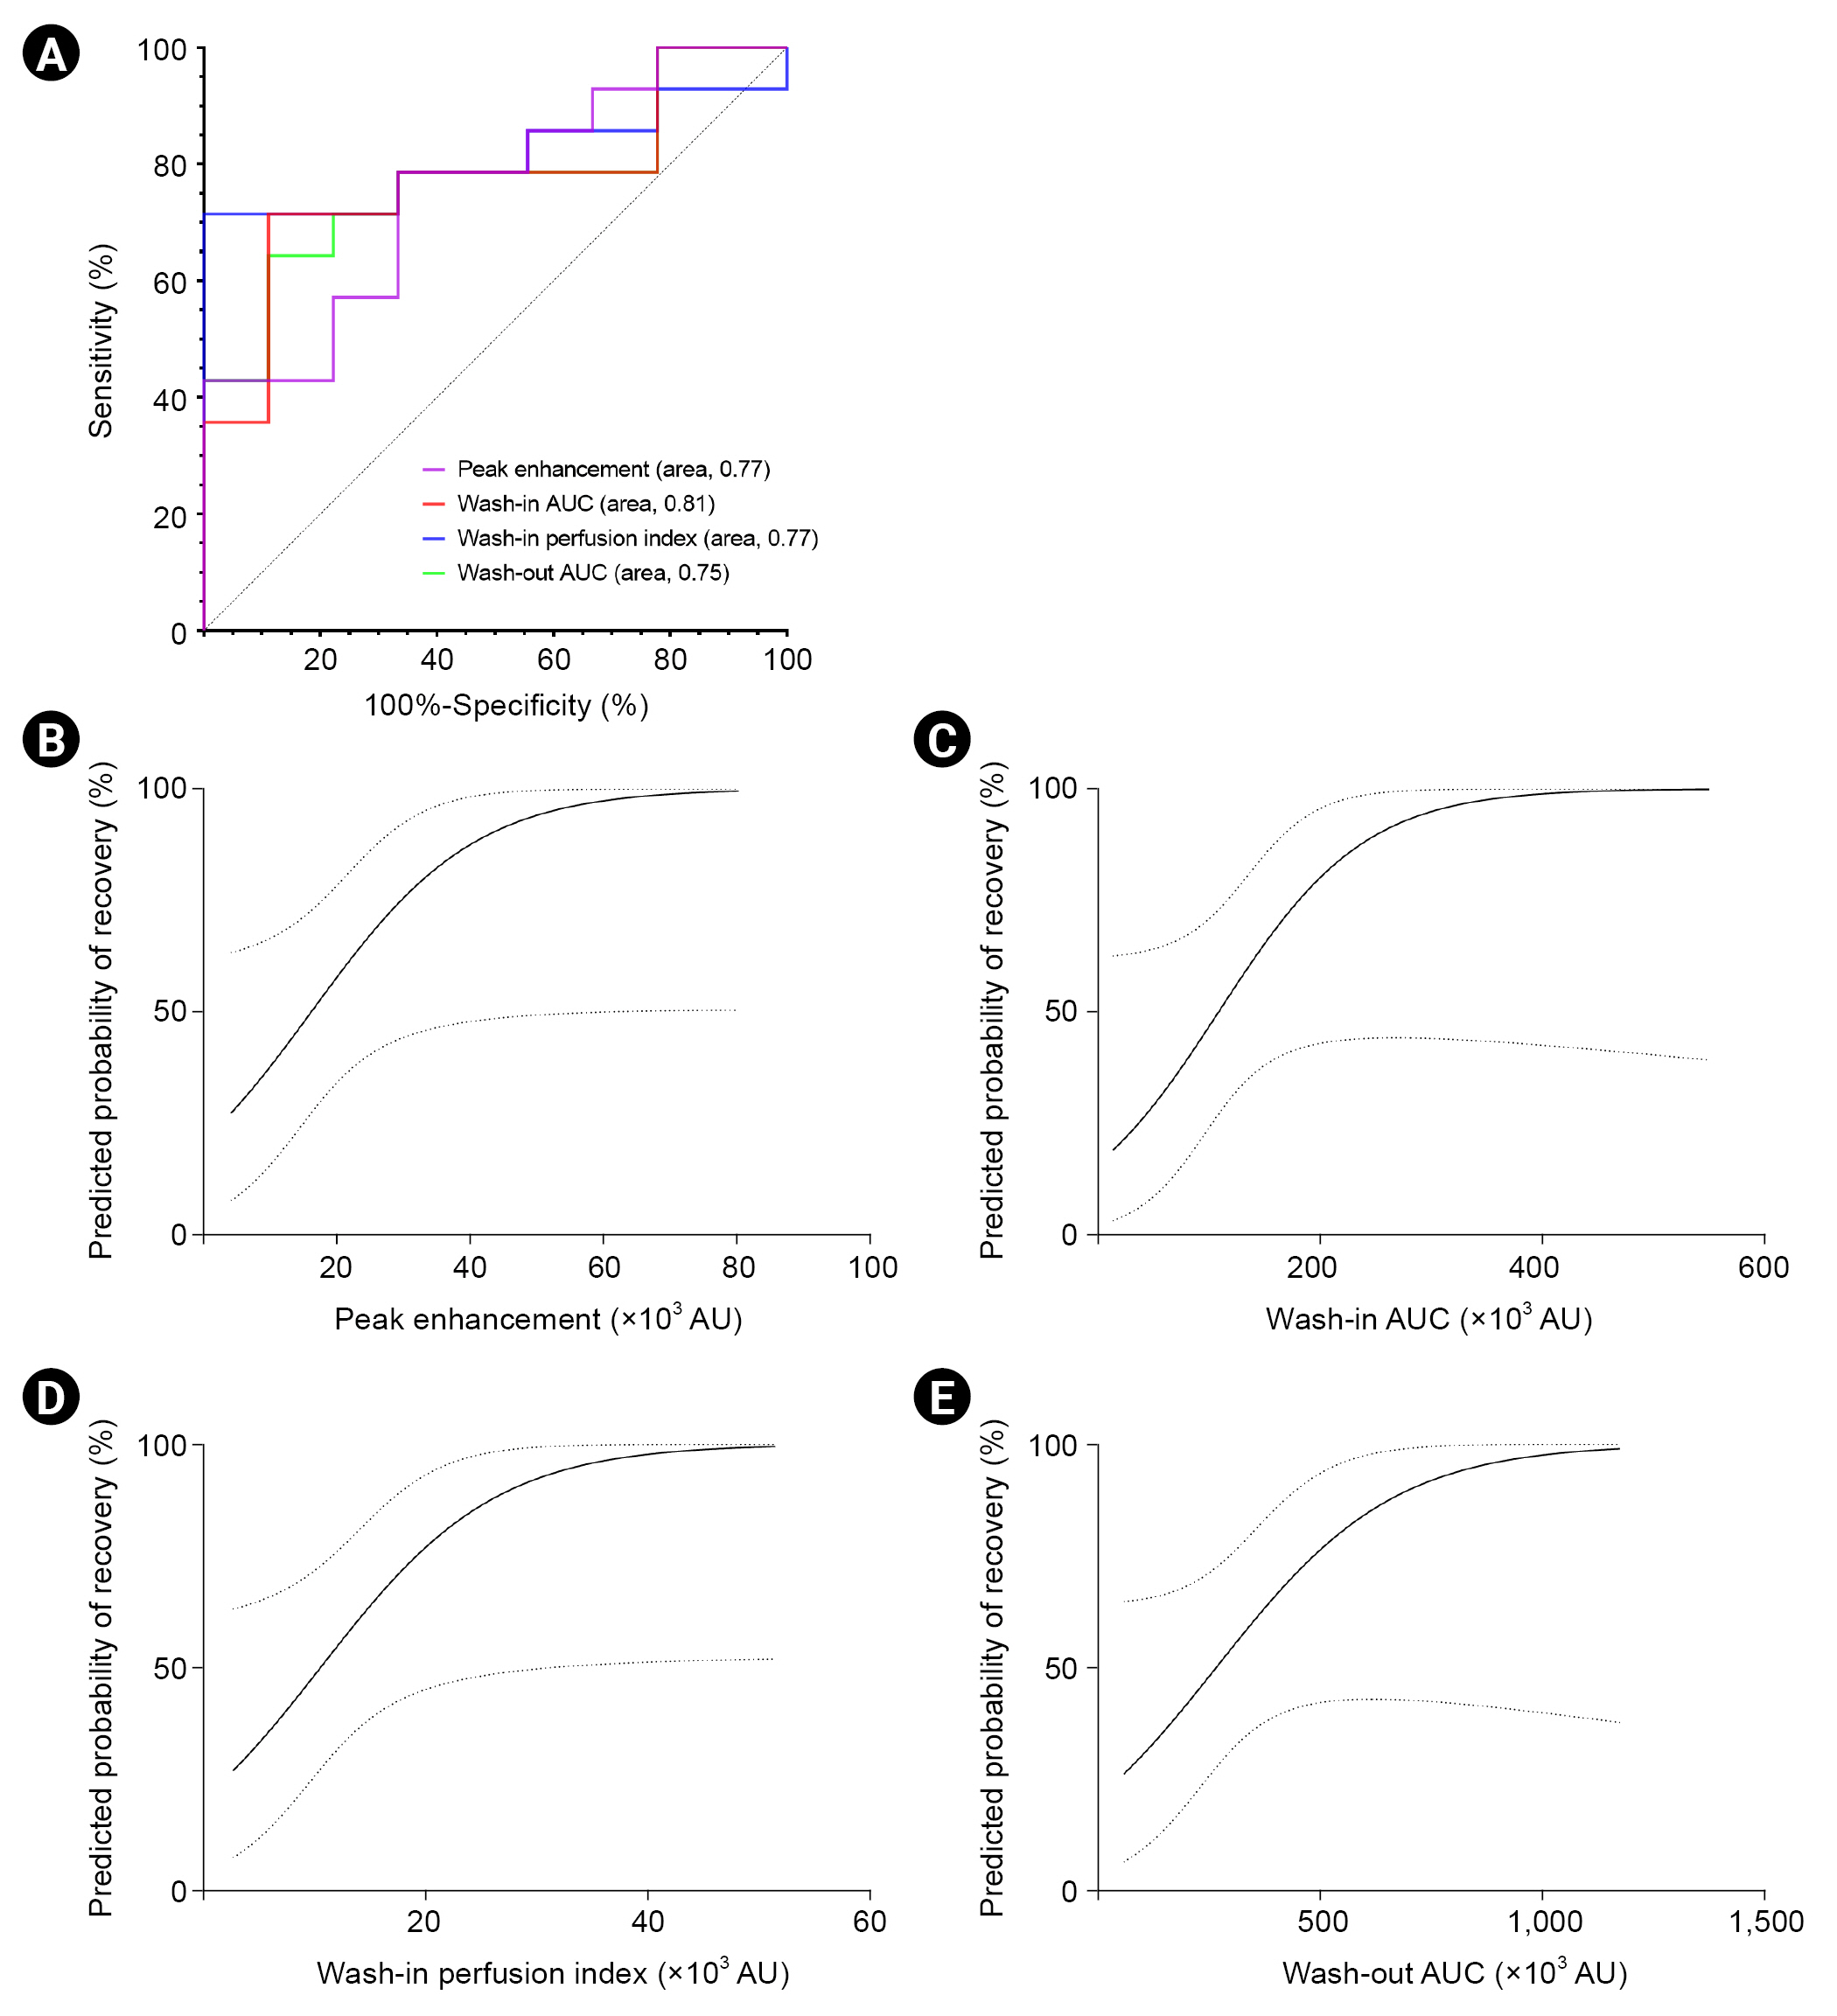
In addition, the ROC curve and predicted probability according to the CEUS-derived parameters were plotted (Fig. 3); and we observed that peak enhancement, wash-in AUC, wash-in perfusion index, and wash-out AUC had the potential to predict renal recovery (p = 0.03, p = 0.01, p = 0.03, and p = 0.04, respectively).
Discussion
This retrospective study attempted to evaluate the utility of CEUS-assessed cortical microcirculatory function in the estimation of reversal patterns following S-AKI requiring RRT. In comparison with CEUS-derived parameters in healthy individuals, we found that the rise time, time to peak, and fall time were delayed in patients who received acute RRT for S-AKI. These values seemed to be related to disease severity, represented as blood lactate levels; however, the values were not related to renal recovery following S-AKI requiring RRT. Among the CEUS derivatives, there was also a correlation between renal recovery and peak enhancement, wash-in AUC, wash-in perfusion index, and wash-out AUC; and these associations seemed to be independent of age, sex, comorbidities, and disease severity. Based on these results, CEUS-assessed cortical microvascular perfusion could help predict reversal patterns following S-AKI requiring RRT.
Renal microcirculation is complex and plays a fundamental role in supplying oxygen to the kidneys. Alteration of microcirculation is emerging as a crucial factor in the development of AKI and CKD [13,14,30] and has been shown to be related to the pathophysiology of the AKI-to-CKD transition [30]. In this context, evaluation of microcirculatory function in the kidneys is important for understanding disease progression and guiding the development of therapeutic strategies aimed at the restoration of microvascular perfusion. Various techniques are being tested to analyze renal microcirculation; of these, CEUS holds promise as a tool that enables the quantification of perfusion in the kidneys. Using microbubble contrast agents, CEUS can express such tissue hemodynamics as microvascular blood volume, microvascular flow velocity, and microvascular blood flow [23,24]. The overall safety of microbubble contrast agents is now generally accepted, and a low rate of serious adverse events has been noted only in specific disease populations, such as individuals with pulmonary hypertension and right-to-left cardiac shunts [31]. Given the merits of CEUS as a safe and effective imaging approach to assess renal microcirculation, CEUS has been applied in research on various kidney diseases [18,32,33]. Nevertheless, more studies are essential to validate the utility of CEUS in clinical practice. Research investigating the role of CEUS derivatives in patients with S-AKI is still in the nascent stage, despite the strong relationship between microcirculatory dysfunction and S-AKI [13,14]. This study aimed to determine the role of renal cortical microcirculation in the progression to end-stage renal disease after an episode of RRT-dependent S-AKI, and noteworthy is that we used participants with uniform characteristics regarding the etiology and severity of AKI.
We first described the renal cortical microcirculation in patients with S-AKI and then compared the microcirculation to that of healthy individuals and patients with CKD. Patients with S-AKI had slower microvascular flow velocity than healthy individuals, despite similar values of microvascular blood volume. In contrast, deviations between the parameters in the S-AKI and CKD groups were not observed. However, caution is required when interpreting these results. Although participants in the healthy group had no abnormalities in terms of kidney structure and function, the presence of extrarenal disease or aging might affect the outcome as hypertension and aging can alter the structure and function of microcirculation [34,35]. However, when comparing the CEUS derivatives between the CKD and S-AKI groups, age deviation and renal function heterogeneity of the CKD group should be considered. In fact, parameters related to microvascular blood volume were found to be dependent on the CKD stage. In addition, drugs that can affect renal autoregulation might affect CEUS derivatives [36]. Taken together, our results are inconclusive; the distinction between microcirculatory parameters according to the kidney disease status needs to be confirmed in further studies. Few data have compared the microvascular parameters between healthy participants and patients with AKI and CKD. A previous study in which CEUS was performed in pigs showed decreased peak enhancement and delayed microbubble transit time in a lipopolysaccharide-induced septic shock model, and the authors further suggested that renal cortical microcirculatory hypoperfusion coincided with altered sublingual microcirculation. However, the current study found that impaired microcirculation in patients with S-AKI was mainly related to prolonged blood flow rate rather than a reduction in microvascular volume.
In addition, we evaluated the relationship between CEUS derivatives in the renal cortex and disease severity, finding that a slow flow rate was associated with a high blood lactate level. These results correspond to the data shown in previous reports [18,37]; however, the results should be cautiously interpreted because of the time elapsed between severity assessment and CEUS examination. The median time from RRT commencement to CEUS implementation was 12 days (8–20 days), and the differences among S-AKI group individuals could have affected the outcomes. Although a substantial duration of sepsis treatment could restore a dispersion of flow [38], sites of infection might also influence microcirculatory blood flow resulting from inflammatory mediator-induced vasoconstriction and vasodilation, especially in individuals with urinary tract infections. Harrois et al. [18] estimated renal cortical perfusion using CEUS with a continuous contrast infusion method in which a remarkable delay in the mean transit time was observed in the presence of septic shock or AKI. Another study performed by Yoon et al. [37] evaluated the usefulness of CEUS in patients with AKI and showed that prolonged cortical rise time was related to the advanced stage of AKI, and delays in mean transit time and rise time predicted the requirement of RRT implementation. In summary, microvascular flow velocity estimated using CEUS appears to be related to the development of organ dysfunction and disease severity.
This study aimed to identify whether the assessment of microcirculatory alterations in the renal cortex can be utilized to predict renal recovery in patients with S-AKI requiring RRT. Our results revealed that high values of peak enhancement, wash-in AUC, wash-in perfusion index, and wash-out AUC are associated with an increased probability of renal recovery in such cases. In addition, these parameters also seemed to be related to urine output and duration of RRT. Of the CEUS derivatives, microvascular blood volume, which is estimated by the peak microbubble signal or AUC, is considered to more accurately reflect the extraction rate of oxygen and nutrients to target tissues [39]. The study by Yoon et al. [37] also evaluated recovery from AKI with varying degrees of renal dysfunction as well as with different etiologies, and the authors showed that cortical wash-in rate and medullary peak enhancement predicted AKI recovery. In this context, impaired cortical microcirculation presenting as a decrease in microvascular blood volume may imply an increased risk of progression to CKD and end-stage renal disease following an episode of S-AKI requiring RRT, which can imply microvascular rarefaction. Microvascular rarefaction is one of the main features of kidney aging and can contribute to impaired recovery following AKI, leading to progression to CKD as well as end-stage renal disease [40]. Because of the absence of baseline renal function, we could not distinguish whether reduced microcirculatory perfusion was the consequence of severe injury from sepsis or was owing to the limited reserve due to previous advanced CKD. Microvascular blood volume can decline as the stage of CKD progresses; thus, further studies with serial monitoring of microvascular perfusion are needed to differentiate maladaptive repair after S-AKI from underlying CKD. Nevertheless, this study showed that CEUS-assessed cortical microcirculatory impairment was associated with a reduced chance of discontinuing dialysis after an episode of S-AKI requiring RRT.
This study has certain limitations. First, this was a single-center study with a small sample size, which could have limited the power of the results and ignored some intergroup differences. However, given that the technology to evaluate microcirculation is still emergent, the sample size cannot be considered small; and this study recruited a significant number of participants who had homogenous characteristics, especially with respect to the severity and etiology of AKI. Second, this study was not a controlled trial; selection bias may have occurred and confounders may have been overlooked. We only used multivariate analysis with adjustments for age, sex, comorbidities, and disease severity. The varying durations of time elapsed between S-AKI occurrence and CEUS performance might also have been a confounder. Third, the absence of baseline renal function could limit interpretation as the causality of reduction in microvascular parameters (i.e., consequence of S-AKI or existence of CKD) could not be clarified. However, this study proposes that the evaluation of microvascular perfusion can also be useful in managing patients whose baseline renal function is unknown, which is a frequently encountered situation in clinical practice. Last, if this study recruited serial data of CEUS derivatives and biomarkers reflecting damage severity, a better understanding of the pathophysiological mechanisms of the transition from S-AKI to CKD may have resulted.
In conclusion, this study attempted to identify the clinical utility of renal cortical microcirculatory parameters assessed using CEUS to estimate outcomes in patients who underwent acute RRT due to S-AKI. The reduction in microvascular flow velocity seems to be related to the occurrence of S-AKI and disease severity. In contrast, CEUS-derived microvascular blood volume seems to be associated with the probability of renal recovery following S-AKI and duration of RRT. The utility of evaluating microcirculation using renal CEUS should be comprehensively validated in further studies. Accurate assessment of microvascular perfusion will help guide therapeutic strategies in managing patients afflicted with or at risk of S-AKI.
 PDF Links
 PubReader
 ePub Link
 Full text via DOI
 Download Citation
 Print
Print


")


