


Introduction
Immunoglobulin M (IgM) nephropathy (IgMN), a pathologically defined disease first described by Cohen et al. [1] and Bhasin et al. [2] in 1978, is characterized by diffuse deposition of IgM in the mesangium. However, the definition and characteristics of IgMN remain unclear [1,2]. IgMN has no universally accepted description. Instead, it is described as an immune complex-mediated glomerular disease of unknown etiology, mainly showing clinical features of nephrotic syndrome, asymptomatic proteinuria, or isolated hematuria [3,4]. In the field of glomerulonephritis (GN), IgMN is a relatively less well-understood clinicoimmunopathological entity [5].
The prevalence of IgMN reported in native renal biopsy series involving children or adults varies from 2% to 18.5% [3,5,6]. However, Thailand was reported to have the highest IgMN prevalence (45.8% of 2,154 biopsies), which decreased to 16.9% between 2003 and 2005 [7]. There have also been occasional reports of IgMN in transplant biopsies [5,8]. IgMN prevalence is more common in children than in adults [3].
Using immunofluorescence (IF) staining, IgMN has been characterized as a diffuse, granular, and global mesangial deposition of IgM [4,6,9]. Although other immunoglobulins may also be deposited in the mesangium, IgM deposition is predominant [9]. IgMN occurrence is frequently associated with other complements, especially complement 3 (C3) [10]. Observation under light microscopy (LM) typically presents extracellular mesangial matrix accumulation and diffuse mesangial cell proliferation [10]. The histological appearance, however, can vary from no glomerular abnormalities to different degrees of mesangial hyperplasia associated with segmental or global sclerosis [10,11]. Studies on the ultrastructural properties of IgMN have been limited to date [3]. In many cases, electron microscopy (EM) has not been performed and reported. However, EM has indicated that IgMN patients have varied degrees of mesangial cell proliferation and mesangial matrix expansion in IgMN patients. Furthermore, electron-dense deposits (EDDs) have frequently been described as being unclear and exhibiting low volume and low density [9,12]. Extreme IgMN manifestations resemble minimal change disease (MCD) and focal segmental glomerulosclerosis (FSGS). Some researchers have observed that in certain cases, IgMN, initially characterized by minor changes or mesangial proliferation, can progress to FSGS upon repeated biopsies [9,13]. Although IgMN is frequently considered a bridge between MCD and FSGS [3,5,14,15], because of its varying morphological characteristics, it remains unknown whether IgMN is a distinct disorder.
In this study, we aimed to investigate the clinical and pathological differences associated with the presence or absence of EDDs in IgMN. We compared IgMN with other types of GN, including MCD, FSGS, and IgA nephropathy (IgAN). The clinical significance of the presence or absence of EDDs in the mesangium in IgMN remains unknown, and the underlying cause of this variation remains elusive. Additionally, there have been disagreements between investigators regarding the validity of considering IgMN as being similar to MCD or FSGS [3,5,14]. Furthermore, investigations comparing the clinical findings between IgAN and IgMN, both of which have mesangial lesions as the predominant pathologic findings, are lacking.
By conducting a comprehensive analysis of the clinical and pathological characteristics of IgMN and examining the role of EDDs, our study aimed to provide valuable insights into the classification and pathogenesis of IgMN. Moreover, the comparison with other types of GN, including MCD, FSGS, and IgAN, allowed for a better understanding of the distinct clinicopathological features of IgMN. Through this research, we aimed to address the gaps in knowledge regarding the clinical significance of EDDs in IgMN and contribute to the existing literature on the classification and clinical course of IgMN.
Methods
This study was approved by the Institutional Review Board of the Seoul National University Bundang Hospital, Republic of Korea (No. B-1910-572-304). Informed consent was waived because of the retrospective nature of the study and the analysis used anonymous clinical data.
Patients and clinical definitions
A review of 1,516 renal biopsies from adult patients over the age of 18 years, processed between May 2003 and June 2017 at the Seoul National University Bundang Hospital, revealed 63 patients with diagnosed IgMN. We defined IgMN as satisfying the following criteria: presence of dominant staining for IgM in glomeruli by immunofluorescence or immunoperoxidase staining, intensity of IgM staining, graded on a semi-quantitative scale, is greater than that of a trace; distribution of IgM staining includes a presence in the mesangium, with or without capillary loop staining; and IgA and IgG may be present but not in equal or greater intensity than IgM (intensity is more than the other antibodies of IgA, IgG, C3, and C4; C3 and C1q may both be present). We excluded patients with secondary causes of nephropathy, such as amyloidosis, diabetic nephropathy, systemic lupus erythematosus, and thrombotic microangiopathy [14]. Acute kidney injury is defined according to the Kidney Disease Improving Global Outcomes (KDIGO) guidelines, with stage 1 characterized by a serum creatinine increase of 1.5 to 1.9 times baseline or an increase by Ōēź0.3 mg/dL within 48 hours, stage 2 by a serum creatinine increase of 2.0 to 2.9 times baseline, and stage 3 by a serum creatinine increase of 3.0 times baseline or an increase to Ōēź4.0 mg/dL [16]. We defined a renal event as a >50% decrease in the estimated glomerular filtration rate (eGFR), in comparison with eGFR at renal biopsy, eGFR of <15 mL/min/1.73 m2, or progression to end-stage renal disease during the follow-up period.
Study design and data collection
We compared the clinicopathological differencesŌĆöbased on the presence or absence of mesangial EDDsŌĆöin IgMN. We also compared the clinicopathological characteristics of patients with IgMN with those of 91, 103, and 469 patients with MCD, FSGS, and IgAN, respectively.
Clinical data, including laboratory results and pathology reports, were collected. Age, sex, co-morbid diseases, systolic blood pressure (SBP), diastolic blood pressure (DBP), and treatment of each patient after biopsy were collected as demographic and clinical data. Blood biochemistry data included cholesterol, glucose, protein, albumin, hemoglobin, creatinine, and eGFR levels. eGFR was evaluated according to the Chronic Kidney Disease Epidemiology Collaboration (CKD-EPI) creatinine equation [17]. Urinalysis data included hematuria and proteinuria. Proteinuria was determined using spotc urine protein-to-creatinine ratio (UPCR). These data were collected at the time of renal biopsy and during the post-renal biopsy follow-up period.
Renal pathology
The renal pathological evaluation methods are detailed elsewhere [18]. All biopsies were assessed according to the established criteria for renal biopsy, which included hematoxylin and eosin, periodic acid-Schiff, Masson trichrome, and periodic acid methenamine silver stains LM, IF staining with antibodies against IgG, IgM, IgA, C3, C1q, fibrinogen, and kappa and lambda light chains, and EM examination. This study evaluated the LM, IF staining, and EM of each specimen. Renal pathology data included the LM findings, including the number of glomeruli, percentage (%) of global sclerosis, segmental sclerosis, crescent, ischemic change, mesangial hypercellularity, and mesangial matrix increase. Tubular atrophy, interstitial fibrosis, interstitial thickening in tubulointerstitium, arteriosclerosis, and intimal thickening of vessels were also collected. For IF, the extent of IgG, IgM, IgA, C3, C1q, fibrinogen, kappa chain, or lambda chain was calculated as the staining intensity. Semi-quantitative reports of the results of IF staining included negative, trace, and 1ŌĆō4 positive results. The data were quantitatively translated as negative to 0 points, trace to 0.5 points, and 1ŌĆō4 positive points. In EM findings, EDD was represented by the number of patients described according to the location where EDD was deposited among mesangium, subepithelial space, and subendothelial space. We defined diffuse effacement of the podocyte foot process as a patient whose podocyte foot process is described as severe, moderate to severe, diffuse, and complete. We represented the number of patients defined as diffuse effacement.
Statistical analysis
Descriptive statistics were reported as mean ┬▒ standard deviation or median (interquartile range [IQR]) for continuous variables or as numbers with percentages for categorical variables. Clinical and pathological comparisons were performed through a Mann-Whitney test for continuous variables and a chi-square test for categorical variables. The renal event-free survival rate of IgMN cases with and without subepithelial EDDs was analyzed using the Kaplan-Meier test. A log-rank test was performed to assess the impact of EDDs on renal event-free survival. We calculated p-values between IgMN and other types of GN, including MCD, FSGS, and IgAN. All p-values were calculated using the Student t test for continuous variables and the chi-square test for categorical variables. The cumulative renal event-free survival of patients with IgMN was compared to that of patients with MCD, FSGS, and IgAN using Kaplan-Meier analysis and log-rank test. Multivariate Cox regression analysis was conducted to identify independent predictor values of the outcome. Statistical analyses were performed by using SPSS for Windows (version 25.0; IBM Corp.).
Results
Clinicopathological findings based on the presence of electron-dense deposits in immunoglobulin M nephropathy clinicopathological characteristics
Among the 63 patients with IgMN, 13 had EDDs, and 50 did not. The clinical and laboratory parameters were compared based on the presence of EDDs (Table 1). The mean age was 56.9 ┬▒ 18.2 years and 54.9 ┬▒ 16.2 years in patients with and without EDDs, respectively. The median eGFR at renal biopsy was 81.3 mL/min/1.73 m2 (36.4ŌĆō107.7 mL/min/1.73 m2) and 67.9 mL/min/1.73 m2 (33.5ŌĆō93.0 mL/min/1.73 m2) in patients with and without EDDs, respectively. The UPCR at renal biopsy was 1.38 g/g Cr (0.82ŌĆō2.08 g/g Cr) and 1.77 g/g Cr (0.75ŌĆō4.80 g/g Cr) in patients with and without EDDs, respectively.
LM findings revealed a higher frequency of mesangial cellularity and matrix increase in IgMN patients with EDDs (Table 1). The intensity of IF staining for IgG, IgM, IgA, and C3 was more prominent in IgMN with EDDs. EM findings elucidated more frequent diffuse podocyte foot process effacement in IgMN with EDDs (11 patients [84.6%] with EDDs vs. 25 patients [50.0%] without EDDs, p = 0.03).
Clinical courses and renal outcome
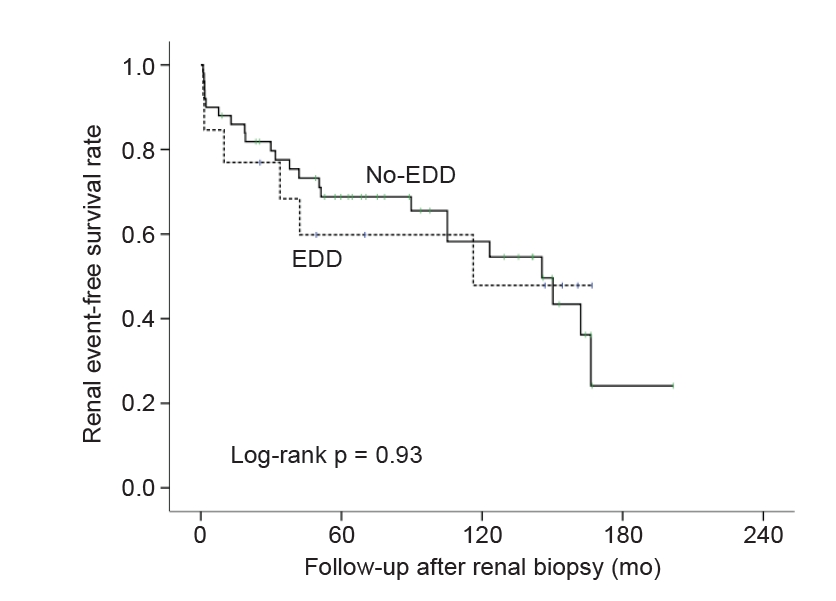
Despite variations in pathological findings, there was no significant difference in clinical characteristics and renal outcomes between IgMN patients with and without EDDs (Table 2). The mean follow-up period for patients with and without EDDs was 57.4 ┬▒ 61.3 months and 81.6 ┬▒ 64.3 months, respectively. During the follow-up period, laboratory tests were performed 1.6 ┬▒ 2.3 times/mo and 1.7 ┬▒ 3.1 times/mo in patients with and without EDDs, respectively. The renal event was observed in six (46.2%) and 23 patients (46.0%) with IgMN with and without EDDs, respectively (p > 0.99). End-stage renal disease (ESRD) developed in 2 (15.4%) and 10 patients (21.3%) with IgMN with and without EDDs, respectively (p > 0.99). Deaths during the follow-up period were recorded for one patients (7.7%) and four patients (8.0%) with IgMN with and without EDDs, respectively (p > 0.99).
The Kaplan-Meier test was used to analyze the renal event-free survival rate of patients with IgMN with and without EDDs (Fig. 1). The presence of subepithelial EDDs in patients with IgMN did not significantly affect renal event-free survival (chi-square = 0.008, degrees of freedom [df] = 1, p = 0.93). Multivariate Cox regression analysis identified glomerular global sclerosis (hazard ratio [HR], 1.029; 95% confidence interval [CI], 1.009ŌĆō1.051; p = 0.05), vessel arteriosclerosis (HR, 2.096; 95% CI, 0.989ŌĆō4.445; p = 0.05), and eGFR-CKD-EPI at biopsy (HR, 0.983; 95% CI, 0.969ŌĆō0.997; p = 0.02) as independent predictors of the outcome. CoxŌĆÖs proportional hazard model for the renal outcome was adjusted with intimal fibrosis, intimal inflammation, tubular atrophy, vessel arteriosclerosis, post-biopsy drug history (alpha-blocker, anti-diabetic medications, antihypertensive medications, anti-platelet medications, cyclophosphamide, tacrolimus), and sex.
Comparison of clinical and histological characteristics between immunoglobulin M nephropathy and other types of glomerulonephritis
Clinical characteristics
A comparative analysis of clinical and histological characteristics among patients with IgMN, FSGS, MCD, and IgAN revealed several significant findings. Patients with IgMN exhibited distinct clinical features, including a higher prevalence of both hypertension (68.3% vs. 50.5% in MCD, p = 0.03) and coronary heart disease (CHD) history (17.5% vs. 4.4% in MCD, p = 0.01). They also showed a lower eGFR (67 ┬▒ 39 mL/min/1.73 m2 vs. 83 ┬▒ 36 mL/min/1.73 m2 in MCD, p = 0.01) and more severe manifestations, such as higher creatinine (1.87 ┬▒ 2.32 mg/dL vs. 1.12 ┬▒ 0.75 mg/dL in IgAN, p = 0.01), acute kidney injury at renal biopsy (41.3% vs. 23.0% in IgAN, p = 0.003) and higher urine protein-to-creatinine ratio at renal biopsy (3.63 ┬▒ 5.43 g/g Cr vs. 1.61 ┬▒ 1.96 g/g Cr in IgAN, p < 0.001) (Table 3).
Histological characteristics
LM analysis elucidated similarities between IgMN and FSGS regarding global sclerosis, segmental sclerosis, and vessel arteriosclerosis. Furthermore, patients with IgMN, in comparison with patients with MCD, exhibited more pronounced global sclerosis (24.0% ┬▒ 43% vs. 8.6% ┬▒ 13.2%, p < 0.001), segmental sclerosis (6.4% ┬▒ 10.6% vs. 0.00% ┬▒ 0.0%, p < 0.001), mesangial hypercellularity (33.3% vs. 7.7%, p < 0.001), and vessel arteriosclerosis (30.2% vs. 4.4%, p < 0.001). In contrast, patients with IgMN, in comparison with patients with IgAN, exhibited a lower prevalence of severe manifestations: mesangial hypercellularity (33.3% vs. 97.2%, p < 0.001), increase in the mesangial matrix (27.0% vs. 91.9%, p < 0.001), and tubular atrophy (85.7% vs. 95.9%, p < 0.001) (Table 3). IF findings revealed prominent IgM staining in the glomerulus of patients with IgMN compared to patients with other types of GN. However, no significant differences were noted in other IF-based observations. EDDs were also observed, with more extensive deposition in the subepithelial and subendothelial spaces. Notably, patients with IgMN displayed more frequent diffuse foot process effacement (57.1% vs. 32.2%, p < 0.001) and less frequent mesangial EDDs (20.6% vs. 91.0%, p < 0.001) than patients with IgAN. A comparison between patients with IgMN and those with other glomerular diseases indicated that patients with IgMN were the most similar to patients with FSGS regarding pathologic characteristics (Table 3).
Treatment and renal outcomes
Treatment approaches in patients with IgMN were similar to those in patients with FSGS, as evidenced by the substantial use of antihypertensive medication and immunosuppressive therapy in both groups (Table 4). In contrast, antihypertensive medication and immunosuppressive therapy were used less frequently to treat patients with MCD. The notable similarity in clinical and histological findings in patients with IgMN to those with FSGS (over the course of treatment) indicates that the overall clinical course of IgMN might be similar to that of FSGS. The frequency of renal events in patients with IgMN (46.0%) was similar to that of patients with FSGS (40.8%, p = 0.52) and higher than that of patients with MCD (18.7%, p < 0.001) or patients with IgAN (26.4%, p = 0.001).
Kaplan-Meier analysis revealed significantly lower cumulative renal event-free survival in patients with IgMN compared to patients with MCD, FSGS, and IgAN (chi-square = 15.839, df = 3, p = 0.001) (Fig. 2). Multivariate Cox regression analysis showed that hypertension (HR, 1.444; 95% CI, 1.010ŌĆō2.065; p = 0.04), CHD (HR, 2.337; 95% CI, 1.490ŌĆō3.666; p < 0.001), subepithelial EDDs (HR, 11.197; 95% CI, 3.293ŌĆō38.074; p < 0.001), glomerular crescent (HR, 1.039; 95% CI, 1.013ŌĆō1.066; p = 0.003), global sclerosis (HR, 1.023; 95% CI, 1.015ŌĆō1.031; p < 0.001), segmental sclerosis (HR, 1.019; 95% CI, 1.003ŌĆō1.035; p = 0.02), albumin (HR, 0.701; 95% CI, 0.568ŌĆō0.865; p = 0.001), eGFR (HR, 0.989; 95% CI, 0.984ŌĆō0.995; p < 0.001), and glucose (HR, 1.005; 95% CI, 1.001ŌĆō1.009; p = 0.02) were independent predictors of the outcome. CoxŌĆÖs proportional hazard model for the renal outcome was adjusted with a history of diabetes mellitus, hypertension, CHD, and CVD, mesangial deposition, subepithelial deposition, intensity of C1q, fibrinogen, IgA, glomerular size, intimal fibrosis, intimal inflammation, tubular atrophy, vessel arteriosclerosis, vessel intimal thickening, and sex.
Discussion
We investigated the clinical and pathological characteristics of IgMN, a glomerular disease that has been studied less extensively than other types of GN. Specifically, we compared the clinicopathological differences in IgMN, concerning the presence or absence of mesangial EDDs. We also compared the clinical course of IgMN with that of other glomerular diseases, including MCD, FSGS, and IgAN. Our study employed strict criteria for defining IgMN, ensuring consistency and comparability among the observed cases and enhancing the reliability of our findings. Through this rigorous approach, we aimed to provide more accurate insights into the clinical course and characteristics of IgMN.
There have only been a few prior studies on the ultrastructural characteristics of IgMN [9]. In many studies, EM has not been reported and the diagnosis was made based on IF microscopy [3,12]. Furthermore, EDDs have frequently been described as being unclear and showing low volume and density and have been overlooked [5,12]. Our results showed no significant difference in clinical characteristics and renal outcomes based on the presence of EDDs in the mesangium of patients with IgMN. This suggests that the presence of EDDs may not be a critical factor in determining the clinical course of IgMN and that IF findings should be the primary diagnostic criterion for IgMN.
In current studies, the clinical characteristics of IgMN are not different from those of MCD and FSGS, so it is not recognized as a separate disease. It is often considered a clinical position between MCD and FSGS [3,14,15]. However, our study reveals that IgMN exhibits clinical and histological similarities with FSGS rather than MCD or IgAN. Patients with IgMN exhibited clinical features similar to FSGS, in terms of blood pressure, eGFR, and proteinuria levels. This suggests that IgMN may be more closely related to FSGS than previously considered and that the overall clinical course of IgMN may be similar to that of FSGS. Contrasting IgMN with FSGS, we observed significant differences in IgM, C3, and Cq1 staining, as well as the existence of EDDs not typically seen in FSGS. Our findings also indicate that patients with IgMN have a lower prevalence of nephrotic syndrome than patients with MCD, but a higher prevalence of diabetes mellitus, hypertension, CHD history, and nephrotic range proteinuria than those with IgAN. Furthermore, renal events in patients with IgMN were higher than that of patients with MCD or patients with IgAN. These results suggest that IgMN may be associated with a more severe clinical presentation than MCD or IgAN.
These findings provide valuable insights into the pathogenesis and classification of IgMN as a disease distinct from MCD, FSGS, and IgAN. Our study suggests that IgMN is a clinicoimmunopathological entity with unique characteristics. Histopathologically, patients with IgMN exhibit a higher proportion of mesangial hypercellularity, global glomerulosclerosis, interstitial fibrosis, and tubular atrophy than patients with MCD, but a lower proportion than patients with IgAN. Notably, our results showed that patients with IgMN have more prominent foot process effacement and less frequent EDDs than patients with IgAN. IgAN is characterized by the presence of EDDs in the mesangial areas of the kidneys of patients [19], and the severity of foot process effacement may be related to the pathogenesis of IgAN and had an impact on the level of proteinuria [20]. The etiology of IgMN, an immune complex-mediated glomerular disease similar to IgA nephropathy characterized by the deposition of abnormally galactosylated IgA1 [21,22], remains unknown. In our findings, the observation of higher EDDs in patients with IgAN suggests their association with the deposition of IgA1 immune complexes. Conversely, the relatively lower presence of EDDs in IgMN patients implies the involvement of alternative pathogenic mechanisms. Therefore, further investigations are warranted to elucidate the underlying factors contributing to the distinct pathogenesis of IgMN.
Our study had several limitations that should be acknowledged. First, our study was conducted at a single center, which may limit the generalizability of our findings to other populations or healthcare settings. Second, the sample size of patients with IgMN included in our study was relatively small, which may have limited our statistical power to detect significant differences in certain outcomes. Additionally, the lack of long-term follow-up data for some patients may have introduced potential bias in assessing the clinical course and outcomes of IgMN.
Nevertheless, our study provides valuable insights into the clinicopathological characteristics and clinical course of IgMN. Future research efforts should aim to address this limitation by conducting larger multicenter studies with longer follow-up periods to explore the underlying mechanisms and etiology of IgMN, develop prognostic prediction models, and investigate appropriate therapeutic strategies. By addressing these research gaps, we can enhance our understanding of IgMN and improve patient outcomes in the diagnosis and treatment, and long-term prognosis of this condition.

 PDF Links
 PubReader
 ePub Link
 Full text via DOI
 Download Citation
 Print
Print


")


