


Introduction
The kidney is a vital organ for various health functions. Impairment in kidney function is related to a higher risk of adverse medical outcomes and mortality. Chronic kidney disease (CKD), a state of kidney function impairment, is associated with a substantial socioeconomic burden; thus, there is considerable societal interest in the consequences and risk factors related to kidney dysfunction [1]. Representative kidney function parameters, namely, estimated glomerular filtration rate (eGFR) and albuminuria, are measured to screen and assess kidney health [2,3].
The association between kidney dysfunction and mortality is complex, although the presence of this linkage is well established [4]. Previous studies have highlighted the clinical significance of the state of supranormal estimated glomerular, and the association between eGFR and death risk has been reported to be U-shaped [4–6]. In addition, previous studies have reported the clinical significance of albuminuria in the general population, and quantified albuminuria showed a linear association with mortality [4]. However, as mortality occurs due to various causes, additional study is warranted to investigate the association between kidney function parameters and death by specific causes. Such an investigation is important, as such a U-shaped association between eGFR and mortality may only represent death from cardiovascular causes and not noncardiovascular death such as cancer- or infection-related death [7]. Additionally, whether albuminuria has clinical significance for diverse causes of death needs to be studied, as urine albumin is mostly considered to be a biomarker related to cardiometabolic disorders. This information provides evidence for the clinical importance of early screening and risk stratification based on kidney function parameters in the general population.
In this study, we examined the association between eGFR or albuminuria and the risk of diverse causes of death in a large-scale health screening database in Korea. We hypothesized that the association between kidney function parameters and mortality risk would be present for various causes of death.
Methods
Ethical considerations
This study was approved by the Institutional Review Board of Seoul National University Hospital (No. E-2111-037-1270). The use of the National Health Insurance Database (NHID) was approved by a government organization. The study was conducted in accordance with the Declaration of Helsinki.
Study setting
In Korea, National Health Insurance is provided to all citizens of the Republic of Korea through the National Health Insurance Service. The NHID provided by the National Health Insurance Service is an insurance claims database and contains information on sociodemographic variables, national general health screening, and mortality. As enrollment in the health insurance system is mandatory, the database enabled us to study nationwide medical information, as done in our previous studies [8–10].
Study population
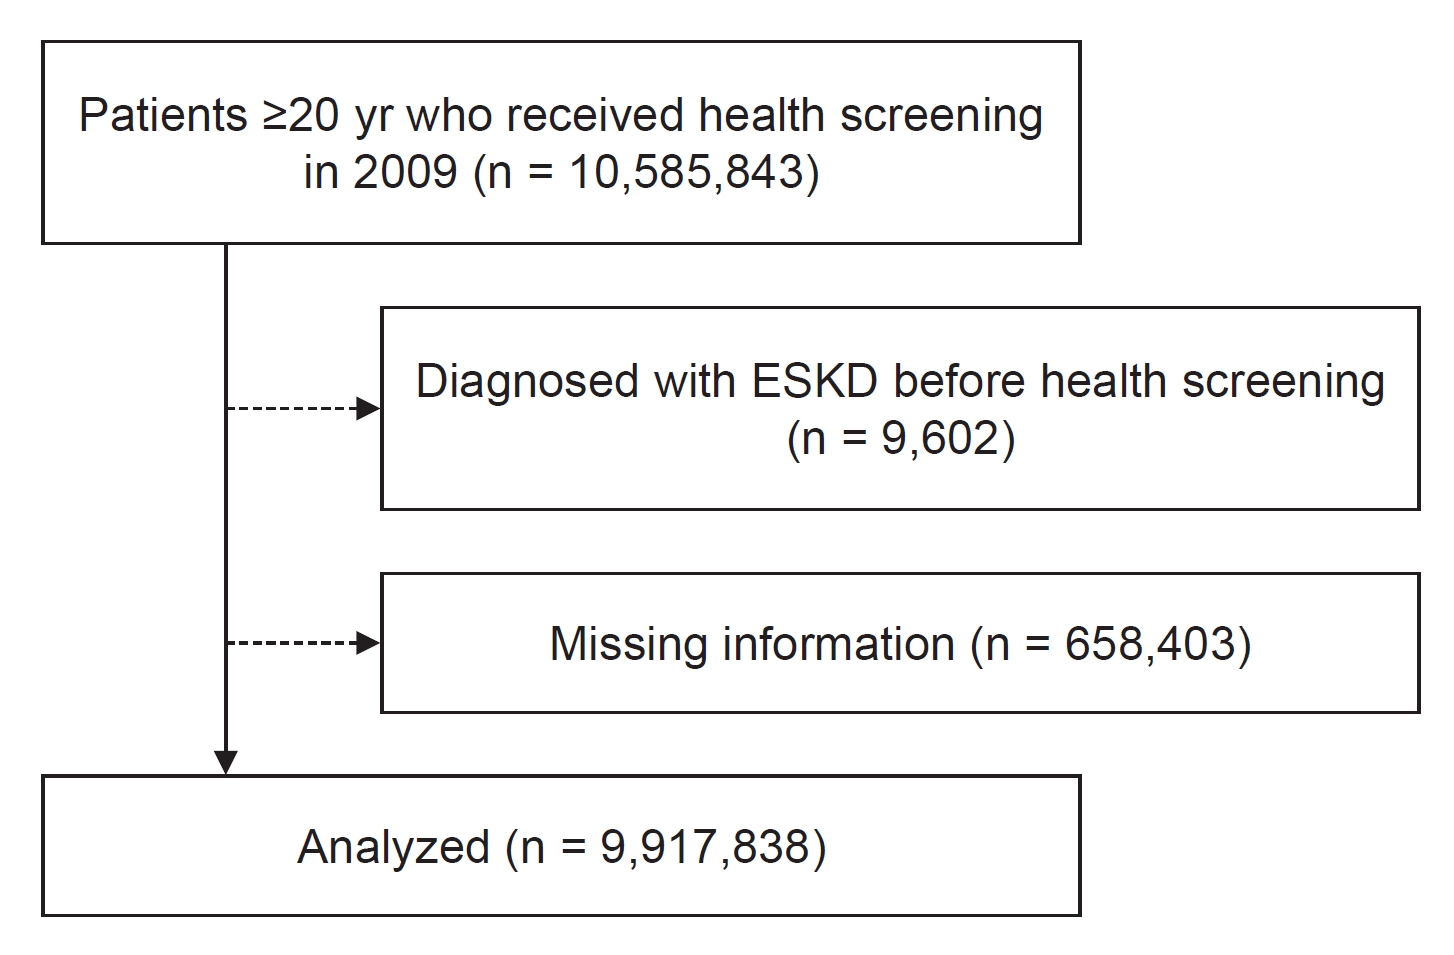
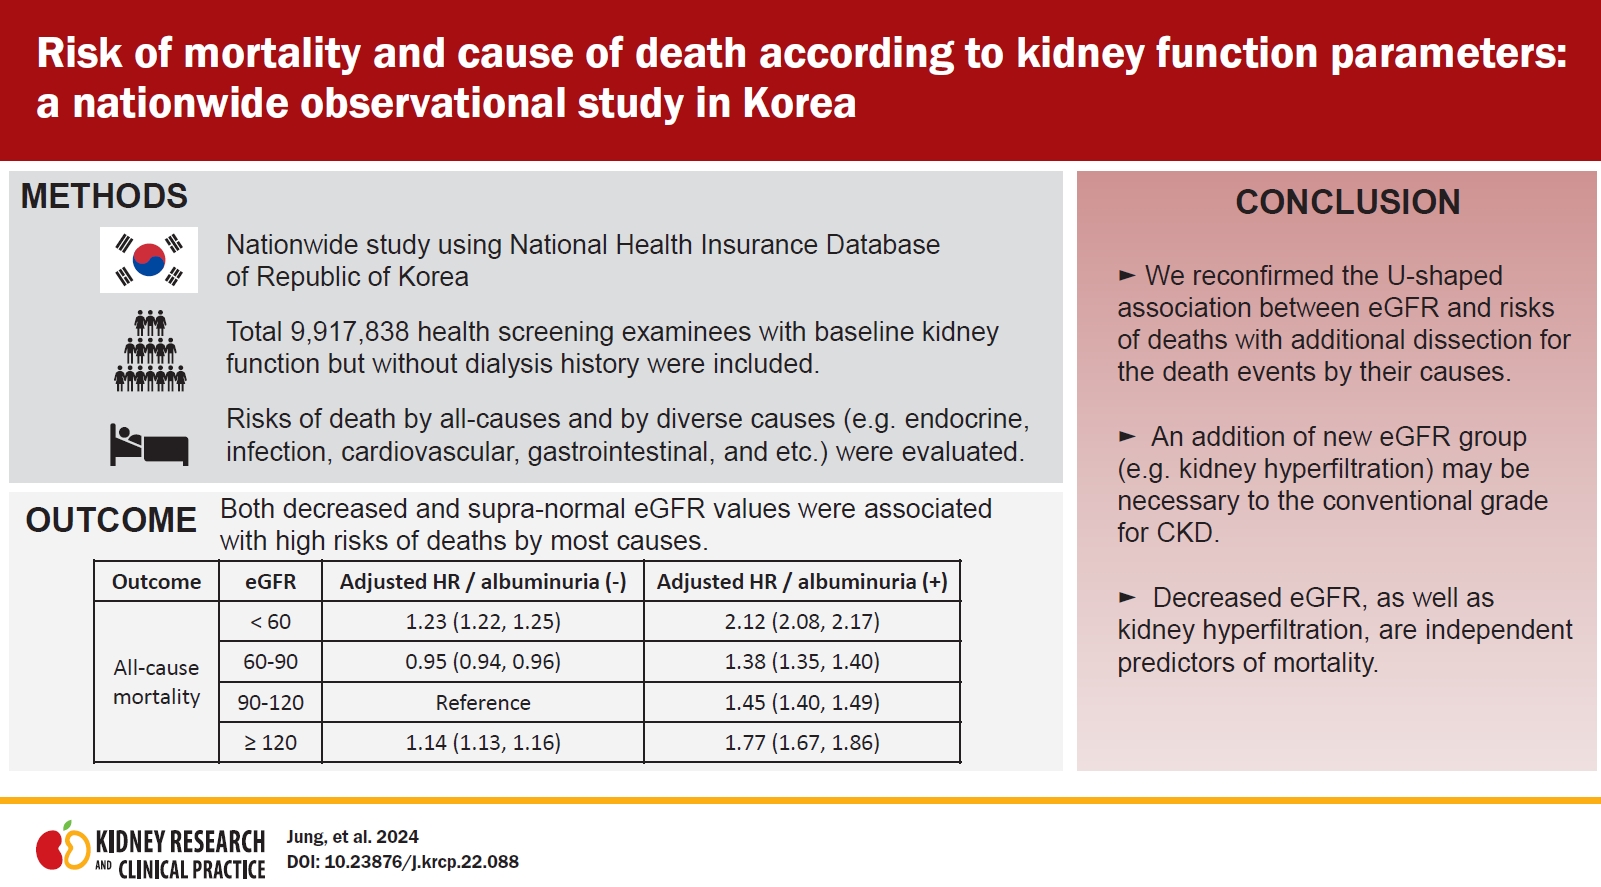
We aimed to investigate the association between kidney function parameters and mortality risk in the general population of Korea, we screened 10,585,843 adults (aged ≥20 years) examinees who underwent a national health screening conducted in 2009. We excluded 1) 9,602 individuals previously diagnosed with end-stage kidney disease, because kidney function parameters are different in those who have undergone dialysis or transplantation, and 2) 658,403 individuals with missing data. In the final study dataset, 9,917,838 individuals with available baseline kidney function measurements were included (Fig. 1).
Study exposures
The study exposures were eGFR and dipstick albuminuria, which were measured in national health screenings. As the main exposure category, eGFR values were grouped as <60, 60–90, 90–120, and ≥120 mL/min/1.73 m2. eGFR was estimated using the Modification of Diet in Renal Disease (MDRD) equation based on creatinine values measured by the Jaffe method. Albuminuria categories were defined as negative/trace, 1+, 2+, and 3+/4+ values.
Data collection
The NHID provided the baseline characteristics, including age, sex, low-income status, history of smoking, drinking, physical activity, history of diabetes mellitus, hypertension, body mass index, blood pressure, and baseline laboratory parameters, including hemoglobin levels, fasting glucose values, and lipid profiles, of the study subjects. Low-income status was defined as income below the 20th percentile of the country. History of underlying diabetes mellitus, hypertension, and hyperlipidemia was inferred from the diagnostic codes of International Classification of Diseases, 10th revision (ICD-10) and the prescribing history of related medications. The specific ICD-10 codes used for comorbidities were as follows: for diabetes, ICD-10 codes of E10 (type 1 diabetes mellitus), E11 (type 2 diabetes mellitus). E12 (Malnutrition-related diabetes mellitus), E13 (Other specified diabetes mellitus), and E14 (unspecified diabetes mellitus); and for dyslipidemia, ICD-10 code of E78 (disorders of lipoprotein metabolism and other lipidemias). Lastly, ICD-10 codes for hypertension were I10 (essential hypertension), I11 (hypertensive heart disease), I12 (hypertensive renal disease), I13 (hypertensive heart and renal disease), and I14 (secondary hypertension). A heavy alcohol drinker was defined as an individual drinking more than 30 g of alcohol per day, and a mild drinker was defined as an individual consuming 0–30 g of alcohol per day. Regular physical activity was defined as moderate-intensity physical activity ≥5 days or vigorous-intensity physical activity ≥3 days per week. Information related to physical activity degree was collected through a questionnaire used in national health screenings [11].
Study outcomes
The primary outcome was the cause of death, which was identified through death certificates. The cause of death was classified as the primary cause of death based on ICD-10 diagnostic codes (Supplementary Table 1, available online). Study follow-up was performed until December 31, 2019.
Statistical analysis
We expressed categorical variables as numbers (percentages) and continuous variables as the mean (± standard deviation). We performed Cox regression analysis to investigate the association between kidney function exposures and risk of death by specific causes. To handle potential confounding effects, we constructed multivariable regression models. The full model was adjusted for age, sex, smoking, alcohol consumption, physical activity, body mass index, systolic blood pressure, history of diabetes mellitus, hypertension, hyperlipidemia, fasting glucose, and total cholesterol. In addition, in the multivariable model assessing eGFR as the exposure variable, dipstick albuminuria was included as an additional adjustment variable, and eGFR was included in the adjusted variables when albuminuria was assessed as the exposure variable. Statistical significance was asserted at a two-sided p-value of <0.05. Statistical analyses were performed using SAS software version 9.4 (SAS Institute Inc.).
Results
Baseline characteristics
A comparison of baseline characteristics between eGFR groups is presented in Table 1. The higher eGFR group had a greater proportion of individuals of younger age and male sex. The group with a higher eGFR tended to have a lower body mass index and included a higher proportion of current smokers and heavy drinkers. In addition, the high eGFR group had a more favorable lipid profile.
On the other hand, the lower eGFR group had a higher proportion of individuals with underlying hypertension, diabetes, and hyperlipidemia. Impaired fasting glucose and cholesterol levels were higher and hemoglobin levels were lower in the group with low eGFR. In addition, the prevalence of albuminuria was more than two-fold in the group with eGFR <60 mL/min/1.73 m2 as in other eGFR groups.
Risk of all-cause death and death by specific causes according to kidney function parameters
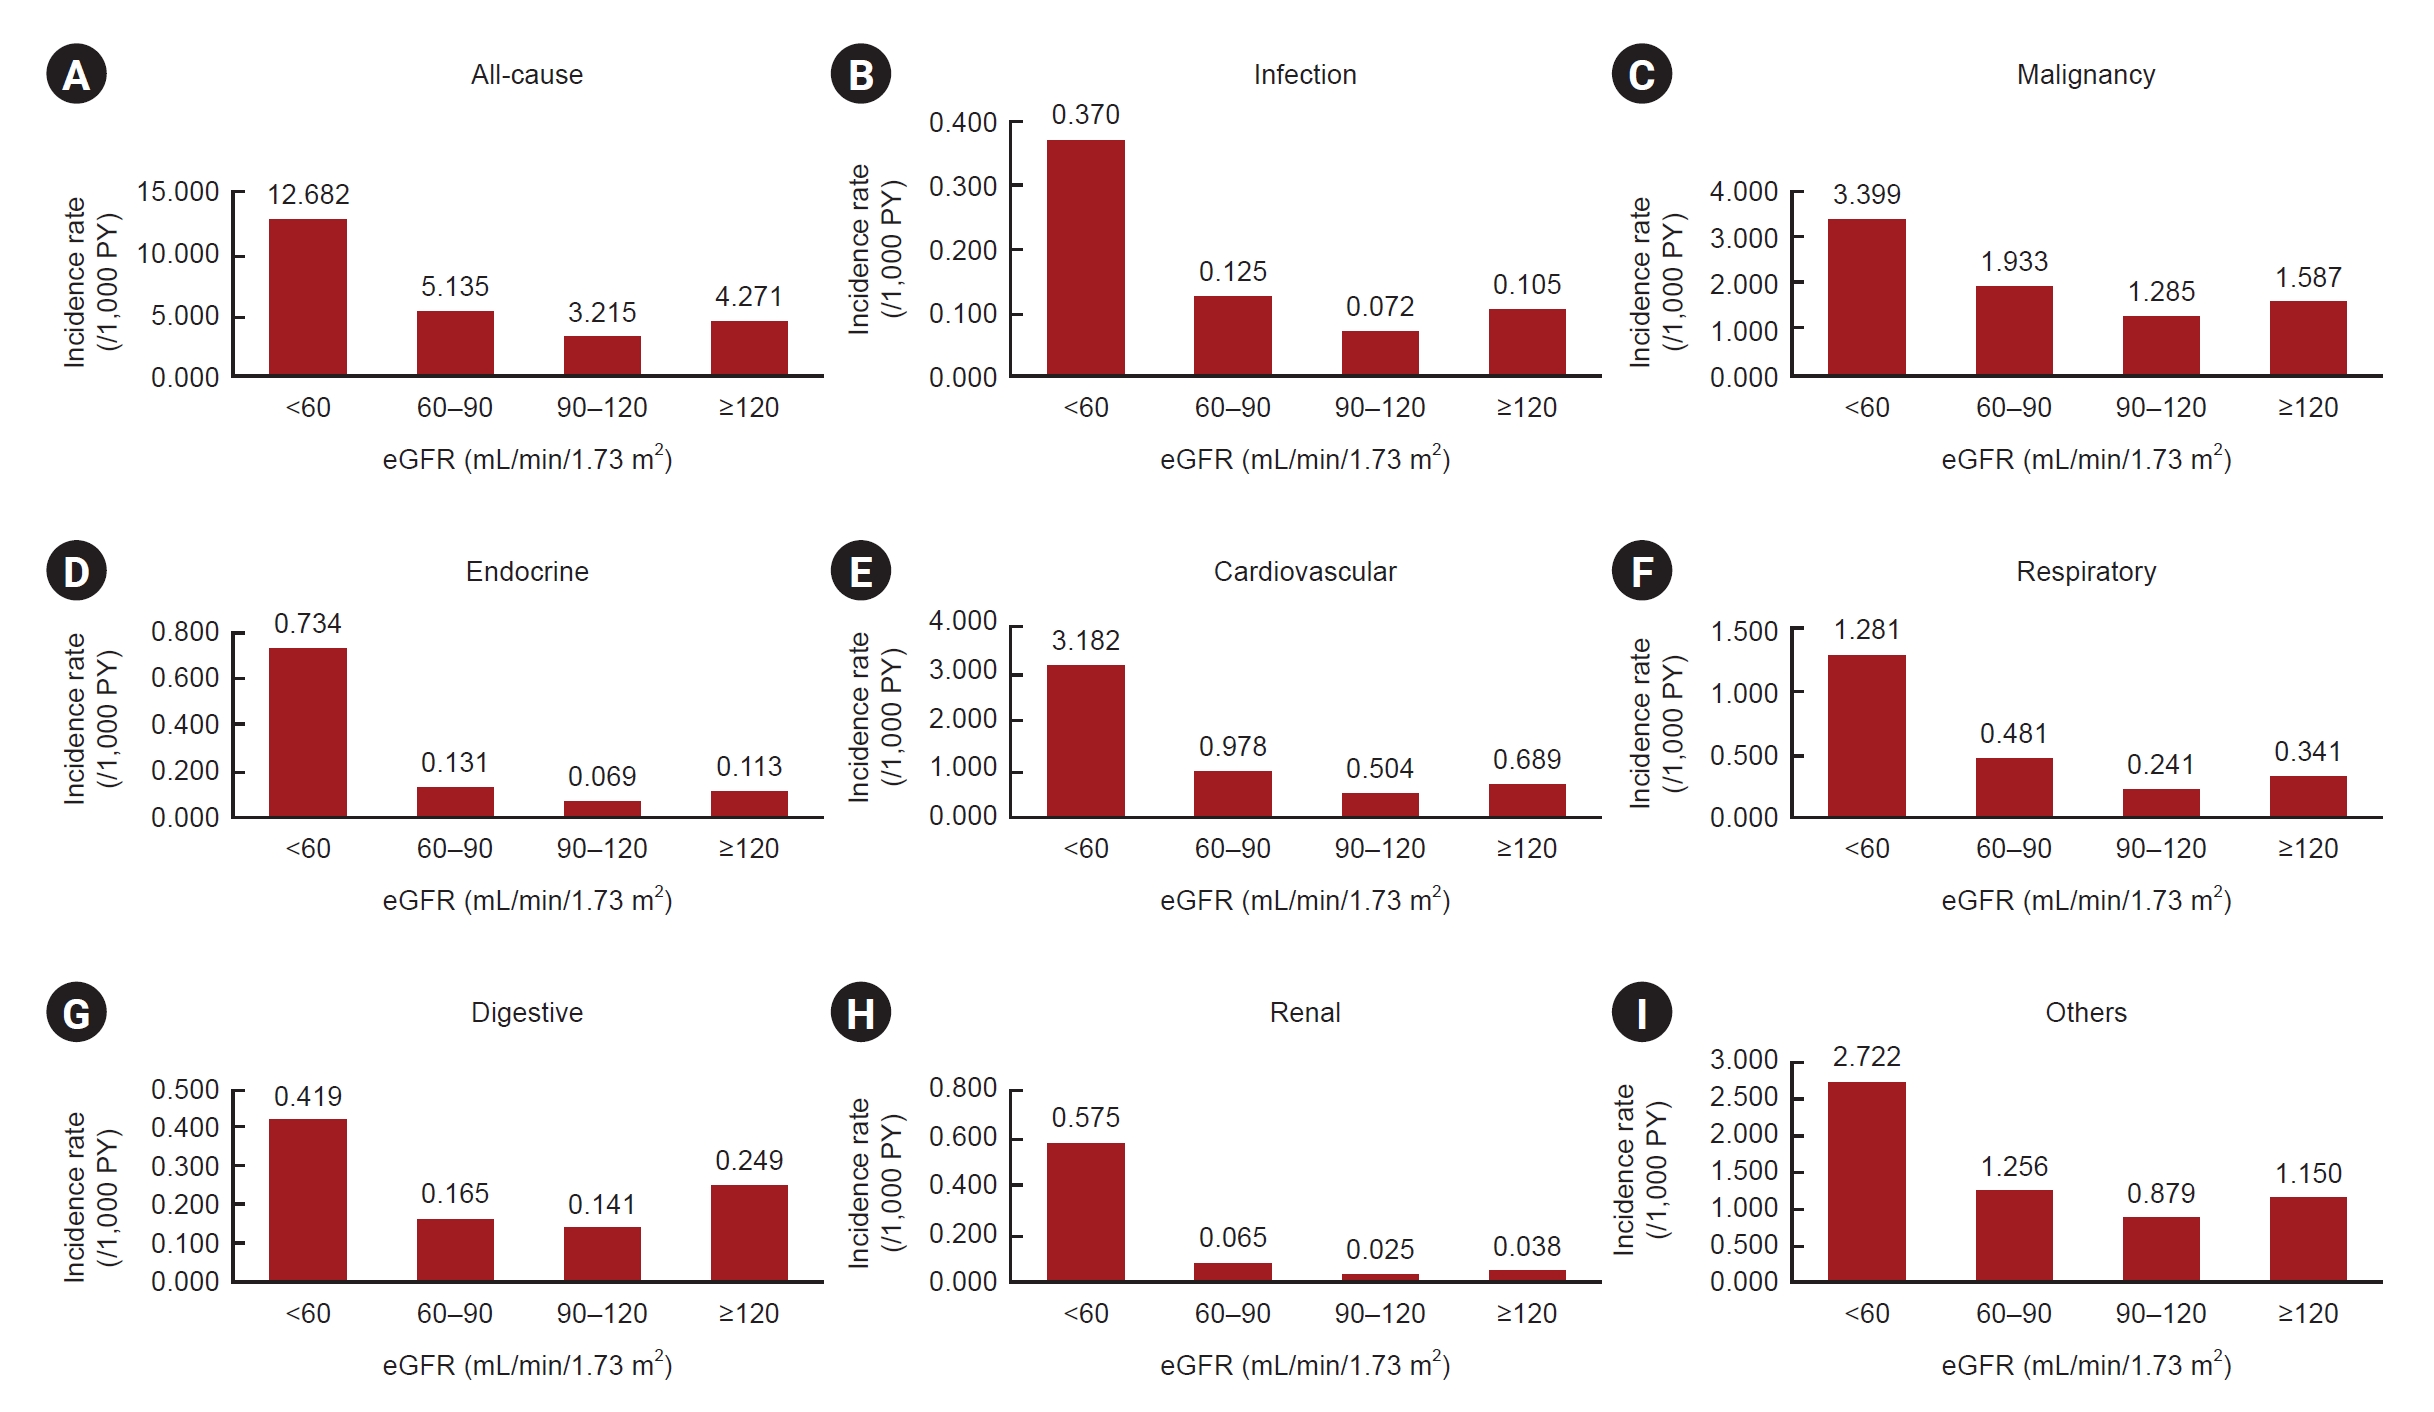
In the four eGFR categories, the incidence rates of death and the hazard ratios for the causes of death are shown in Table 2 and Fig. 2. In univariable regression analysis, hazard ratios were significantly higher in those with lower eGFR than in those with eGFR of 90–120 mL/min/1.73 m2. In addition, the group with eGFR ≥120 mL/min/1.73 m2 also showed a significantly higher risk of death. The results were significant for death by diverse causes, including death by malignancy, infection, cardiovascular, endocrine, respiratory, renal, and gastrointestinal disorders. When regression models were adjusted for various clinicodemographic characteristics, the overall results remained the same, and eGFR showed a U-shaped association with mortality risk by diverse causes, except that the risk of death by endocrine disorders became nonsignificant on multivariable analysis. Additionally, nonlinear associations in multivariable analysis between eGFR and causes of death are shown in Fig. 3.
When we further divided cancer events into specific cancer types (Supplementary Table 2, available online), the population with eGFR ≥120 mL/min/1.73 m2 showed a significantly higher risk of cancer-specific death from oral cancer, esophageal cancer, stomach cancer, colorectal cancer, and lung cancer. The risk of death from biliary or pancreatic cancer was also higher for those with supranormal eGFR ranges; however, these associations did not reach statistical significance. In addition, the hazard ratios were higher for the risk of death by renal cancer, bladder cancer, and cervical cancer in those with GFR <60 mL/min/1.73 m2. Those with a lower eGFR showed a higher risk of cancer-related death; thus, the overall association between eGFR and death by specific cancers showed a U-shaped association.
Risk of all-cause death and death by specific causes according to baseline albuminuria
When we included the albuminuria results as the exposure, albuminuria was significantly associated with all-cause death and death by various causes (Table 3). Endocrine- and renal-related death showed a prominent linear association with albuminuria.
Similar to the above findings, there was a significant association between albuminuria and death by specific cancers (Supplementary Table 3, available online). In particular, linear associations between albuminuria and death by specific cancers were observed in oral cancer, esophageal cancer, stomach cancer, colorectal cancer, liver cancer, biliary cancer, pancreatic cancer, lung cancer, renal cancer, bladder cancer, lymphoma, multiple myeloma, and prostate cancer. There were also several exceptions: leukemia, breast cancer, and cervical cancer showed an inverted U-shape according to albuminuria, and a U-shape was observed for ovarian cancer.
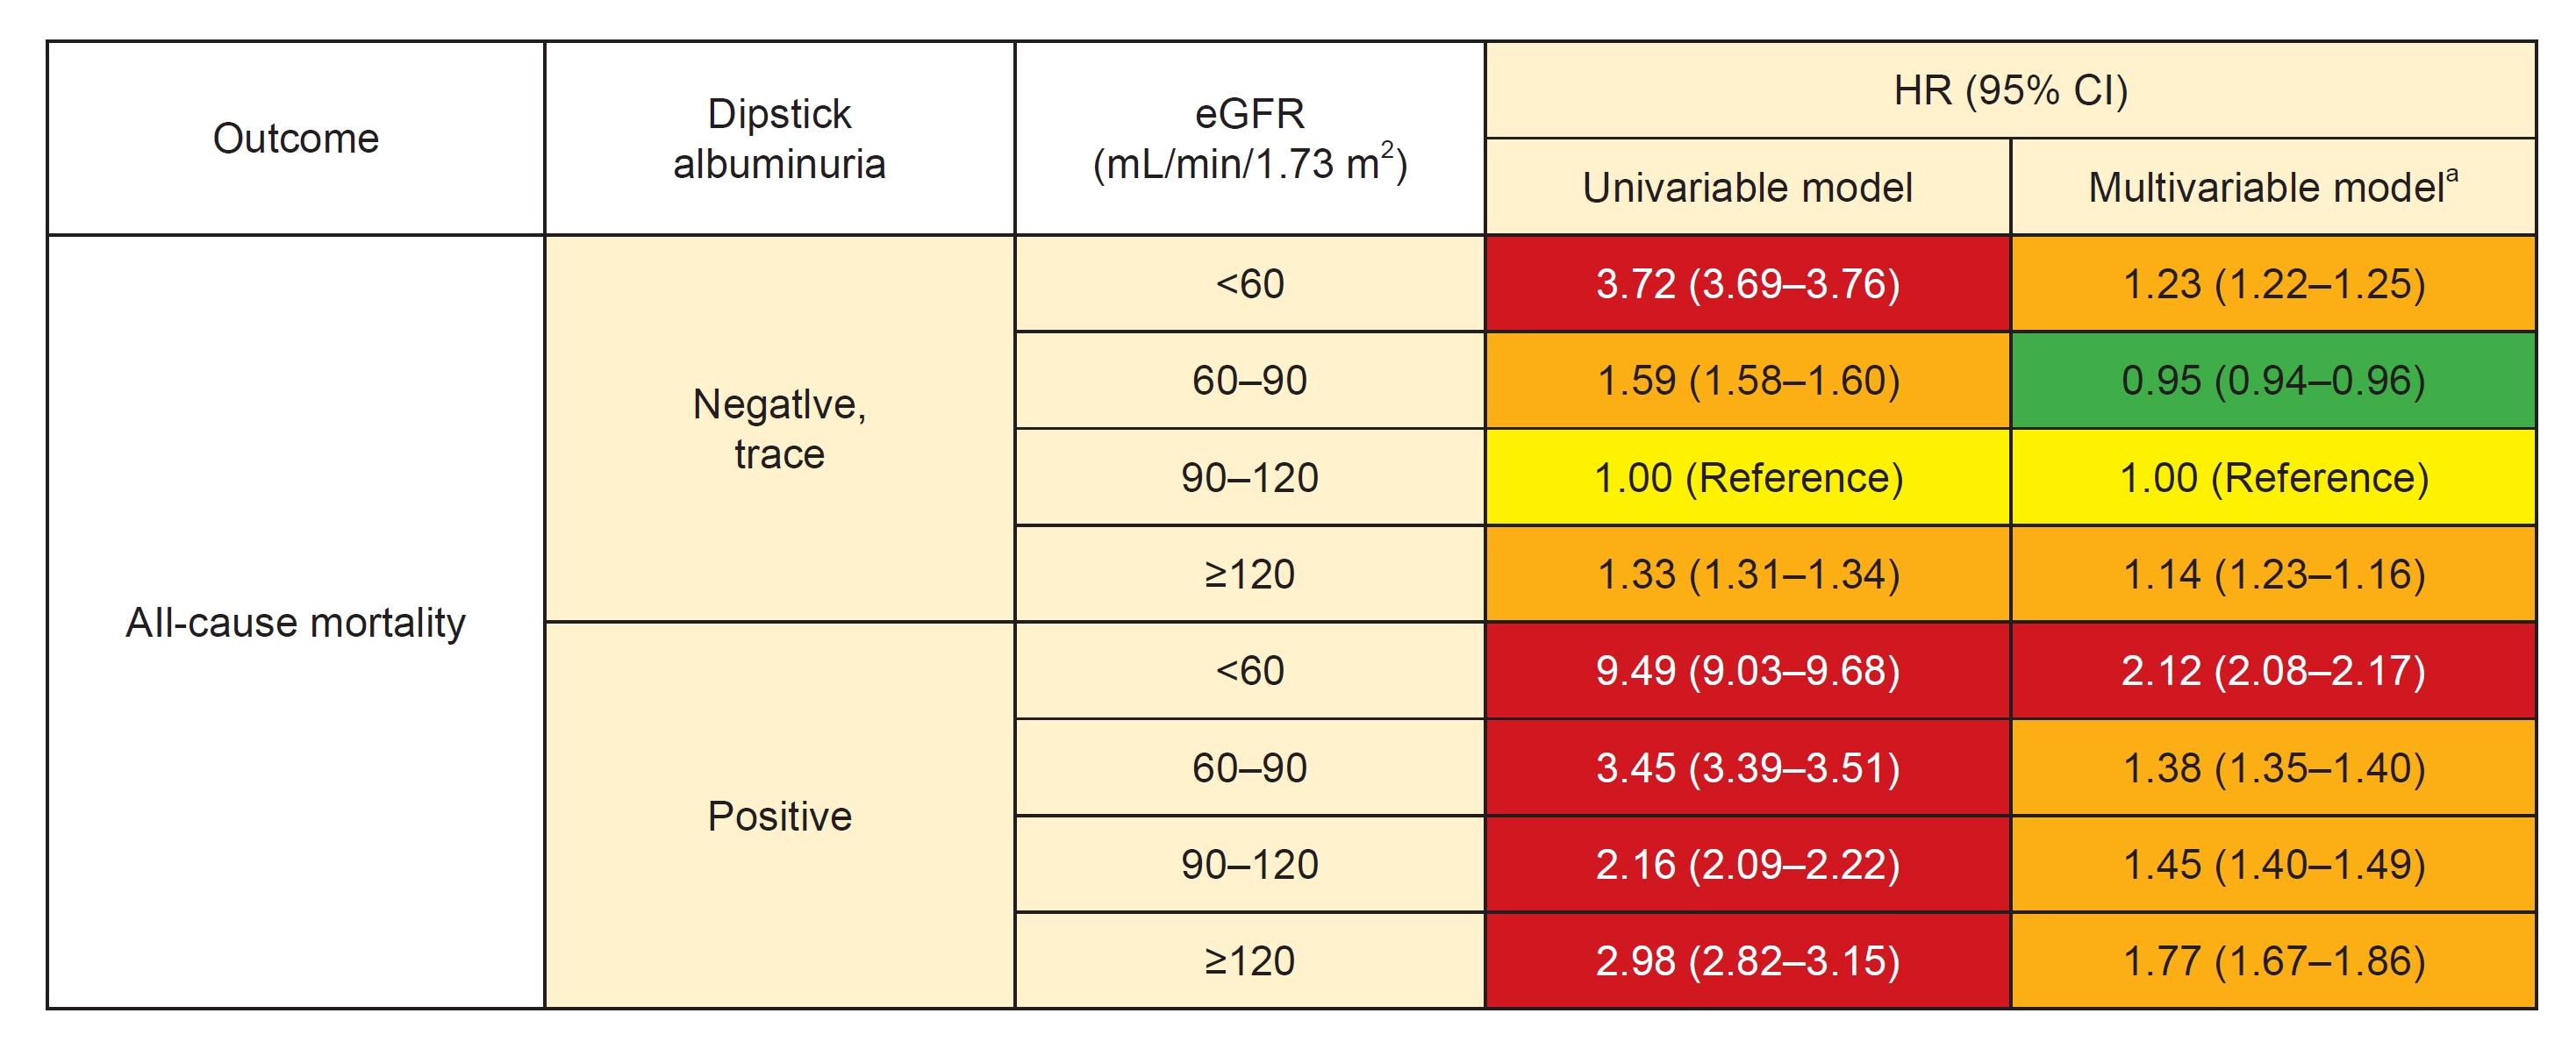
Risk of death by specific causes according to baseline estimated glomerular filtration rate and albuminuria
Fig. 4 shows the heatmap according to risk relationships for all-cause mortality. The risk of mortality was divided by eGFR according to the presence or absence of albuminuria, as shown in Table 4. Most causes of death showed a U-shaped association with eGFR regardless of the presence or absence of albuminuria. Namely, both eGFR ranges <60 and ≥120 mL/min/1.73 m2 were associated with a higher risk of death by various causes. The only finding that varied was in the multivariable model of the risk of death by malignancy. In those without albuminuria, the risk of cancer death was higher in those with higher eGFR (eGFR of 90–120 or ≥120 mL/min/1.73 m2), while those with eGFR <60 or 60–90 mL/min/1.73 m2 showed lower adjusted risk of cancer death.
Those with baseline albuminuria, regardless of eGFR, showed a significantly higher risk of all-cause mortality and death by diverse causes than those with eGFR in the reference range (90–120 mL/min/1.73 m2) without albuminuria.
Discussion
This study using a nationwide population-based database demonstrated an association between the risk of various causes of death and eGFR or albuminuria. We found that both lower and higher eGFR ranges were independently associated with mortality by diverse causes. The overall risk of death was higher in those with albuminuria and showed an additive impact on eGFR. Overall, the results demonstrated the clinical significance of kidney function parameters related to the risk of death by various causes.
A U-shaped association between the risk of mortality and eGFR was observed in previous studies [4]. Confirmation of the U-shaped association between eGFR and the risk of death showed that kidney hyperfiltration is associated not only with cardiovascular disease but also with multiple causes of mortality, including cancer-, infection-, endocrine-, digestive-, and respiratory disorder-associated death. Furthermore, the risk of death was high in the presence of albuminuria within all categories of mortality. The major strengths of our study are that 1) we enrolled one of the largest cohorts including measurements for important kidney function parameters; 2) we performed complete follow-up using a nationwide death registry; and 3) we identified various causes of death based on death certificates. Based on our study results, clinicians should be aware of the clinical significance of kidney function parameters measured in general health screenings, which are closely associated with survival, including death by diverse causes.
The KDIGO (Kidney Disease: Improving Global Outcomes) guidelines provide a heatmap summarizing the association between kidney function parameters and prognosis [12]. However, the previous version did not include the clinical significance of a supranormal eGFR, frequently defined as ≥120 mL/min/1.73 m2 or similar values, although the importance of kidney hyperfiltration has been reported repeatedly [7,13,14]. In recent reports, kidney hyperfiltration, determined by eGFR or by measured GFR values [7], was considered another state of kidney function impairment leading to a rapid decline in kidney function [15]. We used an eGFR interval of 30 mL/min/1.73 m2 and found that those with eGFR ≥120 mL/min/1.73 m2 showed higher mortality risk than those within the reference range. However, there is currently no precise definition of hyperfiltration, which should be established. Increased proximal tubular sodium-glucose reabsorption activity or hyperactivity of the renin-angiotensin-aldosterone system may be the cause of kidney hyperfiltration, which is related to a worse prognosis [16]. This is supported by the fact that medications such as angiotensin receptor blockers or sodium-glucose cotransporter inhibitors reduce kidney hyperfiltration and improve patient prognosis [17]. As our study emphasizes the clinical significance of supranormal eGFR in death by various causes, we believe that supranormal eGFR should be defined by clear thresholds in clinical guidelines so that clinicians can appropriately interpret this most widely assessed kidney function parameter. We suggest clinicians first evaluate related illnesses in individuals showing kidney hyperfiltration and intervene when necessary (e.g., prescribe renin-angiotensin-aldosterone system blockers) based on the assessment findings.
The prognostic importance of albuminuria, which has been reported in various clinical conditions, was confirmed in our study [18–20]. Regardless of baseline eGFR values, those with positive dipstick albuminuria showed a higher risk of death, including by various causes. Clinicians should note the linear relationship between ordinal dipstick albuminuria results and the risk of most causes of death. This relationship emphasizes the clinical utility of the dipstick albuminuria tests used in general health screenings, despite it being a semi-quantitative method.
As hypotheses explaining the mechanism related to the associations between kidney function parameters and noncardiovascular death. First, impairment of kidney function may be closely linked to immune dysfunction, even from the early stages, and could hinder appropriate body responses to infectious or cancerous conditions. Second, kidney dysfunction can cause difficulty in optimally managing diverse diseases, as medication pharmacokinetics/dynamics are altered in the state of kidney function impairment. Third, kidney dysfunction is associated with disturbance in systemic neurohormonal responses and impairment in certain pathways that have helpful effects on body homeostasis. Although this study cannot prove the underlying mechanism of the identified associations of kidney function parameters with death by diverse causes, such pathways should be investigated in future research focusing on the association between kidney function impairment and noncardiovascular diseases.
This study has several limitations. First, there is a sensitive issue in that the MDRD eGFR equation and dipstick test are not accurate as the kidney function parameters. Namely, eGFR remains an estimated parameter, and creatinine levels are affected by non-kidney factors such as muscle mass or diet. The MDRD study equations underestimate measured GFR in the range of GFR ≥60 mL/min/1.73 m2 in healthy individuals or overestimate measured GFR in individuals with reduced muscle mass. Overestimated GFR in individuals with reduced muscle mass may bias the identified association in supranormal eGFR ranges. Also, dipstick albuminuria is not the gold-standard method to quantify proteinuria, as the dipstick test has limited quantitative accuracy [21]. The remaining possibility of intercenter variation and intervisit variation should also be considered. Next, the study population was limited to a single nationality; thus, the generalizability of the results should be confirmed by future studies. Lastly, the studied population might have suffered from the healthy volunteer bias, as we screened all those who received general health screenings, and the proportion of those with overt eGFR reduction was small.
In conclusion, we reconfirmed the correlation between eGFR, albuminuria, and mortality. The association was significant even for death by various causes, further highlighting the clinical importance of kidney hyperfiltration. In addition, for the evaluation of the state of kidney function impairment, a standard grading system for supranormal GFR is needed in addition to conventional grading for CKD. Healthcare providers should keep in mind that albuminuria and decreased eGFR, as well as renal hyperfiltration, are independent predictors of mortality.

 PDF Links
 PubReader
 ePub Link
 Full text via DOI
 Download Citation
 Supplement table 1
 Print
Print


")


