Kidney Res Clin Pract > Volume 40(3); 2021 > Article
Park, Kang, Chang, Jo, Park, Yoo, Kang, and Han: Mixed- versus predilution hemodiafiltration effects on convection volume and small and middle molecule clearance in hemodialysis patients: a prospective randomized controlled trial

Abstract

Background

The use of newly developed mixed-dilution hemodiafiltration (HDF) can supplement the weaknesses of pre- and postdilution HDF. However, it is unclear whether mixed-HDF performs well compared to predilution HDF.

Methods

We conducted a prospective, open-labeled, randomized controlled trial from two hemodialysis centers in Korea. Between January 2017 and September 2019, 60 patients who underwent chronic hemodialysis were randomly assigned at a 1:1 ratio to receive either predilution HDF (n = 30) or mixed-HDF (n = 30) for 6 months. We compared convection volume, changes in small- and medium-sized molecule clearance, high-sensitive C-reactive protein (hs-CRP) level, and dialysis-related parameters between the two dialysis modalities.

Results

A mean effective convection volume of 41.0 ± 10.3 L/session in the predilution HDF group and 51.5 ± 9.0 L/session in the mixed-HDF group was obtained by averaging values of three time-points. The difference in effective convection volume between the groups was 10.5 ± 1.3 L/session. This met the preset noninferiority criteria, suggesting that mixed-HDF was noninferior to predilution HDF. Moreover, the β2-microglobulin reduction rate was greater in the mixed-HDF group than in the predilution HDF group, while mixed-HDF provided greater transmembrane pressure. There were no significant between-group differences in Kt/V urea levels, changes in predialysis hs-CRP levels, proportions of overhydration, or blood pressure values. Symptomatic intradialytic hypotension episodes and other adverse events occurred similarly in the two groups.

Conclusion

Use of mixed-HDF was comparable to predilution HDF in terms of delivered convection volume and clinical parameters. Moreover, mixed-HDF provided better β2-microglobulin clearance than predilution HDF.

Introduction

Remarkable technical advances have been made with regard to dialysis membranes and hemodialysis (HD) machines in recent decades. In spite of such improvements, mortality rates remain high, and the overall 5-year survival rate in patients of kidney failure with replacement therapy (KFRT) is 30% in the United States [1]. Unfortunately, dialysis treatment alone cannot improve clinical outcomes, and a comprehensive approach is required. Such an approach should include blood pressure control, appropriate body fluid control, elimination of middle-sized molecules, removal of inflammatory substances, osteoporosis and anemia management, and the provision of sufficient nourishment. Hemodiafiltration (HDF) can facilitate the achievement of these diverse goals [25]. In fact, HDF has many advantages over conventional HD, which include its higher clearance of low and middle molecules and inflammatory cytokines, improvement of anemia, and maintenance of hemodynamic stability [6,7]. Notably, recent clinical trials have shown that HDF increased patient survival rates compared to conventional HD, especially in patients who received high-volume convective therapy [7,8].
There are two representative HDF modes: pre- and postdilution. Each has strengths and limitations. Postdilution HDF is the most effective way to maximize molecule clearance. However, blood concentrations can be elevated using HDF, which can cause thrombosis. On the other hand, predilution HDF can resolve this problem [9] but requires about three times more purified water than postdilution HDF and does not guarantee maximal clearance. Therefore, the use of mixed-HDF emerged to compensate for the shortcomings of the other two HDF modalities [10,11]. In mixed-HDF, the substitution fluid required for dialysis is injected at both the entrance and exit of the dialysis membrane. Using a continuous monitoring and feedback system to assess transmembrane pressure (TMP) in the dialyzer, dialysis is automatically switched to either pre- or postdilution HDF mode and optimizes TMP during HD [12]. Despite these advantages of mixed-HDF, clinical studies testing the efficacy of mixed-HDF versus pre- or postdilution HDF are lacking. Several studies have reported that the efficiencies of small- or large-sized molecule removal between mixed-HDF and pre- or postdilution HDF are comparable. Also, TMP is maintained at a more stable level in mixed-HDF compared with postdilution HDF [1315]. In parts of East Asia such as Japan, most HD units tend to use predilution HDF due to intrinsic problems with postdilution HDF, including high TMP and the tendency to promote clot formation [11,16]. This is also true in Korea, where utilization of predilution HDF is increasing [8]. However, whether mixed-HDF performs well in comparison to predilution HDF remains unknown. Therefore, we conducted a randomized controlled trial to compare predilution HDF with mixed-HDF in Korean patients with KFRT.

Methods

Study design and participants

This study was a prospective, randomized, open-label trial conducted at two hospitals in Korea (Severance Hospital, Seoul; National Health Insurance Service [NHIS] Ilsan Hospital, Goyang). Individuals aged 20 to 75 years who had received HD 3 times weekly for ≥3 months were allowed to participate in the study. Exclusion criteria were as follows: (1) life expectancy < 12 months, (2) dialysis treatment received for less than 3 months or initiated due to acute kidney injury, (3) current history of malignancy, (4) pregnancy, (5) contraindication to anticoagulants, (6) systemic blood pressure < 90 mmHg, and (7) previously received HDF before enrollment. The study was conducted in accordance with the principles of the Declaration of Helsinki, and the study protocol was approved by the Institutional Review Board at each center (No. 4-2016-0702 for Severance Hospital; No. 2018-11-002 for NHIS Ilsan Hospital). All participants provided informed consent when enrolled in the study.
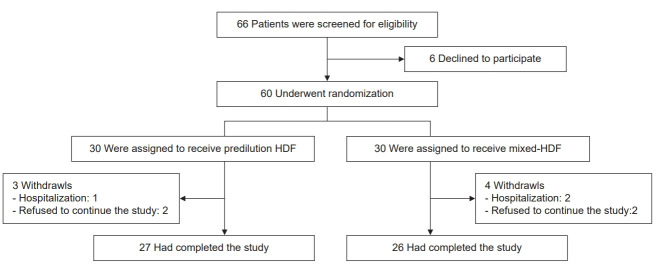
Between January 2017 and December 2019, a total of 66 patients was screened. After a 1-month screening period, 60 patients were randomly assigned at a 1:1 ratio to receive either mixed-HDF or predilution HDF for 6 months. The random assignment was performed using a web-based, random allocation table that considered institution, sex, and causative disease of KFRT (Fig. 1).

Treatment procedures

All participants received thrice-weekly dialysis for at least 3 hours. Both groups were treated with the 5008 or 5008S dialysis system using CorDiax dialyzer (Fresenius Medical Care, Bad Homburg, Germany) and maintained a blood flow rate of 250 mL/min and dialysate flow rate of 700 mL/min. TMP was not expected to exceed 400 mmHg in either predilution HDF or mixed-HDF patients. Prescribed ultrafiltration rate and substitution fluid in both predilution and mixed-HDF groups were calculated using previously reported equations [17].

Study variables

The demographic and medical history of participants was collected at enrollment. We recorded dialysis-related information at baseline and every 3 months thereafter. Information collected included dialyzer characteristics, dialysis time, dialysis machine, blood and dialysate flows, substitution volume, TMP, height, dry body weight, pre- and postdialysis body weight, delivered convective volume, net ultrafiltration volume, and predialysis systolic and diastolic blood pressure. Further, the following laboratory data were measured at 0, 3, and 6 months after initiation of this research: hemoglobin, hematocrit, white blood cell differential count, platelet count, predialysis urea concentration, creatinine, sodium, potassium, concentration of bicarbonate using total carbon dioxide, calcium, phosphate, intact parathyroid hormone, high-sensitivity C-reactive protein (hs-CRP), albumin, and fasting glucose. To determine the reduction ratio (RR) of β2-microglobulin at pre- and postdialysis, serum β2-microglobulin level was measured at 0 and 6 months. All laboratory tests were performed locally using standard procedures in certified laboratories. The RR of β2-microglobulin was calculated using pre- and postdialysis serum β2-microglobulin levels and the following formula: RR (%) = [1 − (concentration of serum β2-microglobulin obtained after dialysis/concentration of serum β2-microglobulin obtained before dialysis)] × 100. Extracellular fluid and total body water volumes were measured via multiple frequency bioelectrical impedance analysis (BCM; Fresenius Medical Care). Measured extracellular fluid volume is presented as overhydrated (L). Measured relative extracellular fluid volume considering total body water fluid volume is presented as overhydrated-extracellular fluid (%).

Outcomes

The primary outcome assessed was the delivered convection volume difference between mixed-HDF and predilution HDF treatment methods [18]. Since the predilution mode of therapy used twice as much replacement fluid as the postdilution mode, we calculated effective convection volume ratios for mixed-HDF as follows: effective convection volume = substitution volume in predilution mode + 2 × substitution volume in postdilution mode + ultrafiltration volume. In addition, we compared convection volume adjusted for body surface area between two groups. Secondary outcomes included middle- (RR of β2-microglobulin) and small-sized molecule clearance (Kt/V urea), changes in predialysis levels of an inflammatory marker (hs-CRP) and phosphate, TMP, blood pressure, and intradialysis tolerance.

Power calculation

The total substitution fluid volume is always greater when using predilution HDF versus mixed-HDF. Because mixed-HDF uses both pre- and postdilution modes during the dialysis session, we hypothesized that the effective convective volume in mixed-HDF would be 120% of that of predilution HDF, and the difference in convective fluid would be approximately 7.5 L, which was used as a noninferiority limit. Thus, it was determined that 25 patients within each group were needed to detect a 10-L delivered convective volume difference between the two groups assessed with a power of 90% and an α-value of 0.05. Considering a dropout percentage of 20%, the number needed per group was 30 patients.

Statistical analyses

All data were analyzed according to the per-protocol principle. Data are expressed as mean ± standard deviation or as median (range) for skewed data. Baseline clinical data and laboratory findings, measured at the time of random group assignment, were compared using the t-test and chi-square test. In addition, changes in primary and secondary outcome parameters were analyzed using repeated measures analysis of variance (ANOVA). Continuous variables were assessed using a mixed model approach for repeated measurements, after adjustment for age, sex, serum albumin and hemoglobin levels, systolic blood pressure (SBP), predialysis serum β2 microglobulin concentration, and dialysis blood flow. A two-sided significance test was used throughout the analysis, and values of p < 0.05 were considered significant. All statistical analyses were performed using the STATA version 16 statistical package (StataCorp, College Station, TX, USA).

Results

Baseline patient characteristics

The baseline characteristics of patients and treatment parameters are summarized in Table 1. The mean age was 59.7 years, and 50.9% of study participants were male. All patients had been on dialysis treatment for 2 years (range, 1–4 years). Overall, there were no differences in baseline characteristics observed between the two groups. However, the serum β2-microglobulin level of the mixed-HDF group was significantly higher than that of the predilution HDF group. Among dialysis parameters, dialysis time, TMP, dialysis flow rate, and net ultrafiltration did not differ between the two groups. However, the mixed-HDF group had slightly lower blood flow rate than the predilution HDF group.

Primary outcome

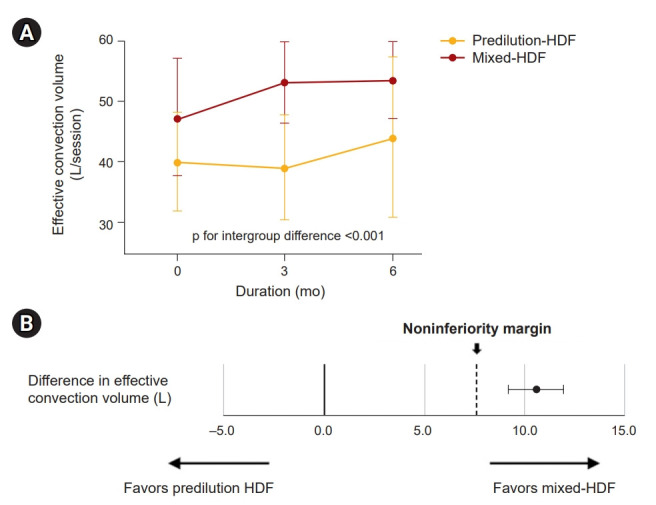
Table 2 and Supplementary Fig. 1A show convection volumes of the two HDF groups during the 6-month period considered. In the predilution HDF group, the mean convective volume determined by averaging values from three time points was 41.0 ± 10.3 L/session, and the convective volume was constantly delivered during follow-up. In the mixed-HDF group, the switch to predilution mode was successfully accomplished depending on TMP level during the dialysis session. In this group, the total effective convection volume delivered was 51.5 ± 9.0 L/session in the mixed-HDF group, which was approximately 20% higher than that of the predilution HDF group. The difference in effective convection volume between the two groups was 10.5 ± 1.3 L/session, which met our preset noninferiority criteria (Fig. 2B, Supplementary Fig. 1B). This finding suggests that mixed-HDF is comparable to predilution HDF with respect to convection volume. Repeated ANOVA analysis and linear mixed model assessment also showed that effective convection volume was greater in the mixed-HDF group than in the predilution HDF group throughout the study period. These results were similar when body surface area-adjusted volumes were compared (Table 2 and Fig. 2).

Secondary outcomes

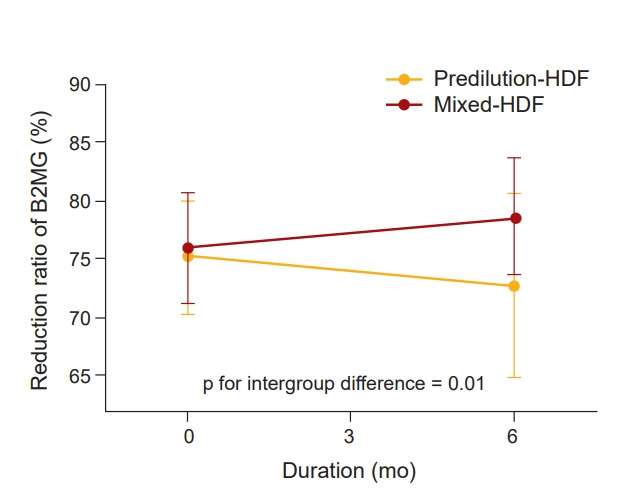
In secondary outcome analyses, we first compared middle- and small-molecule clearance rates of mixed-HDF and predilution HDF groups. The predialysis serum β2-microglobulin level was significantly higher in the mixed-HDF group than the predilution HDF group during the study period. However, serum β2-microglobulin level of the mixed-HDF group significantly decreased from the baseline value (25.4 ± 5.6 mg/L to 22.2 ± 4.4 mg/L), while they remained relatively constant in the predilution HDF group at the same time period (p for intergroup difference = 0.02) (Table 3, Supplementary Fig. 2A). The β2-microglobulin RRs at baseline did not differ between the two groups (75.2% ± 4.9% in the predilution HDF group vs. 76.0% ± 4.8% in the mixed-HDF group). The RR significantly decreased in the predilution HDF group at 6 months, whereas it increased in the mixed-HDF group (p for intergroup difference = 0.01) (Table 3, Fig. 3). Kt/V urea values, used as a traditional index for small-molecule clearance, were similar between the two groups throughout the study period (Table 3, Supplementary Fig. 2B). We also monitored TMP level during dialysis sessions because the mixed-HDF technique involves switching of HDF mode based on TMP level. The mixed-HDF group had consistently higher TMP level compared to the predilution HDF group during the 6-month study period (p for intergroup difference = 0.001) (Table 3, Supplementary Fig. 2C).
During the study period, there were no significant between-group differences in terms of serum hs-CRP, albumin, phosphate, sodium, potassium, and bicarbonate concentrations (Table 3). Out of 53 patients, 47 had available bioimpedance analysis data. As shown in Table 3, the proportions of overhydration status did not differ between the groups.
At baseline, SBP for the predilution HDF and mixed-HDF groups were 147 ± 25.7 and 148.1 ± 22.6 mmHg, respectively. SBP increased at 3 months relative to baseline but then decreased at 6 months relative to the increase observed at 3 months in both groups. The difference observed between the two groups did not reach statistical significance. DBP of both groups remained similar throughout the 6-month study period (Table 3). Most patients tolerated HDF therapy well, and the symptomatic adverse event rate was remarkably low. The most common adverse effect observed was an asymptomatic decrease in SBP by >10 mmHg during a dialysis session, which occurred in 44% of all patients. However, symptomatic intradialytic hypotension was rarely observed in either group (3.7% versus 1.3% in predilution and mixed-HDF, respectively). There were no differences in any other event rates observed between the two groups (Table 4).

Discussion

In this randomized controlled study, we demonstrated that mixed-HDF therapy produces outcomes similar to predilution HDF. Convective volume was delivered well in the mixed-HDF group, and the difference in effective convection volume met noninferiority criteria. We also showed that mixed-HDF more efficiently decreased β2-microglobulin circulating level compared with predilution HDF. There were no differences in removal rates of small molecules, nor were other clinical or biochemical parameter differences observed during the study period. All adverse events were minor and occurred similarly in the two groups. These findings suggest that mixed-HDF is comparable to predilution HDF with regard to convection volume delivery, and that it removes middle molecules more efficiently.
HDF has been established as effective dialysis therapy, and its use has many advantages over conventional HD. These include higher clearance of middle molecular weight uremic toxins, better maintenance of hemodynamic stability, greater removal of inflammatory cytokines, and better responsiveness to erythropoietin [19,20]. Several randomized controlled trials have demonstrated that HDF reduces all-cause mortality, and even cardiovascular mortality, compared with conventional HD when an optimal convective substitution fluid was used [2125]. Such proven benefits have resulted in the increased utilization of HDF in European countries [26]. There have been remarkable advances in HDF techniques, and several HDF methods have been implemented in clinical practice, including predilution, postdilution, and mixed modes. Most trials to date have tested the effects of postdilution HDF, and studies on other HDF modes are lacking. Interestingly, in East Asian countries, predilution HDF with a low access blood flow rate has been widely used [8]. A recently published observational study in Japan, where predilution HDF is preferred in most centers, suggested that this HDF mode was significantly associated with improved overall and cardiovascular survival compared with conventional HD [27].
Both pre- and postdilution HDF modes have pros and cons. Although the postdilution HDF mode, which is being recommended to most patients in Western countries, is associated with a highly efficient clearance of uremic toxins with a relatively small substitution volume, the limitation of the method is that blood flow should be maintained at a certain speed to reduce risk of blood clot formation. Patients in East Asian countries, who have relatively low blood flow of arteriovenous access, prefer predilution HDF mode to postdilution HDF, due to lower risk of clotting events in the former mode [6]. Recently, a new mode called mixed-HDF was developed to address the drawbacks of pre- and postdilution HDF. Mixed-HDF monitors optimal TMP and automatically switches to pre- or postdilution mode when the TMP level reaches a particular threshold, before a clotting issue occurs [15,28]. This process can compensate for the weaknesses of each HDF mode. Although few studies have compared the efficacy of mixed-HDF versus other HDF modes, Pedrini and De Cristofaro [2] reported that mixed-HDF had a better β2-microglobulin removal rate than postdilution HDF. In addition, de Sequera et al. [29] showed that mixed-HDF was comparable to postdilution HDF with regard to small and medium-sized and protein-bound molecule clearance.
Delivered convective volume is considered a crucial factor that influences HDF therapy. Mixed-HDF is a new concept of high-efficiency HDF in which predilution and postdilution modes are mixed, and it is difficult to compare quantitatively absolute substitution fluid with those of the predilution mode. Given that a greater volume of substitution fluid is required in predilution mode versus postdilution HDF mode, we developed the concept of using effective convection volume for quantitative comparison between the two groups. Since the predilution mode of HDF uses twice as much replacement fluid as does postdilution mode, we hypothesized that the effective convection volume via mixed-HDF mode consisted of a sum of the substitution volume in postdilution mode times two, substitution volume in predilution mode, and ultrafiltration volume. Although the absolute convection volume was higher in predilution HDF, we showed that the effective convection volume delivered by mixed-HDF was greater than that of predilution HDF. The effective convection volume from mixed-HDF was approximately 20% higher than that of predilution HDF. The optimal convection volume delivered by mixed-HDF remains unknown because no studies have yet examined mixed-HDF outcomes such as mortality or cardiovascular events based on convection volume. In this regard, the concept of effective convection volume might be an alternative tool for the comparison of convection volumes for predilution and mixed-HDF. Notably, differences in effective convection volume might result in improved β2-microglobulin clearance by mixed-HDF. This is important because the accumulation of middle molecules, such as β2-microglobulin, is an independent predictor of mortality [3032], and β2-microglobulin clearance correlates well with convection volume [33]. In addition, dialysis tolerance of patients was similar for the two HDF modes. All adverse events were minor, and the event rates of both groups were similar. Taken together, these findings suggest that mixed-HDF can be an alternative dialysis tool for patients who frequently experience dialysis-related symptoms such as intradialysis hypotension, muscle cramping, and arrhythmia [25].
This study has limitations. First, the sample size was small, and only two centers participated. Therefore, selection bias could not be excluded. Second, we could not determine optimal convection volume. It should be noted that many previous trials with postdilution HDF consistently showed improved patient survival rate compared with conventional HD in patients with adequately delivered convection volume. To date, there has been no randomized controlled trial that has assessed the delivered convection volume in patients given predilution HDF or mixed-HDF therapy. Future studies with larger sample sizes will be needed to address this. Third, we measured β2-microglobulin and hs-CRP levels as representative middle molecule and inflammatory markers, although other uremic toxins with deleterious effects exist. Because the predilution mode has an intrinsic limitation in the degree of clearance compared with postdilution HDF, the performance of mixed-HDF should be further tested using other molecules. Fourth, we used a simple equation of RR of β2-microglobulin, which was not calibrated for body fluid reduction during dialysis. However, as there was no significant difference in ultrafiltration volume between the predilution and mixed-HDF groups, ultrafiltration volume is unlikely to alter the outcomes. Finally, we did not evaluate albumin loss via dialyzer during the study. Albumin loss via HDF can differ depending on the dialyzer, dialysis modalities, and convection volumes. Previous studies have reported a wide range of albumin loss between 0.5 and 4.5 g per session in postdilution HDF [3436]. The amount of albumin loss in mixed-HDF is not well known. Although albumin loss is less severe in predilution HDF than in postdilution HDF, albumin loss via HDF can be especially important for patients with marked hypoalbuminemia. However, in this study, the two groups used the same dialyzer that has a very low albumin-sieving coefficient according to the manufacturer. Moreover, serum albumin levels were comparable between the two groups. Thus, albumin loss was unlikely to affect the study results.
In conclusion, we demonstrated that mixed-HDF performed well with regard to convective volume delivery and provided better middle molecule clearance than predilution HDF. For the implementation of mixed-HDF in clinical practice, further studies should explore whether the use of mixed-HDF is advantageous over other dialysis modes with regard to its cost-effectiveness and long-term outcomes.

Notes

Conflict of interest

Tae-Hyun Yoo is the Editor-in-Chief of Kidney Research and Clinical Practice and was not involved in the review process of this article. All authors have no other conflicts of interest to declare.

Funding

This study was supported by Fresenius Medical Care Korea.

Authors’ contributions

Conceptualization: SHH

Data collection and curation: All authors

Formal analysis: KSP

Funding acquisition: SHH

Investigation: KSP, WJ

Writing - original draft: KSP

Writing - review & editing: SHH

All authors read and approved the final manuscript.

References

1. Saran R, Robinson B, Abbott KC, et al. US Renal Data System 2018 Annual Data Report: Epidemiology of Kidney Disease in the United States. Am J Kidney Dis 2019;73(3 Suppl 1):A7–A8.
pmid pmc
2. Pedrini LA, De Cristofaro V. On-line mixed hemodiafiltration with a feedback for ultrafiltration control: effect on middle-molecule removal. Kidney Int 2003;64:1505–1513.
crossref pmid
3. Jirka T, Cesare S, Di Benedetto A, et al. Mortality risk for patients receiving hemodiafiltration versus hemodialysis. Kidney Int 2006;70:1524
crossref pmid
4. Pedrini LA, Cozzi G, Faranna P, et al. Transmembrane pressure modulation in high-volume mixed hemodiafiltration to optimize efficiency and minimize protein loss. Kidney Int 2006;69:573–579.
crossref pmid
5. Park KW, Kyun Bae S, Lee B, et al. The effect of on-line hemodiafiltration on heart rate variability in end-stage renal disease. Kidney Res Clin Pract 2013;32:127–133.
crossref pmid pmc
6. Ahrenholz P, Winkler RE, Ramlow W, Tiess M, Müller W. On-line hemodiafiltration with pre- and postdilution: a comparison of efficacy. Int J Artif Organs 1997;20:81–90.
crossref pmid pdf
7. Wizemann V, Külz M, Techert F, Nederlof B. Efficacy of haemodiafiltration. Nephrol Dial Transplant 2001;16 Suppl 4:27–30.
crossref pmid
8. Schiffl H. Online hemodiafiltration and mortality risk in end-stage renal disease patients: a critical appraisal of current evidence. Kidney Res Clin Pract 2019;38:159–168.
crossref pmid pmc
9. Tsuchida K, Minakuchi J. Clinical benefits of predilution on-line hemodiafiltration. Blood Purif 2013;35 Suppl 1:18–22.
crossref pmid pdf
10. Canaud B, Lévesque R, Krieter D, et al. On-line hemodiafiltration as routine treatment of end-stage renal failure: why pre- or mixed dilution mode is necessary in on-line hemodiafiltration today? Blood Purif 2004;22 Suppl 2:40–48.
crossref pmid pdf
11. Masakane I, Kikuchi K, Kawanishi H. Evidence for the clinical advantages of predilution on-line hemodiafiltration. Contrib Nephrol 2017;189:17–23.
crossref pmid
12. Kim ST, Yamamoto C, Taoka M, Takasugi M. Programmed filtration, a new method for removing large molecules and regulating albumin leakage during hemodiafiltration treatment. Am J Kidney Dis 2001;38(4 Suppl 1):S220–S223.
crossref pmid
13. Pedrini LA, De Cristofaro V, Pagliari B, Samà F. Mixed predilution and postdilution online hemodiafiltration compared with the traditional infusion modes. Kidney Int 2000;58:2155–2165.
crossref pmid
14. Feliciani A, Riva MA, Zerbi S, et al. New strategies in haemodiafiltration (HDF): prospective comparative analysis between on-line mixed HDF and mid-dilution HDF. Nephrol Dial Transplant 2007;22:1672–1679.
crossref pmid
15. Pedrini LA, Zerbi S. Mixed-dilution hemodiafiltration. Contrib Nephrol 2007;158:123–130.
crossref pmid
16. Akizawa T, Koiwa F. Clinical expectation of online hemodiafiltration: a Japanese perspective. Blood Purif 2015;40 Suppl 1:12–16.
crossref pmid pdf
17. Tattersall JE, Ward RA; EUDIAL group. Online haemodiafiltration: definition, dose quantification and safety revisited. Nephrol Dial Transplant 2013;28:542–550.
crossref pmid
18. Potier J, Bowry S, Canaud B. Clinical performance assessment of CorDiax filters in hemodialysis and hemodiafiltration. Contrib Nephrol 2017;189:237–245.
crossref pmid
19. Vaslaki L, Major L, Berta K, et al. On-line haemodiafiltration versus haemodialysis: stable haematocrit with less erythropoietin and improvement of other relevant blood parameters. Blood Purif 2006;24:163–173.
crossref pmid pdf
20. Pedrini LA, Zawada AM, Winter AC, et al. Effects of high-volume online mixed-hemodiafiltration on anemia management in dialysis patients. PLoS One 2019;14:e0212795.
crossref pmid pmc
21. Canaud B, Vienken J, Ash S, Ward RA; Kidney Health Initiative HDF Workgroup. Hemodiafiltration to address unmet medical needs ESKD patients. Clin J Am Soc Nephrol 2018;13:1435–1443.
crossref pmid pmc
22. Blankestijn PJ, Grooteman MP, Nube MJ, Bots ML. Clinical evidence on haemodiafiltration. Nephrol Dial Transplant 2018;33(Suppl 3):iii53–iii58.
crossref pmid pmc
23. Ok E, Asci G, Toz H, et al. Mortality and cardiovascular events in online haemodiafiltration (OL-HDF) compared with high-flux dialysis: results from the Turkish OL-HDF Study. Nephrol Dial Transplant 2013;28:192–202.
crossref pmid
24. Maduell F, Moreso F, Pons M, et al. High-efficiency postdilution online hemodiafiltration reduces all-cause mortality in hemodialysis patients. J Am Soc Nephrol 2013;24:487–497.
crossref pmid pmc
25. Morena M, Jaussent A, Chalabi L, et al. Treatment tolerance and patient-reported outcomes favor online hemodiafiltration compared to high-flux hemodialysis in the elderly. Kidney Int 2017;91:1495–1509.
crossref pmid
26. Sichart JM, Moeller S. Utilization of hemodiafiltration as treatment modality in renal replacement therapy for end-stage renal disease patients: a global perspective. Contrib Nephrol 2011;175:163–169.
crossref pmid
27. Kikuchi K, Hamano T, Wada A, Nakai S, Masakane I. Predilution online hemodiafiltration is associated with improved survival compared with hemodialysis. Kidney Int 2019;95:929–938.
crossref pmid
28. Pedrini LA. On-line hemodiafiltration: technique and efficiency. J Nephrol 2003;16 Suppl 7:S57–S63.
pmid
29. de Sequera P, Albalate M, Pérez-García R, et al. A comparison of the effectiveness of two online haemodiafiltration modalities: mixed versus post-dilution. Nefrologia 2013;33:779–787.
pmid
30. Wang AY, Ninomiya T, Al-Kahwa A, et al. Effect of hemodiafiltration or hemofiltration compared with hemodialysis on mortality and cardiovascular disease in chronic kidney failure: a systematic review and meta-analysis of randomized trials. Am J Kidney Dis 2014;63:968–978.
crossref pmid
31. Foster MC, Coresh J, Hsu CY, et al. Serum β-trace protein and β2-microglobulin as predictors of ESRD, mortality, and cardiovascular disease in adults with CKD in the Chronic Renal Insufficiency Cohort (CRIC) study. Am J Kidney Dis 2016;68:68–76.
crossref pmid pmc
32. Masakane I, Sakurai K. Current approaches to middle molecule removal: room for innovation. Nephrol Dial Transplant 2018;33(Suppl 3):iii12–iii21.
crossref pmid pmc
33. Canaud B, Barbieri C, Marcelli D, et al. Optimal convection volume for improving patient outcomes in an international incident dialysis cohort treated with online hemodiafiltration. Kidney Int 2015;88:1108–1116.
crossref pmid pmc
34. Cuvelier C, Tintillier M, Migali G, Van Ende C, Pochet JM. Albumin losses during hemodiafiltration: all dialyzers are not created equal - a case report. BMC Nephrol 2019;20:392
crossref pmid pmc pdf
35. Lee YH, Shin YS, Lee SY, et al. Effects of online hemodiafiltration on anemia and nutritional status in chronic hemodialysis patients. Kidney Res Clin Pract 2020;39:103–111.
crossref pmid pmc
36. Fournier A, Birmelé B, François M, Prat L, Halimi JM. Factors associated with albumin loss in post-dilution hemodiafiltration and nutritional consequences. Int J Artif Organs 2015;38:76–82.
crossref pmid pdf
Figure 1.

A flow chart of the study population that includes the numbers of patients who were screened, underwent randomization, and completed the assessment.

HDF, hemodiafiltration.
j-krcp-21-044f1.jpg
Figure 2.

Changes and difference in effective convection volume.

(A) Effective convection volume over 6 months (p for intergroup difference < 0.001). (B) Noninferiority of mixed-HDF compared with predilution HDF. The gray line indicates predilution HDF, and the black line indicates mixed-HDF.
HDF, hemodiafiltration.
j-krcp-21-044f2.jpg
Figure 3.

Changes in reduction ratios of B2MG during the study period (p for intergroup difference = 0.01).

The yellow line indicates predilution HDF, and the red line indicates mixed-HDF. HDF, hemodiafiltration; B2MG, β2-microglobulin.
j-krcp-21-044f3.jpg
Table 1.
Baseline characteristics
Variable Predilution HDF (n = 27) Mixed-HDF (n = 26) p-value
Age (yr) 59.0 ± 1.3 60.5 ± 1.1 0.63
Male sex 16 (59.3) 11 (42.3) 0.22
Body mass index (kg/m2) 23.7 ± 3.4 22.6 ± 3.9 0.25
Diabetes mellitus 16 (59.3) 14 (53.8) 0.69
Cerebrovascular disease 10 (37.0) 4 (15.4) 0.07
Cardiovascular disease 12 (44.4) 10 (38.5) 0.66
CCI 2 (2–3) 3 (2–3) 0.14
Cause of KFRT
 Diabetes mellitus 16 (59.3) 12 (46.2) 0.46
 Hypertension 9 (33.3) 10 (38.5)
 Glomerulonephritis 1 (3.7) 3 (11.5)
 Others 1 (3.7) 1 (3.8)
BP-lowering drug 23 (85.2) 21 (80.8) 0.67
 ARB 17 (63.0) 17 (65.4) 0.85
 CCB 11 (40.7) 14 (53.8) 0.34
 β-Blocker 12 (44.4) 15 (57.7) 0.34
 α-Blocker 3 (11.1) 6 (23.1) 0.25
SBP (mmHg) 147.0 ± 25.7 148.1 ± 22.6 0.87
DBP (mmHg) 73.5 ± 17.4 72.8 ± 13.9 0.86
Hemoglobin (g/dL) 10.6 ± 1.1 10.2 ± 1.3 0.32
Albumin (g/dL) 3.9 ± 0.3 3.9 ± 0.3 0.57
hs-CRP (mg/dL) 0.7 (0.11–1.4) 0.8 (0.23–1.5) 0.87
Sodium (mmol/L) 137.7 ± 2.8 134.0 ± 17.7 0.29
Potassium (mmol/L) 5.1 ± 0.7 4.9 ± 0.7 0.35
Bicarbonate (mmol/L) 23.6 ± 4.6 23.8 ± 2.6 0.89
PTH (pg/mL) 255.5 (188.7–395.6) 265.8 (169.6–451.9) 0.75
Calcium (mg/dL) 8.6 ± 1.3 8.9 ± 0.6 0.26
Phosphate (mg/dL) 5.4 ± 1.8 5.2 ± 1.3 0.73
BUN (mg/dL) 62.1 ± 15.8 58.8 ± 16.8 0.47
Creatinine (mg/dL) 10.1 ± 2.4 10.0 ± 4.4 0.88
B2MG (mg/L) 21.7 (19.7–23.4) 25.6 (21.4–28.0) 0.006
Glucose (mg/dL) 138.6 ± 58.9 132.2 ± 73.2 0.73
Dialysis parameter
 Vintage (yr) 1.5 (1.0–4.25) 3 (1–4) 0.89
 Dialysis time (min) 241.0 ± 0.9 241.6± 2.5 0.52
 TMP (mmHg) 150.2 ± 47.6 162.5 ± 51.2 0.37
 Blood flow (mL/min) 272.8 ± 39.7 256.2 ± 31.8 0.005
 Heparin dose (IU/session) 2,205.6 (1,201.7–2,213.9) 1,899.4 (1,603.3–2,209.5) 0.48
 Dialysate flow (mL/min) 607.0 ± 90.5 589.5 ± 113.3 0.54
 Net ultrafilation (L/sesseion) 2.3 ± 1.0 2.3 ± 1.1 0.91

Data are expressed as mean ± standard deviation, number (%), or median (interquartile range).

ARB, angiotensin receptor blocker; B2MG, β2-microglobulin; BP, blood pressure; BUN, blood urea nitrogen; CCB, calcium channel blocker; CCI, Charlson comorbidity index; DBP, diastolic blood pressure; HDF, hemodiafiltration; hs-CRP, high-sensitivity C-reactive protein; KFRT, kidney failure with replacement therapy; PTH, parathyroid hormone; SBP, systolic blood pressure; TMP, transmembrane pressure.

Table 2.
Primary outcome analysis: the differences in convection volume between predilution HDF and mixed-HDF
Variable Treatment Observed data
p-value
Mean value during 6 mo Baseline Month 3 Month 6 Between-group Within-group
Convection volume (L/session)
 Absolute Predilution 41.0 ± 10.3 40.4 ± 8.0 39.1 ± 8.7 44.0 ± 13.1 0.17
Mixed 35.0 ± 5.7 32.6 ± 7.8 36.3 ± 4.2 36.1 ± 3.7 <0.001 0.01
 Effective Predilution 41.0 ± 10.3 40.4 ± 8.0 39.1 ± 8.7 44.0 ± 13.1 0.17
Mixed 51.5 ± 9.0 47.9 ± 10.4 53.3 ± 7.6 53.2 ± 7.4 <0.001 0.003
Substitution volume (L/session)
 Via predilution mode Predilution 38.8 ± 10.5 37.7 ± 8.0 36.8 ± 8.9 41.8 ± 13.4 0.16
Mixed 16.6 ± 4.2 15.6 ± 6.8 17.1 ± 2.3 17.1 ± 2.1 0.44
 Via postdilution mode Predilution NA NA NA NA
Mixed 16.3 ± 2.5 14.8 ± 2.6 16.9 ± 2.2 17.1 ± 2.1 <0.001
Net ultrafiltration (L/session) Predilution 2.3 ± 1.1 2.3 ± 1.0 2.3 ± 1.1 2.2 ± 1.1 0.72
Mixed 2.2 ± 1.1 2.3 ± 1.1 2.3 ± 1.0 1.9 ± 1.1 0.73 0.06
Convection volumes adjusted for body surface area (L/m2 per session)
 Absolute Predilution 24.5 ± 3.8 24.4 ± 5.1 23.1 ± 5.5 25.8 ± 7.8 0.27
Mixed 20.6 ± 5.5 18.0 ± 5.1 20.0 ± 4.1 23.8 ± 10.5 0.004 0.004
 Effective Predilution 24.5 ± 3.8 24.4 ± 5.1 23.1 ± 5.5 25.8 ± 7.8 0.60
Mixed 31.5 ± 5.3 27.5 ± 5.4 32.6 ± 4.6 34.4 ± 11.2 <0.001 0.003

Data are presented as mean ± standard deviation.

All analyses were conducted using repeated measures analysis of variance.

HDF, hemodiafiltration; NA, not applicable.

Table 3.
Secondary outcome analysis
Variable Treatment Observed data
p-value
Mean value of three time points Baseline Month 3 Month 6 Between-group Within-group
Predialysis B2MG (mg/L) Predilution 21.2 ± 4.8 21.5 ± 3.5 21.2 ± 6.3 20.9 ± 4.5 0.88
Mixed 23.6 ± 4.7 25.4 ± 5.6 23.3 ± 3.6 22.2 ± 4.4 0.02 0.004
Reduction ratio of B2MG (%) Predilution 73.9 ± 6.6 75.2 ± 4.9 NA 72.8±7.9 0.36
Mixed 76.5 ± 5.9 76.0 ± 4.8 NA 78.7±5.1 0.01 0.02
Kt/V urea Predilution 1.53 ± 0.2 1.53 ± 0.3 1.49 ± 0.2 1.57 ± 0.2 0.37
Mixed 1.56 ± 0.3 1.51 ± 0.3 1.59 ± 0.25 1.57 ± 0.3 0.33 0.19
TMP (mmHg) Predilution 139.6 ± 42.0 150.2 ± 47.6 135.7 ± 36.9 132.9 ± 40.3 0.09
Mixed 176.2 ± 51.9 162.5 ± 51.2 192.7 ± 42.4 173.1 ± 59.1 0.001 0.06
hs-CRP (mg/dL) Predilution 0.6 (0.1–1.7) 0.7 (0.1–1.4) 0.6 (0.2–2.2) 0.6 (0.1–3.3) 0.14
Mixed 0.9 (0.3–2.0) 0.8 (0.2–1.5) 1.1 (0.3–2.0) 0.9 (0.3–3.5) 0.82 0.82
Albumin (g/dL) Predilution 3.9 ± 0.3 3.9 ± 0.3 4.0 ± 0.4 3.9 ± 0.3 0.14
Mixed 3.8 ± 0.4 3.9 ± 0.3 3.8 ± 0.4 3.8 ± 0.4 0.16 0.14
Phosphate (mg/dL) Predilution 5.1 ± 1.7 5.4 ± 1.8 5.0 ± 1.4 4.8 ± 1.7 0.30
Mixed 5.0 ± 1.4 5.2 ± 1.3 4.9 ± 1.5 4.8 ± 1.3 0.79 0.29
Sodium (mmol/L) Predilution 137.7 ± 4.2 137.7 ± 2.9 138.3 ± 3.1 137.2 ± 6.0 0.51
Mixed 137.3 ± 3.5 137.9 ± 4.3 136.7 ± 3.3 137.3 ± 2.7 0.59 0.19
Potassium (mmol/L) Predilution 5.0 ± 0.8 5.1 ± 0.7 5.0 ± 0.8 4.9 ± 0.8 0.49
Mixed 5.0 ± 0.7 4.9 ± 0.7 4.9 ± 0.8 5.2 ± 0.6 0.91 0.13
Bicarbonate (mmol/L) Predilution 23.4 ± 4.0 23.6 ± 4.6 23.4 ± 3.5 23.3 ± 3.9 0.81
Mixed 23.4 ± 3.0 23.8 ± 2.6 23.4 ± 3.7 22.9 ± 2.8 0.89 0.13
Bioimpedance parameter
 OH (L) Predilution 0.8 (–0.9 to 1.2) NA 1.0 (–0.3 to 2.7) >0.99
Mixed 0.3 (–0.2 to 1.23) NA 0.7 (–0.6 to 2.9) 0.32 0.16
 OH-ECW (%) Predilution 4.5 (–5.6 to 9.1) NA 7.1 (–1.9 to 14.6) 0.98
Mixed 2.7 (–1.2 to 8.0) NA 4.1 (–4.5 to 18.2) 0.33 0.16
Predialysis blood pressure (mmHg)
 SBP Predilution 147.0 ± 25.7 155.8 ± 25.5 149.2 ± 26.0 0.14
Mixed 148.1 ± 22.6 156.1 ± 24.7 153.9 ± 28.8 0.74 0.22
 DBP Predilution 73.5 ± 17.2 74.0 ± 14.6 73.9 ± 18.6 >0.99
Mixed 72.8 ± 13.9 74.9 ± 15.9 74.1 ± 13.4 0.97 0.68

Data are presented as mean ± standard deviation or median (interquartile range).

B2MG, β2-microglobulin; DBP, diastolic blood pressure; hs-CRP, high-sensitive C-reactive protein; NA, not available; OH-ECW, overhydration/extracellular water; OH, overhydration; SBP, systolic blood pressure; TMP, transmembrane pressure.

All analyses were conducted using repeated measures analysis of variance.

Table 4.
Adverse event rates
Variable Predilution HDF (n = 81) Mixed-HDF (n = 78) p-value
No. of adverse events 42 (51.9) 40 (51.3) 0.94
At least one event
A decrease in SBP >10 mmHg without symptoms 36 (44.4) 34 (43.6) 0.73
Symptomatic intradialytic hypotensiona 3 (3.7) 1 (1.3)
Headache 1 (1.2) 2 (2.6)
Muscle cramps 2 (2.5) 1 (1.3)
Nausea, vomiting 0 1 (1.3)
Fever 0 1 (1.3)
Chest pain 0 0
Arrhythmia 0 0

Data are presented as number (%). The percentages were calculated with number of adverse events per dialysis sessions during study period.

HDF, hemodiafiltration; SBP, systolic blood pressure.

a Symptomatic intradialytic hypotension is defined as a decrease in SBP by ≥20 mmHg associated with symptoms that include abdominal discomfort, yawning, sighing, nausea, vomiting, muscle cramps, restlessness, dizziness or fainting, and anxiety.


ABOUT
BROWSE ARTICLES
EDITORIAL POLICY
FOR CONTRIBUTORS
Editorial Office
#301, (Miseung Bldg.) 23, Apgujenog-ro 30-gil, Gangnam-gu, Seoul 06022, Korea
Tel: +82-2-3486-8736    Fax: +82-2-3486-8737    E-mail: registry@ksn.or.kr                

Copyright © 2024 by The Korean Society of Nephrology.

Developed in M2PI

Close layer