Kidney Res Clin Pract > Volume 40(4); 2021 > Article
Kim, Shin, Kim, Cui, Ko, Lim, Yang, and Chung: Modeling of endothelial cell dysfunction using human induced pluripotent stem cells derived from patients with end-stage renal disease

Abstract

Background

Endothelial cell (EC) dysfunction is a frequent feature in patients with end-stage renal disease (ESRD). The aim of this study was to generate human induced pluripotent stem cells, differentiate ECs (hiPSC-ECs) from patients with ESRD, and appraise the usefulness of hiPSC-ECs as a model to investigate EC dysfunction.

Methods

We generated hiPSCs using peripheral blood mononuclear cells (PBMCs) isolated from three patients with ESRD and three healthy controls (HCs). Next, we differentiated hiPSC-ECs using the generated hiPSCs and assessed the expression of endothelial markers by immunofluorescence. The differentiation efficacy, EC dysfunction, and molecular signatures of EC-related genes based on microarray analysis were compared between the ESRD and HC groups.

Results

In both groups, hiPSCs and hiPSC-ECs were successfully obtained based on induced pluripotent stem cell or EC marker expression in immunofluorescence and flow cytometry. However, the efficiency of differentiation of ECs from hiPSCs was lower in the ESRD-hiPSCs than in the HC-hiPSCs. In addition, unlike HC-hiPSC-ECs, ESRD-hiPSC-ECs failed to form interconnecting branching point networks in an in vitro tube formation assay. During microarray analysis, transcripts associated with oxidative stress and inflammation were upregulated and transcripts associated with vascular development and basement membrane extracellular matrix components were downregulated in ESRD-hiPSC-ECs relative to in HC-hiPSC-ECs.

Conclusion

ESRD-hiPSC-ECs showed a greater level of EC dysfunction than HC-hiPSC-ECs did based on functional assay results and molecular profiles. hiPSC-ECs may be used as a disease model to investigate the pathophysiology of EC dysfunction in ESRD.

Introduction

The rapid increase in patients with end-stage renal disease (ESRD) is a global health problem. In Korea, for example, the number of patients with ESRD was 28,046 in 2002 but had increased rapidly to 93,884 in 2016 [1]. Despite improvements in survival due to advances in dialysis therapy, the mortality rate is still much higher among those with ESRD than in the general population; cardiovascular disease is a leading cause of mortality, accounting for 30% to 50% of all deaths in ESRD patients [2]. In addition, a significant proportion of patients receiving long-term dialysis experience cardiovascular complications, which can reduce their quality of life and represents a major economic burden [3]. Therefore, methods to limit cardiovascular complications in ESRD are critical.
Many traditional risk factors, such as diabetes mellitus, hypertension, chronic kidney disease, and mineral bone disease, are thought to increase cardiovascular complications in patients with ESRD [3]. Of note, endothelial dysfunction is a common underlying mechanism connecting these risk factors to cardiovascular complications [4]. Indeed, endothelial dysfunction and atherosclerosis are observed in nearly all patients with ESRD and are invariably associated with thrombosis and vascular hypertension [5,6]. Therefore, it is necessary to investigate the pathogenesis of endothelial cell (EC) dysfunction in ESRD.
The entire range of cell types found in the human body can be evaluated using human induced pluripotent stem cells (hiPSCs). Therefore, hiPSC technology and the increasingly refined ability to differentiate hiPSCs into disease-relevant target cells have far-reaching implications for understanding disease pathophysiology, identifying disease-causing genes, and developing more precise therapeutics [7,8]. For example, hiPSC-derived neurons and neural progenitor cells [9,10], hiPSC-derived hepatocytes to model inherited metabolic disorders of the liver [11], and hiPSC-derived cardiomyocytes to model hypertrophic cardiomyopathies and diabetes mellitus-induced cardiomyopathies [12,13] represent encouraging routes of investigation. Collected findings suggest that ECs differentiated from patient-derived hiPSCs can be used to develop a platform for studies of the mechanisms underlying endothelial dysfunction in ESRD.
We characterized ECs differentiated from hiPSCs (hiPSC-ECs) taken from patients with ESRD and from hiPSC-ECs taken from healthy controls (HCs), respectively. In particular, we generated hiPSCs using peripheral blood mononuclear cells (PBMCs) from patients with ESRD and HCs. Using these cell lines, we compared the efficacy of EC differentiation and cell functions. We further used a microarray approach to identify transcripts associated with EC dysfunction in hiPSC-ECs from patients with ESRD.

Methods

Reprogramming of PBMCs

A peripheral blood sample was obtained from three patients with ESRD and three HCs. PBMCs were isolated by centrifugation using Ficoll-Paque PLUS (GE Healthcare, Chicago, IL, USA). Baseline clinical characteristics are presented in Table 1. Isolated PBMCs were cultured in StemSpan Animal Component-free media (Stem Cell Technologies, Vancouver, BC, Canada) supplemented with StemSpan CC110 (Stem Cell Technologies) for 4 days. Then, mononuclear cells were transferred to 24-well plates manually coated with recombinant human vitronectin (BD BioCoat; Corning, Corning, NY, USA), and Sendai virus (CytoTune hiPSC 2.0 Reprogramming Kit; Thermo Fisher Scientific, Waltham, MA, USA) was added at a multiplicity of infection of three. Medium was changed daily until hiPSC colonies formed. After manual picking, hiPSC lines were maintained on vitronectin (Invitrogen, Carlsbad, CA, USA)-coated plates in TeSR-E8 medium (Stem Cell Technologies). On day 12 after transduction, emerging hiPSC colonies were picked individually and expanded for characterization. From day 3 to day 21 after transduction, cells were cultured in a 37°C incubator with 5% CO2.
All subjects gave their informed consent for inclusion before they participated in this study. This study was conducted in accordance with the Declaration of Helsinki, and the protocol was approved by the Institutional Review Board of Seoul St. Mary’s Hospital (No. KC16TISI0774).

EC differentiation from PBMC-hiPSCs

We used the induced pluripotent stem cell (iPSC) culture method without karyotypic abnormalities or the loss of pluripotency and the iPSCs used were less than 20 passages [14]. To initiate differentiation, confluent cultures of hiPSCs were incubated with 1 mg/mL type IV collagenase for 10 minutes and transferred to ultra-low attachment dishes containing differentiation medium for four days to form embryoid bodies (EBs). The differentiation medium consisted of α-minimum Eagle’s medium, 20% fetal bovine serum, L-glutamine, β-mercaptoethanol (0.05 mmol/L), and 1% nonessential amino acids supplemented with 50 ng/mL of bone morphogenetic protein-4 (BMP-4) (PeproTech, Rocky Hill, NJ, USA) and 50 ng/mL of vascular endothelial growth factor (VEGF) A (PeproTech). For the generation of heterogeneous hiPSC-ECs, the 4-day EBs were reattached to gelatin-coated dishes in the presence of VEGF-A for another 10 days before purification [15]. On day 14 of differentiation, the ECs were purified by magnetic cell sorting. Differentiated cells were dissociated into single cells with Accutase (Life Technologies) for 20 minutes at 37°C, washed with 1× phosphate-buffered saline (PBS) containing 5% bovine serum albumin, and passed through a 70-μm cell strainer. They were next incubated with the CD31 MicroBead Kit (#130-091-935; Miltenyi Biotech, Bergisch Gladbach, Germany) for 30 minutes and a MidiMACS separator with an LS column (Miltenyi Biotech). The purified hiPSC-ECs were expanded in Endothelial Growth Medium-2MV (EGM-2MV) media (Lonza, Basel, Switzerland). Differentiation medium was replaced every 2 days for EC differentiation.

Flow cytometry

hiPSC colonies were dissociated using TrypLE Express (Life Technologies) and washed with PBS, and the cell suspension was stained with stage-specific embryonic antigen-4 (SSEA-4) (813-70, 1:100; Santa Cruz Biotechnology, Santa Cruz, CA, USA) and TRA-1-81 (TRA-1-80, 1:100; Santa Cruz Biotechnology) surface antibodies for 30 minutes. Intracellular staining for NANOG (1E6C4, 1:100; Santa Cruz Biotechnology) was performed by sequential incubations with fixation and permeabilization solutions (A and B Fix & Perm Solutions, Thermo Fisher Scientific). Cells were incubated with NANOG, followed by with a fluorescein isothiocyanate-conjugated secondary antibody (BD BioSciences, San Jose, CA, USA).

Confocal microscopic analysis

hiPSCs were grown on plastic cover slide chambers and fixed with 4% paraformaldehyde. The following antibodies were used: NANOG (1E6C4, 1:100), SSEA-4 (813-70, 1:100), and TRA-1-81 (TRA-1-80, 1:100). ECs from ESRD-PBMC-hiPSCs were grown on plastic cover slide chambers and fixed with 4% paraformaldehyde. The following antibodies were used: CD31 (WM-59; eBioscience, San Diego, CA, USA), CD34 (4H11; eBioscience), CD133 (TMP4; eBioscience), von Willebrand factor (VWF) (sc-53466, 1:100; Santa Cruz Biotechnology), fetal liver kinase 1 (Flk-1) (sc-6251, 1:100; Santa Cruz Biotechnology), and VEGF receptor (Flt) (sc-271789, 1:100; Santa Cruz Biotechnology). Alexa Fluor 488-conjugated streptavidin (Molecular Probes, Eugene, OR, USA) was used according to the manufacturer’s instructions. The stained sections were visualized under a Zeiss microscope (LSM 510 Meta; Carl Zeiss, Oberkochen, Germany) at magnifications of 200× and 400×. The profiles of EC markers were evaluated in each stained tissue section at ×200 magnification using a color image analyzer (TDI Scope Eye, version 3.0, for Windows; Olympus, Tokyo, Japan). All data are presented as mean ± standard error values; unpaired t tests were used for comparisons among groups. Differences with p-values of less than 0.05 were considered statistically significant. All statistical analyses were conducted using GraphPad Prism version 5 (GraphPad Software Inc., San Diego, CA, USA).

Alkaline phosphatase

After 5 days in culture, colonies were assayed for phosphatase alkaline enzymatic activity using the Alkaline Phosphatase Detection Kit (Merck-Millipore, Burlington, MA, USA) according to the manufacturer’s instructions.

In vitro EC tube formation assay

Endothelial tube formation assays were performed in 96-well plates coated with Matrigel (354230; BD, Franklin Lakes, NJ, USA), a reconstituted basement membrane matrix. Approximately 2 × 10⁴ ECs were seeded into each well with 200 µL of EGM-2MV + 20% human serum media. Capillary-like networks were monitored and images were obtained after 4 hours [16]. The area of endothelial tube formation was measured in samples using the ImageJ software (original magnification, 50×; National Institutes of Health, Bethesda, MD, USA).

Cell viability assay

Differentiated ECs were seeded in 96-well plates at a density of 2 × 10⁴/well for 24 or 48 hours, respectively. Before the end of the specified periods, Cell Counting Kit-8 solution (Dojindo Molecular Technologies, Kumamoto, Japan) was added to each well for 2 hours. Absorbance was measured at 450 nm using a VersaMax enzyme-linked immunosorbent assay reader (Molecular Devices, Sunnyvale, CA, USA).

Microarray analysis

RNA purity and integrity were evaluated using the ND-1000 spectrophotometer (NanoDrop, Wilmington, DE, USA). The Affymetrix Whole Transcript Expression Array (Thermo Fisher Scientific) was used to estimate transcript levels according to the manufacturer’s protocol (GeneChip WT Pico Reagent Kit; Thermo Fisher Scientific). Complementary DNA was synthesized using the GeneChip WT Pico Amplification Kit, as described by the manufacturer (Thermo Fisher Scientific). The sense complementary DNA was fragmented and biotin-labeled with terminal deoxynucleotidyl transferase using the GeneChip WT Terminal Labeling Kit (Thermo Fisher Scientific). Approximately 5.5 μg of labeled DNA target was hybridized to the Affymetrix GeneChip Human 2.0 ST Array (Thermo Fisher Scientific) at 45°C for 16 hours. Hybridized arrays were washed and stained on a GeneChip Fluidics Station 450 system (Thermo Fisher Scientific) and scanned on a GCS3000 scanner (Thermo Fisher Scientific). Signal values were computed using the GeneChip Command Console software (Thermo Fisher Scientific).

Raw data preparation and statistical analyses

Raw data were extracted automatically, following the Affymetrix data-extraction protocol, using the GeneChip Command Console software. After importing CEL files, data were summarized and normalized by the robust multi-average (RMA) method implemented in the Affymetrix Expression Console software. A gene-level RMA analysis and differentially expressed gene (DEG) analysis were performed. Significant differences in expression level were determined based on fold-change values and the local pooled errors test, in which the null hypothesis was not different among groups. The false discovery rate (FDR) was controlled by adjusting the p-value using the Benjamini-Hochberg algorithm. For a DEG set, a hierarchical cluster analysis was performed using complete linkage and Euclidean distances as a measure of similarity. Gene enrichment and functional annotation analyses for the significant probe list were performed using the Gene Ontology (GO; www.geneontology.org/) and Kyoto Encyclopedia of Genes and Genomes (KEGG; www.genome.jp/kegg/) databases. All data analyses and the visualization of DEGs were conducted using R version 3.1.2 (www.r-project.org; R Foundation for Statistical Computing, Vienna, Austria).

Protein-protein interaction network analysis

It is known that the Search Tool for the Retrieval of Interacting Genes (STRING) (https://string-db.org) database, which integrates both known and predicted protein-protein interactions (PPIs), can be applied to predict functional interactions of proteins [17]. In this study, to seek potential interactions between DEGs according to different tissues, the STRING tool was employed. Active interaction sources, including text mining, experiments, databases, and co-expression, were applied, together with limiting the species to “Homo sapiens” and the interaction score to greater than 0.4, to construct the PPI networks. The Cytoscape software version 3.8.2 (an open-source software platform for visualizing networks) was used to visualize the PPI network. In this kind of network, the nodes correspond to the proteins and the edges represent the interactions, respectively.

Results

Characterization of hiPSC in patients with ESRD and HCs

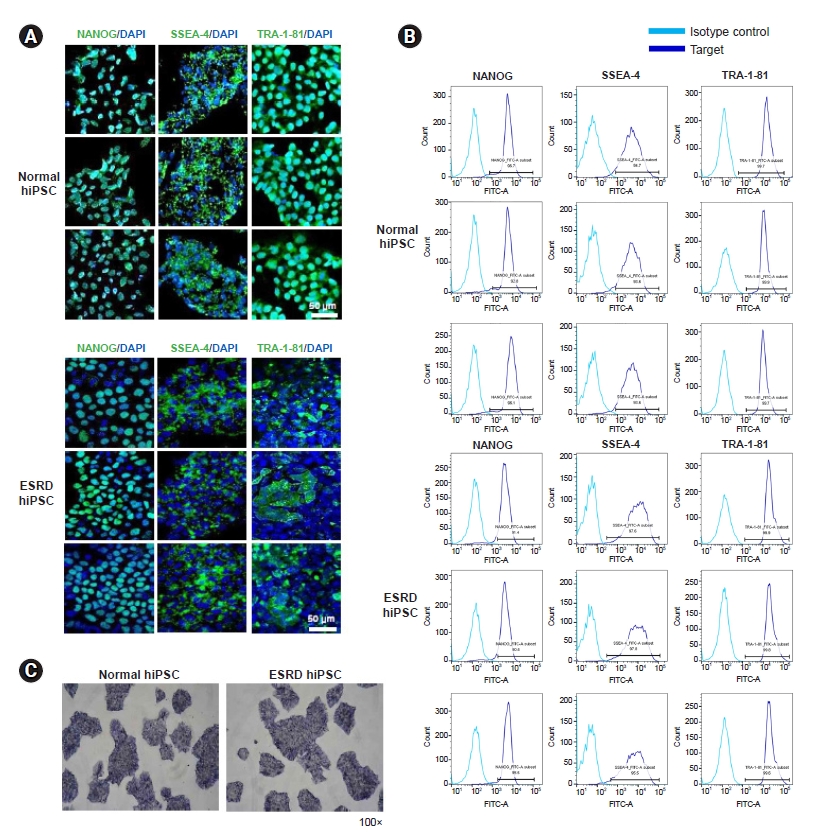
The pluripotency-associated markers NANOG, SSEA4, and TRA-1-81 on hiPSCs from patients with ESRD or HCs were detected by confocal microscopy (Fig. 1A) and flow cytometry (Fig. 1B). Differentiation assays demonstrated that hiPSCs are pluripotent. Pluripotency was assessed by alkaline phosphatase staining (Fig. 1C).

EC differentiation using ESRD-hiPSCs and HC-hiPSCs

We examined the efficiency of hiPSC differentiation into ECs. hiPSCs were differentiated via the EB formation method in the presence of BMP-4 (50 ng/mL) and VEGF (50 ng/mL), as depicted in Fig. 2A. In addition, we evaluated the properties for characteristics of mature ECs using endothelial markers, such as CD31, CD34, CD133, VWF, Flk kinase insert domain receptor, and Flt-1 (VEGF receptor 1) (Fig. 2B). Before and after purification with CD31, ESRD-hiPSC-ECs demonstrated reduced immunoreactivity for endothelial markers relative to HC-hiPSC-ECs. Furthermore, fewer hiPSC-ECs were generated from ESRD-hiPSC-ECs than from HC-hiPSC-ECs using our standard differentiation procedure (average yields: 33% and 4% of total differentiated cells, respectively; p < 0.01) (Fig. 2C). These results show that cell line-specific differences in the efficiency of endothelial differentiation were detected.

Clear dysfunction of ESRD-hiPSC-ECs in comparison with HC-hiPSC-ECs

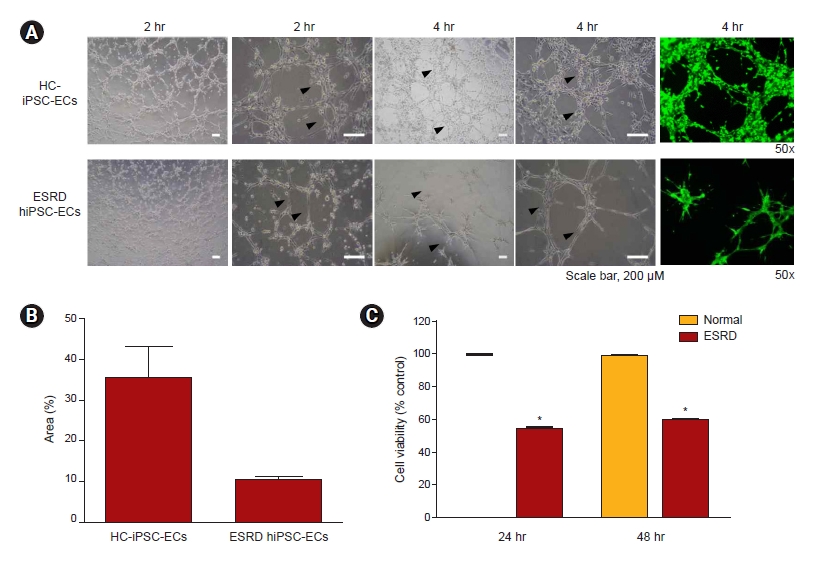
To compare the angiogenic potential of ESRD-hiPSC-ECs and HC-hiPSC-ECs, we first seeded the ECs onto Matrigel in vitro and evaluated the formation of branching point structures (Fig. 3A). Morphogenic differentiation into vascular plexus-like networks or branching point structures was induced. The plating of HC-hiPSC-ECs on Matrigel resulted in the formation of branching point networks. However, ESRD-hiPSC-ECs failed to form interconnecting branching point networks (average areas: 35% and 10% tube formation; p < 0.01) (Fig. 3A, B). We also evaluated the viability of differentiated EC from hiPSCs; as shown in Fig. 3C, ESRD-hiPSC-ECs exhibited worsened cell viability relative to HC-hiPSC-ECs.

Phenotypic and transcriptional profiles of ESRD-hiPSC-ECs and HC-hiPSC-ECs

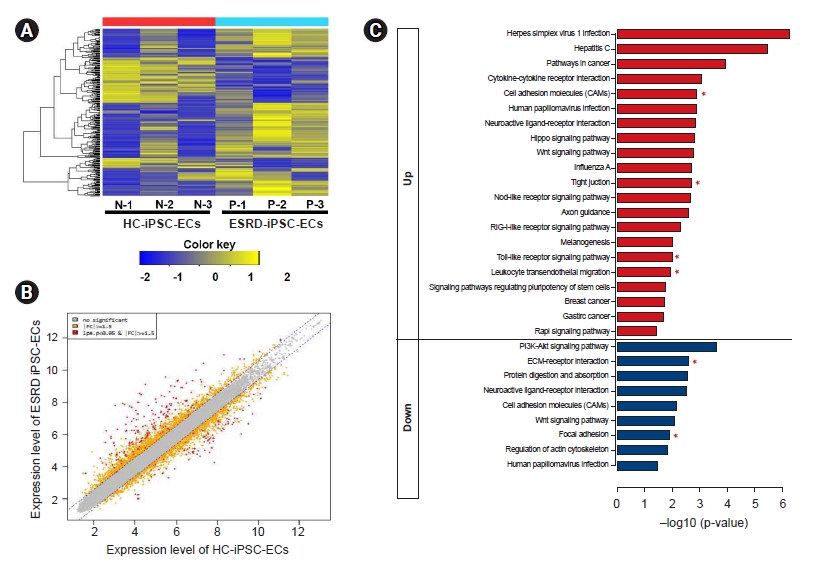
We performed a microarray analysis of ESRD-hiPSC-ECs (n = 3) and HC-hiPSC-ECs (n = 3) (Fig. 4A) and identified a total of 226 DEGs. We further identified the leading-edge gene set (i.e., the core set of genes accounting for this enrichment) from each hiPSC-EC group and distinguished a core of 144 upregulated (Supplementary Table 1, available online) and 75 downregulated (Supplementary Table 2, available online) genes. Genes with expression level differences exceeding the established threshold (i.e., upregulated or downregulated by at least 1.5-fold) were further evaluated (see scatterplot in Fig. 4B). The expression levels of 37 genes were higher (upregulated by at least five-fold) and seven genes were lower (downregulated by less than five-fold) in ESRD-hiPSC-ECs than in HC-hiPSC-ECs. Among genes with increased expression, the levels of the following 10 genes were increased by more than 10-fold: MT1H, NLRP7, MIR302C, DPPA3, MT1G, ESRG, L1TD1, SLC7A3, ZNF729, and PRDM14. Meanwhile, among genes with reduced expression, the levels of the following seven were decreased by more than five-fold: CEMIP, COL12A1, TYRP1, TXNIP, IL18, PCDH10, and GDF6. Fourteen upregulated genes in ESRD-hiPSC-ECs were associated with oxidative stress [18] and inflammation, i.e., MT1H, MT1G, NLRP7, NLRP2, SOX2, IFIT1, IFIT2, IFIT3, CXCL1, IFI6, IFIH1, IFI44, FOXI3, and IFI44L, and four upregulated genes in ESRD-hiPSC-ECs were associated with the inhibition of EC migration and proliferation (i.e., MIR302C, MIR302B, MIR302D, and MIR302A). Eight upregulated genes in ESRD-hiPSC-derived ECs were associated with basement membrane extracellular matrix (ECM) components (i.e., EPCAM, CDH1, claudin 10, CLDN7, CLDN6, GPC4, ADGRV1, and SFRP2). Eleven downregulated genes were involved in vascular development and basement membrane ECM components, including COL12A1, PCDH10, VTN, CALB2, ITGA11, EFEMP1, PCDHB14, FBN1, CDH5, FBLN5, and FBN2. Therefore, microarray analysis showed that transcripts associated with the ECM cell adhesion pathway were downregulated in ESRD-hiPSC-ECs (Supplementary Table 2).

KEGG pathway enrichment analyses of DEGs

Based on a KEGG pathway enrichment analysis, DEGs that were more upregulated in ESRD-hiPSC-ECs as compared with in HC-hiPSC-ECs were mainly enriched in cell adhesion molecules, tight junctions, the toll-like receptor signaling pathway, and leukocyte transendothelial migration (e.g., CD34, CLDN10, CDH5, CDH1, CLDN6, CLDN7, PDCD1LG2, MARVELD2, CCL5, SPP1, and CXCL10). Downregulated DEGs were significantly enriched with regard to functions in ECM-receptor interactions and focal adhesion (i.e., ITGA11, VTN, LAMA1, SPP1, and TNC) (Fig. 4C, Table 2).

PPI network between genes more expressed in ESRD-hiPSC-ECs relative to in HC-hiPSC-ECs

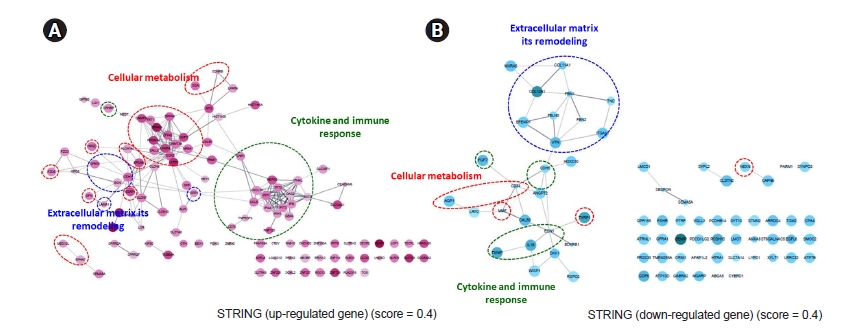
The PPI network among genes was expressed more strongly in ESRD-hiPSC-ECs than in HC-hiPSC-ECs. A total of 144 upregulated and 75 downregulated unique gene identities were analyzed using the STRING database and the Cytoscape software. The required confidence score was set to 0.400. In the networks, the nodes corresponded to the proteins and the edges represented the interactions. In Fig. 5A and B, red ovals depict cellular metabolism, while blue ovals depict ECM remodeling and green ovals indicate additional GO terms (i.e., cytokine and immune response). In ESRD-hiPSC-EC, the major hubs are those that are involved in the remodeling of the ECM, cellular metabolism, cytokines, and immune responses. Detailed GO terms are described in Supplementary Tables 3, 4 (available online).

Discussion

It is well known that significant EC dysfunction is detectable in ESRD patients, which can induce major cardiovascular complications, resulting in higher mortality and morbidity rates in this patient population [5,6]. Therefore, it is necessary to establish an appropriate platform that can be used for disease pathology research as well as new drug development to combat EC dysfunction. In the past decade, advances in iPSC reprogramming technology have enabled scientists to create specific organ tissues or cells with characteristics of specific diseases [12,19,20]. In this study, we successfully generated hiPSCs and hiPSC-ECs using PBMCs from ESRD patients and showed that hiPSC-ECs may represent EC dysfunction in terms of functional and molecular assays. These findings suggest that an in vitro model of hiPSC-ECs from patients with ESRD may improve our understanding of EC dysfunction and may be an effective platform for screening drug candidates.
Our first aim was to reprogram hiPSCs, which can be a source for ESRD-hiPSC-ECs, using PBMCs from ESRD patients. Several reprogramming techniques have been developed for generating hiPSCs via transferring genes corresponding to the four Yamanaka transcriptional factors to various types of somatic cells, such as dermal fibroblasts, PBMCs, or urine cells [21,22]. We decided to use PBMCs as a platform for hiPSC reprogramming because collecting blood is less invasive than performing a skin biopsy to gather dermal fibroblasts and ESRD patients are also mostly familiar with the former process. For reprogramming, we employed the Sendai virus-transfection method. Subsequently, we did not observe any differences between cells from patients with ESRD and HCs with regard to reprogramming efficacy or the expression of markers of pluripotency, such as NANOG, SSEA4, and TRA-1-81; hence, hiPSCs from patients with ESRD were expected to have a similar pluripotent potential to that of cells from normal subjects.
The next consideration was whether reprogrammed hiPSCs could retain the specific characteristics of a disease. Until now, disease modeling employing hiPSCs has been mainly focused on hereditary or familial disorders because reprogrammed hiPSCs essentially retain the germline genetic defects found in somatic cells. Therefore, target cell types differentiated from hiPSCs with genetic defects are expected to show the phenotype or molecular signature of the genetic disease associated with the mutations. Indeed, the cause of ESRD in three patients was either diabetes mellitus or immunoglobulin A nephropathy, which basically do not have significant germline mutations at baseline [2325]. Recently, it was suggested that hiPSCs generated using somatic cells from patients with aging-related diseases, including chronic kidney disease, may retain the somatic memory associated with cell identity [26]. Indeed, in contrast with the complete loss of germ cell memory in embryonic stem cells, there is some evidence that hiPSCs partially retain the characteristics of their origin somatic cells, such as the age of the donor [27,28]. Therefore, some recent studies have focused on generating hiPSCs from diseased somatic cells to use as a source for regeneration or for research into the mechanism of disease or the senescence of target cells or tissues.
So, we presumed that ESRD-hiPSCs may retain the characteristics of ESRD and performed a comparison between ESRD-hiPSC-ECs and HC-hiPSC-ECs in the following three aspects: efficacy of EC differentiation, results of functional assay using a tube formation assay, and results of molecular signature analysis by microarray. During differentiation into hiPSC-ECs, we observed differences between ESRD-hiPSCs and HC-hiPSCs in terms of differentiation efficacy. ESRD-hiPSC-ECs consistently generated fewer hiPSC-ECs (estimated as the proportion of CD31+ cells) in comparison with HC-hiPSC-ECs. Indeed, patient-derived hiPSCs can be defective in disease-related cell differentiation; for example, hiPSCs derived from a patient with Prader-Willi syndrome exhibit neuronal differentiation defects [29].
Next, we evaluated the functional differences between ESRD-hiPSC-ECs and HC-hiPSC-ECs. For the evaluation of EC dysfunction in an in vitro model, tube formation assay, a test designed to evaluate angiogenesis, has been widely employed [16,30]. We observed that, unlike HC-hiPSC-ECs, ESRD-hiPSC-ECs failed to form interconnecting branching point networks. Our findings suggest that ESRD-hiPSC-ECs lose their vasculature formation ability. It is speculated that somatic cells exposed to a uremic state for a long time undergo an epigenetic change, which is memorized and partially retained in the reprogrammed hiPSCs. [27] This epigenetic defect in ESRD-hiPSC-ECs may result in their functional disability in terms of angiogenesis, but further investigation is necessary to clarify this issue.
Lastly, we conducted a microarray analysis to investigate the underlying mechanism associated with the vasculature functional disability observed in ESRD-hiPSC-ECs in comparison with HC-hiPSC-ECs. As a result, it was determined that genes associated with the regulation of the basement membrane, ECM degradation, and EC migration were differentially expressed between ESRD-hiPSC-ECs and HC-hiPSC-ECs. Endothelin 1 (EDN1), mainly produced by vascular ECs, induces vasoconstriction in physiological conditions [31]. Angiopoietin 2 (ANGPT2) is involved in angiogenesis and modulates EC differentiation, survival, and stability [32]. Matrix-remodeling associated 5 (MXRA5) is involved in adhesion and remodeling [33]. Membrane metallo-endopeptidase (MME) regulates the inflammatory response and insulin signaling in white preadipocytes [34]. Finally, cell migration-inducing hyaluronan binding protein (CEMIP) promotes cell migration [35]. The observed defects in the transcription of essential molecules in hiPSC-ECs from patients with ESRD may contribute to the defects in angiogenesis revealed by the tube formation assay [36].
This study had some limitations. First, we did not clearly demonstrate the epigenetic changes in ESRD-hiPSC or ESRD-hiPSC-ECs—for example, the methylation of specific genes. Robust gene-sequencing analysis may help to clarify this issue. Second, the number of patients who participated was limited and their underlying renal diseases varied. Indeed, it is possible to consider that the characteristics of endothelial dysfunction in diabetic patients are fundamentally different from those of nondiabetic patients. However, a considerable effort is required to reprogram hiPSCs and differentiate hiPSC-ECs in order to conduct research using a large patient group. The development of more efficient and faster iPSCs reprogramming techniques will help to mitigate this issue. Lastly, one of the inherent limitations of the predictive power of in vitro iPSC-based model systems is that they may not demonstrate sufficient complexity to approximate in vivo physiology. To overcome this, it would be preferable to use self-assembled vascular organoids and vasculature-on-a-chip platforms for studying the effects of disease processes and drugs on iPSC-derived vasculature. Lastly, two of the three ESRD patients or HCs were female. There are sex differences in the remodeling of DNA methylation marks; hence, these sex differences can be connected to differences in developmental potential between female and male iPSCs [37,38]. Therefore, it may be necessary to conduct further research among subjects of the same sex.
In conclusion, our results suggest that hiPSC-ECs derived from patients with ESRD may demonstrate functional and molecular characteristics of EC dysfunction. Accordingly, our in vitro model of hiPSC-ECs in patients with ESRD may be helpful to elucidate EC dysfunction and establish a platform for screening drug candidates.

Notes

Conflicts of interest

All authors have no conflicts of interest to declare.

Funding sources

This study was supported by the Basic Science Research Program through the National Research Foundation of Korea (NRF), funded by the Ministry of Education, Science and Technology, Republic of Korea (NRF-2020R1C1C1008346), and by financial support from the Catholic Medical Center Research Foundation provided in the program year of 2020.

Authors’ contributions

Conceptualization: BHC

Formal analysis: KWK, YJS, EJK, SWL

Funding acquisition: BHC

Investigation: KWK, YJS, BMK, SC

Methodology: CWY

Writing–original draft: KWK, YJS. SC, BMK

Writing–review & editing: BHC, CWY, EJK, SWL

All authors read and approved the final manuscript.

Acknowledgments

We thank the blood donors who gave their time to participate in this study.

Figure 1.

Characterization of hiPSCs from patients with ESRD and healthy controls.

(A) Patient-derived PBMCs were reprogrammed to hiPSCs. The hiPSCs expressed the pluripotency markers NANOG (red), SSEA4 (green), and TRA-1-81 (green), as evaluated by immunofluorescence staining. The scale bar represents 50 µM. Nuclei were counterstained with DAPI. (B) hiPSCs expressed the pluripotency markers NANOG, SSEA4, and TRA-1-81 based on flow cytometry analysis. (C) hiPSCs were stained with alkaline phosphatase substrate to assess pluripotency (100×).
ESRD, end-stage renal disease; hiPSCs, human induced pluripotent stem cells; PBMC, peripheral blood mononuclear cell; DAPI, 4′,6-diamidino-2-phenylindole.
j-krcp-20-252f1.jpg
Figure 2.

EC differentiation of hiPSCs from patients with ESRD and HCs.

(A) Schematic overview of EC differentiation. (B) Expression levels of the EC markers CD31, CD34, CD133, VWF, Flk-1, and Flt in purified hiPSC-ECs before and after CD31+ isolation, as determined by immunofluorescence staining with quantitative analysis. Scale bar represents 50 µM. **p < 0.05 relative to HC-iPSC-ECs. (C) CD31+ expression on hiPSC-ECs differentiated from patients with ESRD and HCs, as determined by flow cytometry analysis. **p < 0.01 relative to HC-iPSC-ECs.
EC, endothelial cell; ESRD, end-stage renal disease; Flk-1, fetal liver kinase 1; Flt-1, vascular endothelial growth factor receptor 1; HC, healthy control; hiPSC, human induced pluripotent stem cell; SSC, side scatter; vWF, von Willebrand factor.
j-krcp-20-252f2.jpg
Figure 3.

Fluorescence microscopy imaging and quantification of tube formation in hiPSC-derived ECs from patients with ESRD and HCs.

(A) hiPSC-ECs showed EC morphologies. Cells formed tube-like structures in Matrigel (BD, Franklin Lakes, NJ, USA). Scale bar represents 200 µM. (B) Bar graphs represent the area (%) of the tube-like structure in Matrigel, presented as mean ± standard deviation values. *p < 0.05 relative to HC-iPSC-ECs. (C) Cell viability of ECs detected using Cell Counting Kit-8 assay (Dojindo Molecular Technologies, Kumamoto, Japan) for 24 or 48 hours, respectively. Data are presented as mean ± standard error values and are representative of at least three independent experiments. *p < 0.05 relative to HC-iPSC-ECs.
EC, endothelial cell; ESRD, end-stage renal disease; HC, healthy control; hiPSC, human induced pluripotent stem cell.
j-krcp-20-252f3.jpg
Figure 4.

RNA microarray analysis of hiPSC-derived ECs from patients with ESRD and HCs.

(A) Hierarchical clustering analysis of gene expression in hiPSC-derived ECs from patients with ESRD and HCs, respectively. Heatmap showing 219 significantly (p < 0.05) differentially expressed transcripts between HC-iPSC-ECs (n = 3) and ESRD-hiPSC-ECs (n = 3). The 219 genes were selected based on the criteria described in the Methods section. Expression levels are normalized for each gene; yellow represents high expression and blue represents low expression. (B) Scatterplot of expression levels in HC-iPSC-ECs and ESRD-hiPSC-ECs. (C) Enriched KEGG pathways in ESRD-hiPSC-ECs in comparison with HC-hiPSC-ECs.
EC, endothelial cell; ESRD, end-stage renal disease; HC, healthy control; hiPSC, human induced pluripotent stem cell, KEGG, Kyoto Encyclopedia of Genes and Genomes.
*indicates pathways associated with EC dysfunction.
j-krcp-20-252f4.jpg
Figure 5.

Protein-protein interaction network analysis between genes expressed in ESRD-hiPSC-ECs as compared with HC-hiPSC-ECs.

(A) Results of upregulated genes. (B) Results of downregulated genes.
EC, endothelial cell; ESRD, end-stage renal disease; HC, healthy control; hiPSC, human induced pluripotent stem cell; STRING, Search Tool for the Retrieval of Interacting Genes.
j-krcp-20-252f5.jpg
Table 1.
Baseline characteristics of patients with ESRD and healthy controls
Characteristic ESRD
Healthy control
Patient 1 Patient 2 Patient 3 Patient 1 Patient 2 Patient 3
Age (yr) 40 56 42 42 36 40
Sex Female Male Female Female Male Female
Primary renal disease IgAN DM IgAN NA NA NA
Dialysis duration (mo) 0 0 0 NA NA NA
Smoking history No Yes No No No No
Body mass index (kg/m2) 20.4 24.2 24.7 20.9 21.5 20.7
Hypertension Yes Yes Yes No No No
Cardiovascular disease No No No No No No
Creatinine (mg/dL) 5.41 5.84 7.10 0.64 0.98 0.80
BUN (mg/dL) 45.4 76.1 56.4 15.6 14.1 17.3
WBC (109/L) 5.65 4.53 4.06 4.20 5.35 5.21
Hemoglobin (g/dL) 10.6 10.9 10.5 13.0 15.2 13.8
Hematocrit (%) 31.7 33.7 30.8 38.8 45.4 40.1
Platelet (109/L) 174 198 154 266 432 498
CRP (mg/dL) <0.03 <0.03 <0.03 <0.03 <0.03 <0.03
Triglyceride (mg/dL) 162 143 241 213 144 55
Cholesterol (mg/dL)
 Total 118 140 190 205 142 202
 HDL 34 48 40 65 50 75
 LDL 53* 82* 89 90 67 137

BUN, blood urea nitrogen; CRP, C-reactive protein; DM, diabetes mellitus; ESRD, end-stage renal disease; HDL, high-density lipoprotein; IgAN, immunoglobulin A nephropathy; LDL, low-density lipoprotein; NA, not applicable; WBC, white blood cell.

*Any type of 3-hydroxy-3-methyl-glutaryl-coenzyme reductase inhibitor (statin) therapy.

Table 2.
KEGG pathway enrichment analyses of DEGs
KEGG ID KEGG pathway Count FDR Gene(s)
04514 Cell adhesion molecules (CAMs) 7 7.347E-05 CD34, CLDN10, CDH5,CDH1, CLDN6, CLDN7, PDCD1LG2
04512 ECM-receptor interaction 5 4.807E-04 ITGA11, VTN, LAMA1, SPP1, TNC
04510 Focal adhesion 5 6.53E-03 ITGA11, VTN, LAMA1, SPP1, TNC
04670 Leukocyte transendothelial migration 4 1.17E-02 CLDN10, CDH5,CLDN6, CLDN7
04530 Tight junction 4 2.759 E-02 CLDN10, CLDN6, CLDN7, MARVELD2
04620 Toll-like receptor signaling pathway 3 8.557E-02 CCL5, SPP1, CXCL10

DEG, differentially expressed gene; ECM, extracellular matrix; FDR, false discovery rate; KEGG, Kyoto Encyclopedia of Genes and Genomes.

References

1. Jin DC, Yun SR, Lee SW, et al. Current characteristics of dialysis therapy in Korea: 2016 registry data focusing on diabetic patients. Kidney Res Clin Pract 2018;37:20–29.
crossref pmid pmc
2. Herzog CA, Asinger RW, Berger AK, et al. Cardiovascular disease in chronic kidney disease. A clinical update from Kidney Disease: Improving Global Outcomes (KDIGO). Kidney Int 2011;80:572–586.
crossref pmid
3. Jin DC. Analysis of mortality risk from Korean hemodialysis registry data 2017. Kidney Res Clin Pract 2019;38:169–175.
crossref pmid pmc
4. Mallamaci F, Tripepi G, Cutrupi S, Malatino LS, Zoccali C. Prognostic value of combined use of biomarkers of inflammation, endothelial dysfunction, and myocardiopathy in patients with ESRD. Kidney Int 2005;67:2330–2337.
crossref pmid
5. Lindner A, Charra B, Sherrard DJ, Scribner BH. Accelerated atherosclerosis in prolonged maintenance hemodialysis. N Engl J Med 1974;290:697–701.
crossref pmid
6. Ketteler M, Block GA, Evenepoel P, et al. Executive summary of the 2017 KDIGO Chronic Kidney Disease-Mineral and Bone Disorder (CKD-MBD) Guideline Update: what’s changed and why it matters. Kidney Int 2017;92:26–36.
crossref pmid
7. Kumar S, Blangero J, Curran JE. Induced pluripotent stem cells in disease modeling and gene identification. Methods Mol Biol 2018;1706:17–38.
crossref pmid
8. Chun YS, Chaudhari P, Jang YY. Applications of patient-specific induced pluripotent stem cells; focused on disease modeling, drug screening and therapeutic potentials for liver disease. Int J Biol Sci 2010;6:796–805.
crossref pmid pmc
9. Kondo T, Asai M, Tsukita K, et al. Modeling Alzheimer’s disease with iPSCs reveals stress phenotypes associated with intracellular Aβ and differential drug responsiveness. Cell Stem Cell 2013;12:487–496.
crossref pmid
10. Brennand K, Savas JN, Kim Y, et al. Phenotypic differences in hiPSC NPCs derived from patients with schizophrenia. Mol Psychiatry 2015;20:361–368.
crossref pmid
11. Rashid ST, Corbineau S, Hannan N, et al. Modeling inherited metabolic disorders of the liver using human induced pluripotent stem cells. J Clin Invest 2010;120:3127–3136.
crossref pmid pmc
12. Drawnel FM, Boccardo S, Prummer M, et al. Disease modeling and phenotypic drug screening for diabetic cardiomyopathy using human induced pluripotent stem cells. Cell Rep 2014;9:810–821.
crossref pmid
13. Lan F, Lee AS, Liang P, et al. Abnormal calcium handling properties underlie familial hypertrophic cardiomyopathy pathology in patient-specific induced pluripotent stem cells. Cell Stem Cell 2013;12:101–113.
crossref pmid pmc
14. Cruvinel E, Ogusuku I, Cerioni R, et al. Long-term single-cell passaging of human iPSC fully supports pluripotency and high-efficient trilineage differentiation capacity. SAGE Open Med 2020;8:2050312120966456.
crossref pmid pmc
15. Rufaihah AJ, Huang NF, Jamé S, et al. Endothelial cells derived from human iPSCS increase capillary density and improve perfusion in a mouse model of peripheral arterial disease. Arterioscler Thromb Vasc Biol 2011;31:e72–e79.
crossref pmid pmc
16. DeCicco-Skinner KL, Henry GH, Cataisson C, et al. Endothelial cell tube formation assay for the in vitro study of angiogenesis. J Vis Exp 2014;91:e51312.
17. Szklarczyk D, Franceschini A, Wyder S, et al. STRING v10: protein-protein interaction networks, integrated over the tree of life. Nucleic Acids Res 2015;43:D447–D452.
crossref pmid
18. Schulkens IA, Castricum KC, Weijers EM, Koolwijk P, Griffioen AW, Thijssen VL. Expression, regulation and function of human metallothioneins in endothelial cells. J Vasc Res 2014;51:231–238.
crossref pmid
19. Freedman BS. Modeling kidney disease with iPS cells. Biomark Insights 2015;10(Suppl 1):153–169.
crossref pmid pmc
20. Grskovic M, Javaherian A, Strulovici B, Daley GQ. Induced pluripotent stem cells: opportunities for disease modelling and drug discovery. Nat Rev Drug Discov 2011;10:915–929.
crossref pmid
21. Nakanishi M, Otsu M. Development of Sendai virus vectors and their potential applications in gene therapy and regenerative medicine. Curr Gene Ther 2012;12:410–416.
crossref pmid pmc
22. Chen G, Gulbranson DR, Hou Z, et al. Chemically defined conditions for human iPSC derivation and culture. Nat Methods 2011;8:424–429.
crossref pmid pmc
23. Morgado-Pascual JL, Marchant V, Rodrigues-Diez R, et al. Epigenetic modification mechanisms involved in inflammation and fibrosis in renal pathology. Mediators Inflamm 2018;2018:2931049.
crossref pmid pmc
24. Cañadas-Garre M, Anderson K, McGoldrick J, Maxwell AP, McKnight AJ. Genomic approaches in the search for molecular biomarkers in chronic kidney disease. J Transl Med 2018;16:292.
crossref pmid pmc
25. Tanaka T. Epigenetic changes mediating transition to chronic kidney disease: hypoxic memory. Acta Physiol (Oxf) 2018;222:e13023.
crossref pmid
26. Wang D, Chen W. Which is the pivotal vessel in vascular supercharging? An assessment of three forms of vascular supercharging models using indocyanine green fluorescence angiography. J Surg Res 2020;251:16–25.
crossref pmid
27. Lo Sardo V, Ferguson W, Erikson GA, Topol EJ, Baldwin KK, Torkamani A. Influence of donor age on induced pluripotent stem cells. Nat Biotechnol 2017;35:69–74.
crossref pmid
28. Khoo TS, Jamal R, Abdul Ghani NA, Alauddin H, Hussin NH, Abdul Murad NA. Retention of somatic memory associated with cell identity, age and metabolism in induced pluripotent stem (iPS) cells reprogramming. Stem Cell Rev Rep 2020;16:251–261.
crossref pmid
29. Soeda S, Saito R, Fujita N, Fukuta K, Taniura H. Neuronal differentiation defects in induced pluripotent stem cells derived from a Prader-Willi syndrome patient. Neurosci Lett 2019;703:162–167.
crossref pmid
30. Zhao WN, Xu SQ, Liang JF, et al. Endothelial progenitor cells from human fetal aorta cure diabetic foot in a rat model. Metabolism 2016;65:1755–1767.
crossref pmid
31. Shinagawa S, Okazaki T, Ikeda M, et al. T cells upon activation promote endothelin 1 production in monocytes via IFN-γ and TNF-α. Sci Rep 2017;7:14500.
crossref pmid pmc
32. Mofarrahi M, Hussain SN. Expression and functional roles of angiopoietin-2 in skeletal muscles. PLoS One 2011;6:e22882.
crossref pmid pmc
33. Giladi E, Walker MG, Wang JZ, Volkmuth W. SST: an algorithm for finding near-exact sequence matches in time proportional to the logarithm of the database size. Bioinformatics 2002;18:873–877.
crossref pmid
34. Ramirez AK, Dankel S, Cai W, Sakaguchi M, Kasif S, Kahn CR. Membrane metallo-endopeptidase (Neprilysin) regulates inflammatory response and insulin signaling in white preadipocytes. Mol Metab 2019;22:21–36.
crossref pmid pmc
35. Evensen NA, Kuscu C, Nguyen HL, et al. Unraveling the role of KIAA1199, a novel endoplasmic reticulum protein, in cancer cell migration. J Natl Cancer Inst 2013;105:1402–1416.
crossref pmid pmc
36. Maciel RA, Cunha RS, Busato V, et al. Uremia impacts VE-cadherin and ZO-1 expression in human endothelial cell-to-cell junctions. Toxins (Basel) 2018;10:404.
crossref pmid pmc
37. Tchieu J, Kuoy E, Chin MH, et al. Female human iPSCs retain an inactive X chromosome. Cell Stem Cell 2010;7:329–342.
crossref pmid pmc
38. Shen Y, Matsuno Y, Fouse SD, et al. X-inactivation in female human embryonic stem cells is in a nonrandom pattern and prone to epigenetic alterations. Proc Natl Acad Sci U S A 2008;105:4709–4714.
crossref pmid pmc


ABOUT
BROWSE ARTICLES
EDITORIAL POLICY
FOR CONTRIBUTORS
Editorial Office
#301, (Miseung Bldg.) 23, Apgujenog-ro 30-gil, Gangnam-gu, Seoul 06022, Korea
Tel: +82-2-3486-8736    Fax: +82-2-3486-8737    E-mail: registry@ksn.or.kr                

Copyright © 2024 by The Korean Society of Nephrology.

Developed in M2PI

Close layer