


Introduction
Autosomal dominant polycystic kidney disease (ADPKD) is the most common inherited cystic kidney disease resulting in end-stage kidney disease [1]. In ADPKD, as multiple cysts grow from kidney tubules, they compress renal tissue and vascular structures, and renal ischemia and inflammation eventually result in kidney failure [2]. Recently, novel drugs including the vasopressin receptor antagonist have been introduced to attenuate cyst growth and renal function decline for ADPKD patients [3]. Since renal function remains stable in the early stage of ADPKD and starts to decline only after cysts substitute normal renal tissues, identifying rapid progressors among ADPKD patients for whom novel drugs may be beneficial is useful [4].
Mayo imaging classification (MIC) is currently the best prediction model for selecting rapid progressors among ADPKD patients. With this prediction model, patients with typical ADPKD can be subclassified into class 1A through 1E according to height-adjusted total kidney volume (htTKV) for age [5]. From a theoretical starting htTKV of 150 mL/m, class 1A patients have a yearly htTKV increase of less than 1.5% while class 1B patients show an increase of 1.5% to 3.0%, class 1C patients 3.0% to 4.5%, class 1D patients 4.5% to 6.0%, and class 1E patients more than 6.0%. Recent papers suggested that prognostic enrichment strategies such as MIC are useful for designing clinical trials for ADPKD to increase the power of the study and reduce cost [6,7]. However, this has not been validated in a Korean ADPKD population. A recent report from Higashihara et al. [8] showed that a starting htTKV of 130 mL/m instead of 150 mL/m resulted in the prediction of more constant htTKV growth rates. However, the clinical efficacy of different equations on the prediction of renal outcome has not been evaluated.
This study was performed to evaluate the validity of MIC in defining rapid progressors among Korean ADPKD patients and to describe the clinical characteristics of rapid progressors among Korean ADPKD patients.
Methods
Study population
Among 364 adult ADPKD patients who were enrolled in the KNOW-CKD (KoreaN Cohort Study for Outcomes in Patients With Chronic Kidney Disease) from 2011 to 2016, a total of 178 typical ADPKD patients with ≥two kidney image studies with more than 1 year apart were included in this analysis. The detailed study design and methods are described in the previous studies [9,10]. We excluded the following patients from the analysis: 140 patients without initial kidney images, 37 patients without follow-up kidney images, and nine patients who received Tolvaptan treatment during follow-up (Fig. 1). The study proposal was approved by the Institutional Review Board at Seoul National University Hospital (No. 1104-089-359). Informed consent was obtained from all participants upon study enrollment.
Total kidney volume measurement
Abdominal computed tomography (CT) with or without contrast enhancement was performed. All CT exams were performed with 3 to 5 mm thickness, and axial, coronal, and sagittal views were obtained to calculate total kidney volume (TKV). TKV was measured by one professional radiologist using both ellipsoid equation (TKVe) and stereologic method (TKVs) using ImageJ [5,11]. The ellipsoid equation used was TKVe = π/6 × L × W × D; where D = maximum depth, L = average of sagittal and coronal maximal longitudinal length, and W = maximal width perpendicular to L.
Definition of rapid progressors
In the original MIC, the htTKV growth rate was estimated for classification using the equation [htTKV at age t] = K (1 + α/100)(t–A), where K (theoretical initial htTKV) = 150 and A (theoretical starting age) = 0 [5]. However, a Japanese group recently suggested using K = 130 instead of K = 150 for the stable estimated htTKV slope (eHTKV-α) from baseline through follow-up in patients without Tolvaptan treatment [8]. We, therefore, calculated eHTKV-α by both equations using K = 130 and K = 150. We compared the two equations to finalize the prediction model for the Korean ADPKD population. Rapid progressor was defined as eHTKV-α ≥ 3.0%, which corresponds to MIC 1C through 1E.
Data collection
Baseline characteristics were collected during the enrollment period. Age, sex, presence of hypertension, height, weight, body mass index, and systolic and diastolic blood pressure were collected at the initial visit. Laboratory parameters including plasma hemoglobin, serum uric acid and albumin, serum creatinine, and random urine protein-to-creatinine ratio were assessed at the initial visit. The glomerular filtration rate (GFR) was estimated by the Chronic Kidney Disease Epidemiology Collaboration (CKD-EPI) equation. The estimated GFR (eGFR) was measured annually and htTKV was measured biannually until March 31, 2020.
Genotyping
A total of 162 patients had available genotype data from an inherited cystic kidney disease study [12]. Genomic DNA was extracted from whole blood and targeted exome sequencing was performed for 89 ciliopathy genes included in the gene panel. Genotype was subclassified as truncating mutation of PKD1 (PKD1-PT), in-frame insertion/deletion of PKD1 (PKD1-ID), non-truncating mutation of PKD1 (PKD1-NT), and PKD2 mutations.
Outcome measurement
Primary outcome was renal composite outcome, which consists of doubling of serum creatinine, 50% decline of eGFR, or initiation of renal replacement therapy. Secondary outcomes were annual percent change of htTKVs (mHTKV-α) and annual decline rate of eGFR (mGFR-α). The mGFR-α was measured by a slope-based parameter using a mixed-effects model [13].
Statistical analyses
The correlation between TKVe and TKVs was compared using linear regression analysis. Baseline characteristics were compared between rapid progressors and slow progressors using Student t test for continuous variables and chi-square test for categorical variables. Multivariable Cox regression analysis was performed to evaluate rapid progressor as an independent factor for renal composite outcome after adjustment for sex, body mass index, systolic blood pressure, serum uric acid, baseline eGFR, and genotype. To compare mHTKV-α and mGFR-α among different MIC classes or genotypes, the Kruskal-Wallis test was performed. Statistical analyses were performed using SPSS version 20.0 (IBM Corp., Armonk, NY, USA).
Results
Correlation between total kidney volumes using ellipsoid and stereologic methods
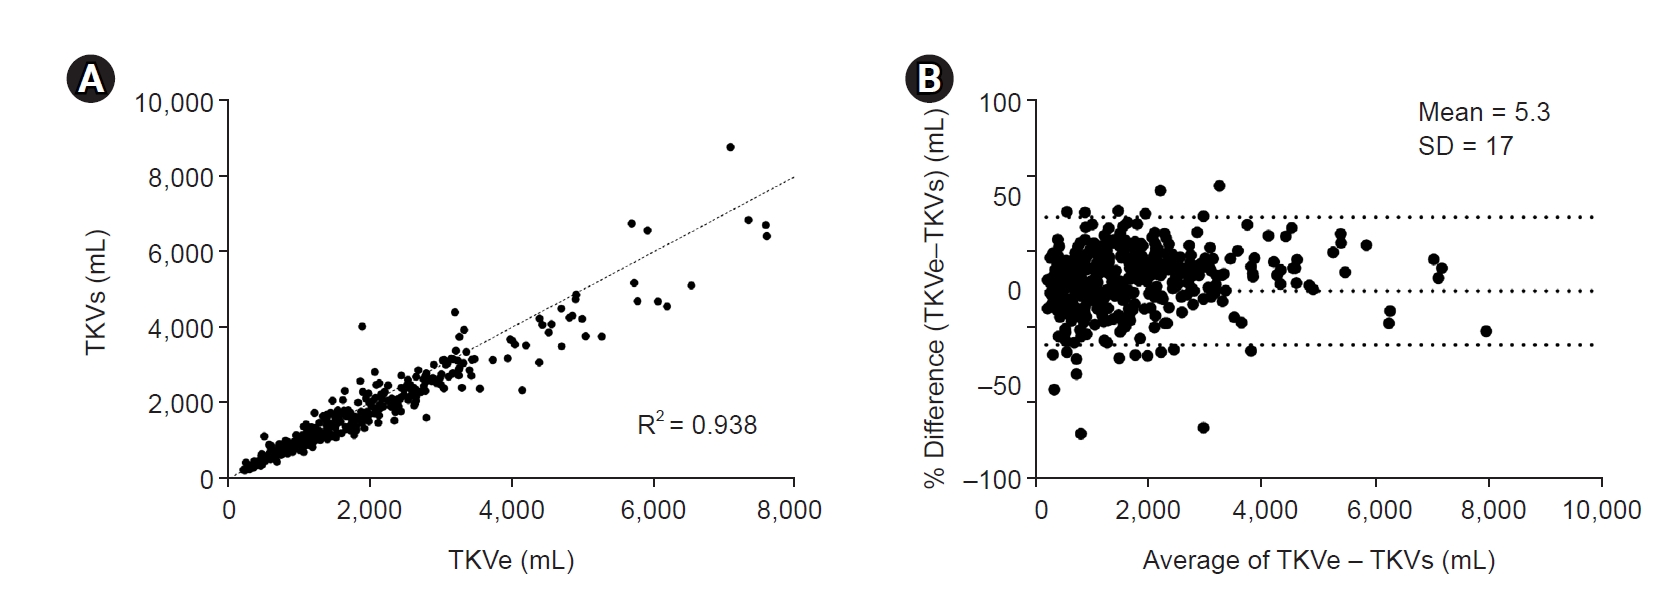
TKVe was highly correlated with TKVs (R2 = 0.938) (Fig. 2A). However, TKVe was more likely to overestimate the TKVs value, showing a mean deviation of 5.3% and standard deviation of 17% in the Bland-Altman plot (Fig. 2B). As the TKV gets larger, the TKVe value gets larger than the TKVs value. Therefore, we decided to use TKVs in the current analysis.
Comparison of estimated height-adjusted total kidney volume slopes using different prediction models
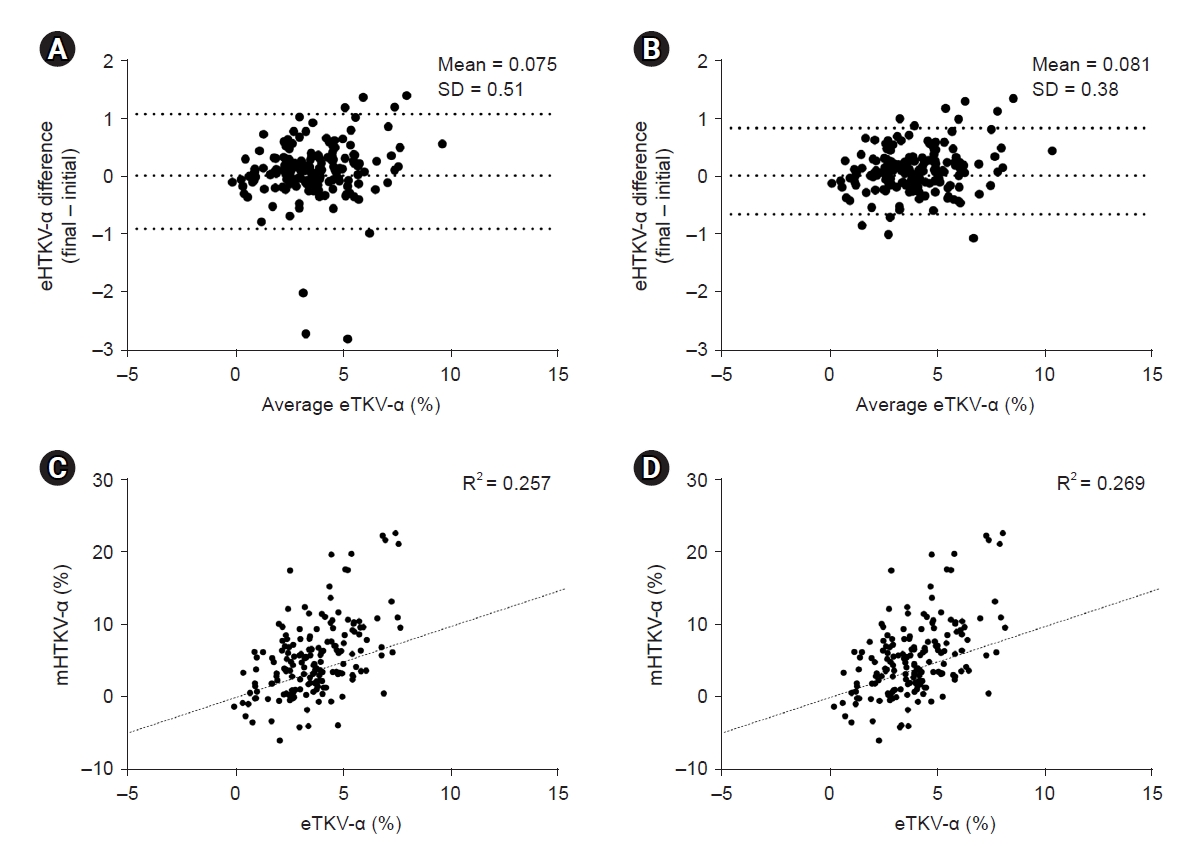
We compared eHTKV-α (A = 0 and K = 130) and eHTKV-α (A = 0 and K = 150) in our cohort. We calculated eHTKV-α from the initial and final htTKV measurements and compared the stability between values. When we applied the original equation used in MIC (A = 0 and K = 150) (Fig. 3A), the difference between initial and final values was larger than the modified equation from Higashihara’s group (A = 0 and K = 130) (Fig. 3B). The mHTKV-α according to the initial eHTKV-α showed good correlation in both equations (Fig. 3C, D). When we analyzed the proportion of Higashihara MIC according to original MIC at the individual level, the Higashihara MIC tended to overestimate MIC classes compared with the original MIC (Supplementary Table 1, available online). Therefore, slow progressors by original MIC may be included in the rapid progressors when using the modified equation from Higashihara’s group (A = 0 and K = 130).
When we compared the change in MIC classes from initial to last CT exam, the prediction model using eHTKV-α (A = 0 and K = 130) showed an overall more stationary proportion of classes compared with that using eHTKV-α (A = 0 and K = 150) (Supplementary Fig. 1, available online). However, at the individual level, approximately the same number of patients changed from rapid progressors to slow progressors and vice versa between the two prediction models (Supplementary Table 2, available online). Those who changed MIC classes during follow-up were of younger age than those who did not change their classes during follow-up (42.9 ± 11.0 years vs. 47.5 ± 10.3 years, p = 0.03).
Clinical parameters associated with rapid progressors among Korean autosomal dominant polycystic kidney disease
A total of 110 patients (61.8%) were classified as rapid progressors and 68 patients (38.2%) were classified as slow progressors according to eHTKV-α (A = 0 and K = 150) (Table 1). Rapid progressors were younger at initial visit and predominantly male (60.0% vs. 35.3%, p = 0.001). Rapid progressors also showed higher systolic and diastolic blood pressures, higher body mass index, and higher serum uric acid. Baseline eGFR was significantly lower for rapid progressors compared with that of slow progressors (73.3 ± 27.6 mL/min/1.73 m2 vs. 86.4 ± 25.3 mL/min/1.73 m2, p = 0.002). However, the proportion of PKD1 genotype was not different between groups (83.2% vs. 80.4%, p = 0.69). The distribution of PKD genotype subclasses (PKD1-PT, PKD1-ID, PKD1-NT, PKD2, and no mutation) did not differ among MIC classes (Supplementary Fig. 2, available online).
Renal outcome according to Mayo imaging classification
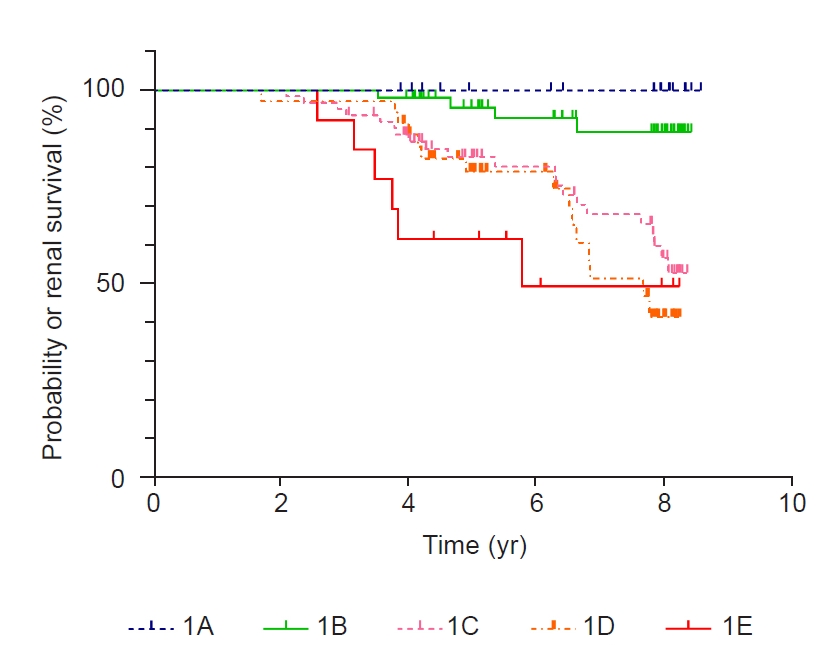
A total of 46 renal events occurred during the mean follow-up duration of 6.2 ± 1.9 years. Renal events occurred more frequently among rapid progressors compared with slow progressors defined by original MIC (42 events vs. four events, p < 0.001) (Fig. 4). The clinical characteristics of the patients with renal outcome are described in Supplementary Table 3 (available online). The Cox-proportional hazard model was used to evaluate independent predictors of renal outcome. Age, male sex, body mass index, systolic blood pressure, serum uric acid, PKD1 genotype, baseline eGFR, macroalbuminuria, and rapid progressors were included as covariates. We compared the renal outcomes between slow progressors and rapid progressors using MIC (A = 0 and K = 130) and found that rapid progressor was not an independent predictor for renal outcome (hazard ratio [HR], 1.86; 95% confidence interval [CI], 0.60–5.76; p = 0.28). However, when we applied MIC (A = 0 and K = 150, an original equation), rapid progressor was an independent predictor for renal outcome (HR, 4.09; 95% CI, 1.23–13.54; p = 0.02) (Table 2) together with baseline eGFR and macroalbuminuria.
Annual percent change of height-adjusted total kidney volumes and annual decline rate of estimated glomerular filtration rates according to Mayo imaging classification
To validate the clinical utility of MIC among the Korean ADPKD population, we evaluated mHTKV-α and mGFR-α according to MIC classes (Table 3). The mHTKV-α was calculated from repeated measures of TKVs during the follow-up. During a mean follow-up duration of 5.8 ± 8.8 years, 3.3 CT exams were taken on average. The mHTKV-α was larger in rapid progressors (5.26% per year in 1C, 9.39% in 1D, and 11.72% in 1E) compared with that in slow progressors (1.22% in 1A and 3.83% in 1B). In addition, mGFR-α was the fastest in class 1E (–4.52 mL/min/yr) and the slowest in class 1A (–1.54 mL/min/yr). Neither mHTKV-α nor mGFR-α showed statistical differences according to genotype (Supplementary Table 4, available online).
Discussion
This study evaluated the clinical utility of MIC among Korean ADPKD patients to predict renal outcome. We have confirmed that TKVe and TKVs are strongly correlated. We compared the original equation from MIC (A = 0 and K = 150) and the modified equation from Higashihara’s group (A = 0 and K = 130) and found that the Higashihara equation showed more stable prediction over years. However, Higashihara’s equation did not predict renal outcome according to MIC. Rapid progressor applied by original equation from MIC was an independent predictor for renal outcome together with macroalbuminuria and baseline eGFR. Rapid progressors also demonstrated greater mHTKV-α and mGFR-α compared with slow progressors.
This is the first study to validate the clinical utility of MIC to predict renal outcome in a Korean ADPKD population. Recently, Higashihara’s group suggested to use a theoretical starting htTKV of 130 mL/m instead of 150 mL/L when estimating annual TKV growth [8]. The authors stated that the modified equation showed a more stationary htTKV growth rate. Our study also demonstrated that Higashihara’s equation resulted in a more stable eHTKV-α. However, while eHTKV-α was more stable during follow-up when using Higashihara’s equation (A = 0 and K = 130), the change in MIC at the individual level did not differ between the original and modified equations. Moreover, rapid progressors based on a modified equation did not predict poor renal outcome while the original MIC did. Therefore, the original MIC (A = 0 and K =150) can be useful in the prediction of renal outcome among Korean ADPKD patients.
Our data demonstrated that TKVe strongly correlates with TKVs (R2 = 0.938). A previous study by Irazabal et al. [5] also showed similar results (R2 = 0.979). However, our study showed a wider difference between TKVe and TKVs. The difference may come from the different modalities used in the studies. The previous study by Irazabal [5] measured TKVe using magnetic resonance imaging, whereas our study used nonenhanced CT. The difference may also come from the level of expertise in TKVe measurement. Higashihara’s group suggested to use a modified ellipsoid equation of π/24 × L × (W + WW)2 to accurately estimate TKV; where L = maximal longitudinal length, W = maximal width perpendicular to L, and WW = width greater than W [14]. However, modified ellipsoid equation takes longer time to measure than original formula, and the reproducibility may even be lower when the measurement is performed by a less experienced researcher. However, previous studies suggested that the ellipsoid method can be reliably applied to clinical management when assessing renal risk in the individual patient [15,16].
Our study showed that MIC classes can change over time in some individuals. Our analysis demonstrated that patients whose MIC classes changed over time were younger than those whose MIC classes were stationary. A previous review by Chebib and Torres [4] also recommended to use a more accurate measurement (planimetry or stereology) for young patients with MIC 1B or 1C. Therefore, we suggest using either the stereologic method or repeated measure of TKVe over time in defining rapid progressors among a young population to avoid denying potential treatment opportunities for patients at risk.
The risk factors associated with rapid progressors defined by MIC were largely in concordance with the results from previous studies. Our study demonstrated that younger age at enrollment, male sex, higher systolic and diastolic blood pressure, higher body mass index, higher serum uric acid, and lower eGFR were risk factors associated with rapid progressors defined by MIC. A previous study demonstrated that younger age at diagnosis and male sex were the nonmodifiable factors associated with rapid progression [17–19]. High blood pressure is one of the strongest risk factors for rapid progression [20,21]. A recent article also showed that overweight and obesity are risk factors for ADPKD [22]. A recent study by a Japanese group also suggested that higher serum uric acid was associated with greater eGFR change overtime [23]. However, when we performed multivariable Cox regression analysis for renal composite outcome, baseline eGFR, rapid progressor defined by MIC, and macroalbuminuria were the independent risk factors for renal composite outcome. Our results are in line with previous studies suggesting that age-adjusted htTKV and baseline eGFR are the most important factors for rapid progression [24,25].
Rapid progressors defined by MIC (A = 0 and K = 150) also effectively predict renal outcome among the Korean ADPKD population. The mGFR-α declined faster while the mHTKV-α became larger as the MIC classes progressed. However, Korean ADPKD patients showed faster enlargement of the mHTKV-α with a similar mGFR-α according to the MIC classes compared with previous studies with a Caucasian population (Supplementary Table 5, 6; available online) [6,7]. This may be due to ethnic differences or genetic predispositions. Our previous study demonstrated that the median age at end-stage kidney disease in the Korean ADPKD cohort was 7 years later than that of the Caucasian population [25]. In addition, Korean patients with PKD1-PT genotype showed much better renal survival compared with that of the Genkyst cohort. A recent study by Horie et al. [26] also suggested that the effect of Tolvaptan upon renal function may differ from that on TKV. Therefore, cyst growth or TKV growth may not be the only mechanism of renal function decline [27]. Another explanation can be a small number of patients in each MIC class. The mHTKV-α was especially greater in MIC classes 1D and 1E where a small number of patients were included. Therefore, our result should be confirmed in the larger Korean cohort.
Apart from MIC, genotype neither was an independent factor for renal composite outcome nor significant factors affecting mGFR-α and mHTKV-α. In addition, the proportion of each PKD genotype was not different according to MIC classes. This result may be because of the small number of cases in each subgroup.
Our study has several limitations. First, we did not investigate other risk factors for renal progression including smoking, history of gross hematuria, cholesterol profile, or glucose level. The study population was from a single ethnic group, and therefore the results cannot be generalized. We did not evaluate and compare results from various methods of volumetry. Lastly, the numbers of patients included in each MIC class and genotype were too small.
This is the first study to demonstrate the clinical characteristics and renal outcome among Korean ADPKD patients according to rapid progressor defined by MIC. MIC (A = 0 and K = 150) can be used effectively to define rapid progressors for candidates of Tolvaptan treatment among Korean ADPKD patients.

 PDF Links
 PubReader
 ePub Link
 Full text via DOI
 Download Citation
 Supplement 1
 Print
Print


")


