Kidney Res Clin Pract > Volume 42(2); 2023 > Article
Suh, Oh, Choi, Kim, Bae, Ma, Oh, Yoo, Chae, Kim, and on behalf of the Korean Cohort Study for Outcomes in Patients With Chronic Kidney Disease (KNOW-CKD) Investigators: Association between urinary chloride excretion and progression of coronary artery calcification in patients with nondialysis chronic kidney disease: results from the KNOW-CKD study
This article has been corrected. See Kidney Res Clin Pract. 2023 Jul 20; 42(4): 538.

Abstract

Background

Urine chloride has recently been suggested as a biomarker of renal tubule function in patients with nondialysis chronic kidney disease (CKD), as low urinary chloride concentration is associated with an increased risk of CKD progression. We investigate the association between urinary chloride excretion and the progression of coronary artery calcification (CAC).

Methods

A total of 1,065 patients with nondialysis CKD were divided into tertiles by spot urine chloride-to-creatinine ratios. The 1st, 2nd, and 3rd tertiles were defined as low, moderate, and high urinary chloride excretion, respectively. The study outcome was CAC progression, which was defined as an increase in coronary artery calcium score of more than 200 Agatston units during the 4-year follow-up period.

Results

Compared to moderate urinary chloride excretion, high urinary chloride excretion was associated with decreased risk of CAC progression (adjusted odds ratio, 0.379; 95% confidence interval, 0.190–0.757), whereas low urinary chloride excretion was not associated with risk of CAC progression. Restricted cubic spine depicted an inverted J-shaped curve, with a significant reduction in the risk of CAC progression in subjects with high spot urine chloride-to-creatinine ratios.

Conclusion

High urinary chloride excretion is associated with decreased risk of CAC progression in patients with nondialysis CKD.

Introduction

Chronic kidney disease (CKD) is a global health problem that imposes socio-economic burdens on the medical care system [13]. Risk stratification for cardiovascular (CV) disease in patients with CKD is an issue of particular importance, as coronary artery disease (CAD), along with heart failure, is a leading cause of mortality and morbidity [4,5]. The risk of CAD is increased even in the early stages of CKD [6] and is further aggravated by the progression of CKD [7]. Because CKD staging is usually determined by the estimated glomerular filtration rate (eGFR) [8], the relationship between renal tubule function and the risk of CAD in this population is poorly understood.
Chloride is the most abundant anion in extracellular fluid and is delicately handled by specific channels and transporters [9,10]. The clinical investigation of urine chloride has been limited to the assessment of volume status [11] and calculation of anion gap [12], until a recent study reported associations of urinary chloride concentration with renal outcomes in patients with nondialysis CKD [13]. Based on the key finding that low urinary chloride concentration was significantly associated with an increased risk of CKD progression, the results suggested that adequate urinary chloride excretion may reflect functionally intact renal tubules [13]. Yet, to our best knowledge, the association between urinary chloride excretion and the risk of CAD has never been validated.
Assessments of coronary artery calcification (CAC) by cardiac computed tomography (CT) scans sensitively detect CAD, and have been validated for prediction of future CV events [1417]. Taking advantage of the availability of cardiac CT images at baseline and 4-year follow-up for a sample of 1,065 patients with nondialysis CKD, we investigated the relationships between urinary chloride excretion and progression of CAC. We hypothesized that high urinary chloride excretion is associated with decreased risk of CAC progression. In addition, we conducted a series of subgroup analyses to determine whether the relationships between urinary chloride excretion and the risk of CAC progression are modified by clinical context.

Methods

Study design

The Korean Cohort Study for Outcomes in Patients With Chronic Kidney Disease (KNOW-CKD) is a nationwide prospective cohort study involving nine tertiary-care general hospitals in Korea (NCT01630486 at https://www.clinicaltrials.gov) [18]. Korean patients with CKD from stage 1 to predialysis stage 5 who voluntarily provided informed consent were enrolled from 2011 through 2016. The study was conducted in accordance with the principles of the Declaration of Helsinki. The study protocol was approved by the Institutional Review Boards of participating centers, including Seoul National University Hospital (No. 1104-089-359), Yonsei University Severance Hospital (No. 4-2011-0163), Kangbuk Samsung Medical Center (2011-01-076), The Catholic University of Korea, Seoul St. Mary’s Hospital (No. KC11OIMI0441), Gil Hospital (No. GIRBA2553), Eulji General Hospital (No. 201105-01), Chonnam National University Hospital (No. CNUH-2011-092), and Inje University Busan Paik Hospital (No. 11-091). All participants had been under close observation, and participants who experienced study outcomes were reported by each participating center. Among 2,238 participants who were longitudinally followed up, excluding those lacking baseline measurements of chloride and creatinine (Cr) in spot urine samples, and excluding those lacking either baseline or follow-up measurements of coronary artery calcium score (CACS), a total of 1,065 subjects were finally included in the analyses (Fig. 1).

Data collection from participants

Demographic information was collected from all eligible participants, including age, sex, comorbid conditions, primary renal disease, smoking history, and medication history (angiotensin-converting enzyme inhibitor [ACEi]/angiotensin II receptor blockers [ARBs], diuretics, number of anti-hypertension drugs, statins). Trained staff members measured the heights and weights of study participants. Body mass index (BMI) was calculated as weight divided by height squared. Systolic and diastolic blood pressures (SBP and DBP) were measured by an electronic sphygmomanometer after seated rest for 5 minutes. Venous samples were collected following overnight fasting, to determine hemoglobin, albumin, total cholesterol, low-density lipoprotein cholesterol, high-density lipoprotein cholesterol (HDL-C), triglyceride (TG), fasting glucose, high-sensitivity C-reactive protein (hsCRP), 25-hydroxyvitamin D (25(OH) vitamin D), sodium, potassium, chloride, and Cr levels at baseline. eGFR was calculated using the Chronic Kidney Disease Epidemiology Collaboration equation [19]. CKD stages were determined by the Kidney Disease Improving Global Outcomes guidelines [8]. Urine albumin-to-Cr ratio (ACR) was measured in random, preferably second-voided, spot urine samples. Other urinary metrics, such as sodium, potassium, chloride, and Cr, were also measured in spot urine samples at baseline.

Measurement of coronary artery calcium score

Electrocardiography-gated coronary multidetector CT scans were checked following the standard protocol of each center at baseline and at year four follow-up visits. The CACS score was determined using Agatston units (AU) on a digital radiologic workstation [20].

Exposure and study outcome

The exposure of primary interest was urinary chloride-to-Cr ratio (Cl/Cr), which was used as a categorical variable. The subjects were divided into tertiles (T1, T2, and T3) by spot urine Cl/Cr. T1, T2, and T3 were defined as low, moderate, and high urinary chloride excretion, respectively. The study outcome was progression of CAC, which was defined as increase in CACS of more than 200 AU during the 4-year follow-up period, as in previously published studies from KNOW-CKD [2123].

Statistical analysis

Continuous variables were expressed as the mean ± standard deviation or median (interquartile range). Categorical variables were expressed as the number of participants and percentage. Normality of distribution was ascertained by the Kolmogorov-Smirnov test. To compare baseline characteristics by urinary Cl/Cr, one-way analysis of variance and chi-square test were used for continuous and categorical variables, respectively. Univariate correlation analysis was performed with Spearman correlation analysis to assess the relationship between urine electrolyte parameters. Participants with any missing data in the primary analysis were excluded from further analyses. Binary logistic regression models were analyzed to address independent associations between urinary chloride excretion and the risk of CAC progression. The results of binary logistic regression models are presented as odds ratios (ORs) and 95% confidence intervals (CIs). Models were constructed after adjusting for the following variables. Model 1 represents crude ORs. Model 2 was adjusted for age, sex, Charlson comorbidity index, primary renal disease, current smoking status, medication (ACEi/ARBs, diuretics, number of antihypertensive drugs, statins), BMI, and SBP. Model 3 was further adjusted for hemoglobin, albumin, fasting glucose, HDL-C, TG, 25(OH) vitamin D, hsCRP, eGFR, and spot urine ACR. Model 4 was additionally adjusted for CACS at baseline. Restricted cubic splines were used to visualize the associations between urinary chloride excretion as a continuous variable and the OR for CAC progression. To validate our findings, we performed sensitivity analyses. First, participants with CACS of 0 AU at the baseline were excluded from binary logistic regression analysis, as CAC progression in those subjects was relatively rare. Second, we excluded subjects with eGFR of <15 mL/min/1.73 m2, because there were relatively few subjects with eGFR of <15 mL/min/1.73 m2, and including them may exaggerate the association between urinary chloride excretion and study outcomes due to advanced CKD. Third, we excluded subjects with eGFR of ≥90 mL/min/1.73 m2, because those values are close to normal kidney function, and may not represent the CKD population well. Fourth, spot urine Na+/Cr and K+/Cr were included as covariates in binary logistic regression analysis. Lastly, we replaced the missing values in primary analyses by multiple imputations, and further conducted Cox regression analyses. To examine whether the association of urinary chloride excretion with the risk of CAC progression is modified by clinical contexts, we conducted prespecified subgroup analyses. Subgroups were defined by age (<60 years vs. ≥60 years), sex (male vs. female), BMI (<23 kg/m2 vs. ≥23 kg/m2), eGFR (<45 mL/min/1.73 m2 vs. ≥45 mL/min/1.73 m2), and spot urine ACR (<300 mg/gCr vs. ≥300 mg/gCr). Two-sided p-values of <0.05 were considered statistically significant. Statistical analysis was performed using IBM SPSS for Windows version 22.0 (IBM Corp.) and R version 4.1.1 (R project for Statistical Computing).

Results

Baseline characteristics

The baseline characteristics of the study participants are described by tertiles of spot urine Cl/Cr (Table 1). BMI was highest in T3 and lowest in T1. The proportion of subjects using diuretics was highest in T1 and lowest in T3. The eGFR at baseline was highest in T3, and lowest in T1. Accordingly, the proportion of subjects in advanced stages of CKD was higher in T1. The other variables, including CACS at the baseline, did not show significant differences across groups. Correlation analysis to assess the relationships between urine electrolyte parameters revealed significant correlations among urinary sodium, potassium, and chloride excretion (Supplementary Table 1, available online).

Association of spot urine Cl/Cr and risk of coronary artery calcification progression in patients with nondialysis chronic kidney disease

To determine independent associations of spot urine Cl/Cr with the risk of CAC progression, we analyzed a binary logistic regression model (Table 2). Compared to moderate urinary chloride excretion, high urinary chloride excretion was associated with decreased risk of CAC progression (adjusted OR, 0.38; 95% CI, 0.19–0.76). Low urinary chloride excretion was not associated with either increased or decreased risk of CAC progression (adjusted OR, 0.72; 95% CI, 0.39–1.34). Restricted cubic spine depicted an inverted J-shaped curve, with a significant reduction of the risk for CAC progression in subjects with high spot urine Cl/Cr (Fig. 2).

Sensitivity analyses

After excluding subjects with CACS of 0 AU at baseline, high urinary chloride excretion was still associated with decreased risk of CAC progression (adjusted OR, 0.36; 95% CI, 0.17–0.72) (Table 3). After excluding subjects at CKD stage 1, the association between high urinary chloride excretion with decreased risk of CAC progression was still significant (adjusted OR, 0.34; 95% CI, 0.16–0.74) (Supplementary Table 2, available online). After excluding subjects at CKD stage 5, the association between high urinary chloride excretion with decreased risk of CAC progression was still robust (adjusted OR, 0.37; 95% CI, 0.18–0.74) (Supplementary Table 3, available online). Even when spot urine Na+/Cr and K+/Cr were included in the regression model as covariates, the analysis demonstrated robust results (Supplementary Table 4, available online). Lastly, after replacing the missing values by multiple imputations, the association between high urinary chloride excretion with decreased risk of CAC progression remained robust (adjusted OR, 0.40; 95% CI, 0.20–0.78) (Supplementary Table 5, available online).

Subgroup analyses

Subgroup analyses revealed that the association of urinary chloride excretion with the risk of CAC progression is not modified by age, sex, BMI, eGFR, or albuminuria (Table 4).

Discussion

In the present study, we demonstrated that high urinary chloride excretion is associated with decreased risk of CAC progression in patients with nondialysis CKD. The association depicted an inverted J-shaped relation, with a significant reduction of the risk for CAC progression in subjects with high spot urine Cl/Cr. Subgroup analyses revealed that the association is not modified by age, sex, BMI, eGFR, or albuminuria.
Urinary sodium and potassium excretion are correlated with dietary sodium and potassium intake, respectively [24,25]. As high urinary sodium or low urinary potassium excretion was associated with adverse CV outcomes in patients with CKD [25,26], it is interesting that the impact of urinary chloride excretion on the risk of CAC progression was not neutralized, considering that chloride ions are coupled with both sodium and potassium ions. This suggests that urinary chloride excretion does not simply estimate dietary chloride intake, and, rather, may represent the result of renal tubular handling of chloride ions that reflects distal delivery of chloride.
We speculate that adequate urinary excretion of chloride is a result of preserved renal function, thereby contributing to the prevention of CAC progression. A possible mechanism explaining how urinary chloride excretion guarantees a renoprotective effect is tubuloglomerular feedback (TGF) [27]. TGF is an autoregulatory mechanism that controls glomerular filtration rate (GFR). Increased distal flow, and corresponding increased distal delivery of chloride ions, is sensed by macula densa cells, leading to the release of adenosine from their basolateral sides, which in turn causes the constriction of glomerular afferent arterioles [2729]. This collectively prevents unopposed increases in GFR, and assists in the maintenance of intratubular flow rate. From the perspective of pathophysiology, the activation of TGF functions as a defensive mechanism against glomerular hypertension, which has been shown to be effective in the long-term preservation of GFR [3033]. Although increased delivery of sodium ions may also initiate TGF response, animal studies demonstrated the predominant role of chloride, rather than sodium, ions as stimulation for macula densa cells to drive TGF [28,34]. It is assumed that, therefore, adequate activation of TGF response is mirrored in high urinary chloride excretion, ultimately contributing to the preservation of kidney function, and to the prevention of CAC prevention. We speculate that the predictive value of urinary chloride excretion as a biomarker of CAC progression is substantial, because despite there being no association between urinary chloride excretion and CACS at baseline, the risk of CAC progression significantly differed by baseline urinary chloride excretion in 4 years.
It is well-known that the risk of CAD is increased even in the early stages of CKD [6], while the risk is further aggravated by progression of CKD [7], which is usually determined by eGFR [8]. Although urinary chloride excretion is postulated to be a biomarker of renal tubule function, we found that it was also correlated with eGFR (Table 1), suggesting that the function of the renal tubule is closely related to that of the glomerulus. Thus, it seems reasonable that urinary chloride excretion predicts the risk of CAC progression. Nevertheless, it is still intriguing that the regression models in the current study include eGFR as a co-variable, which means that the association of urinary chloride excretion with the risk of CAC progression is independent of eGFR. It should be, therefore, further clarified whether the primary defect in renal tubular handling of chloride excretion may increase the risk of CAC progression.
Several limitations are to be acknowledged in the current study. First, we cannot determine a causal relation between urinary chloride excretion and the risk of CAC progression, because of the observational nature of the current study. Second, despite the robust findings for the association between urinary chloride excretion and the risk of CAC progression, we were not able to identify the precise mechanism underlying the association. Third, we did not examine whether urinary chloride excretion is also associated with the overall CV outcomes in patients with nondialysis CKD. Fourth, as this cohort study enrolled only ethnic Koreans, precautions are required to extrapolate the data to other populations.
In conclusion, we report that high urinary chloride excretion is associated with decreased risk of CAC progression in patients with nondialysis CKD. Further studies are warranted to unveil the precise mechanism underlying the association between urinary chloride excretion and the risk of CAC progression and to determine whether urinary chloride excretion is also associated with overall CV outcomes in patients with nondialysis CKD.

Notes

Conflicts of interest

Tae-Hyun Yoo is the Editor-in-Chief of Kidney Research and Clinical Practice and was not involved in the review process of this article. All authors have no other conflicts of interest to declare.

Funding

This work was supported by the Research Program funded by the Korea Disease Control and Prevention Agency (2011E3300300, 2012E3301100, 2013E3301600, 2013E3301601, 2013E3301602, 2016E3300200, 2016E3300201, 2016E3300202,2019E320100, 2019E320101, 2019E320102, 2022-11-007), by the National Research Foundation of Korea (NRF) funded by the Korea government (MSIT) (NRF-2019R1A2C2086276), and a grant (BCRI22042 and BCRI22079) of Chonnam National University Hospital Biomedical Research Institute.

Data sharing statement

The data presented in this study are available on request from the corresponding author.

Authors’ contributions

Conceptualization, Methodology: SHS

Data curation, Formal analysis: SHS, TRO, HSC

Investigation: CSK, EHB, SKM

Supervision: KHO, THY, DWC, SWK

Writing–original draft: SHS

Writing–review & editing: SHS, SWK

All authors read and approved the final manuscript.

Figure 1.

Flow diagram of the study participants.
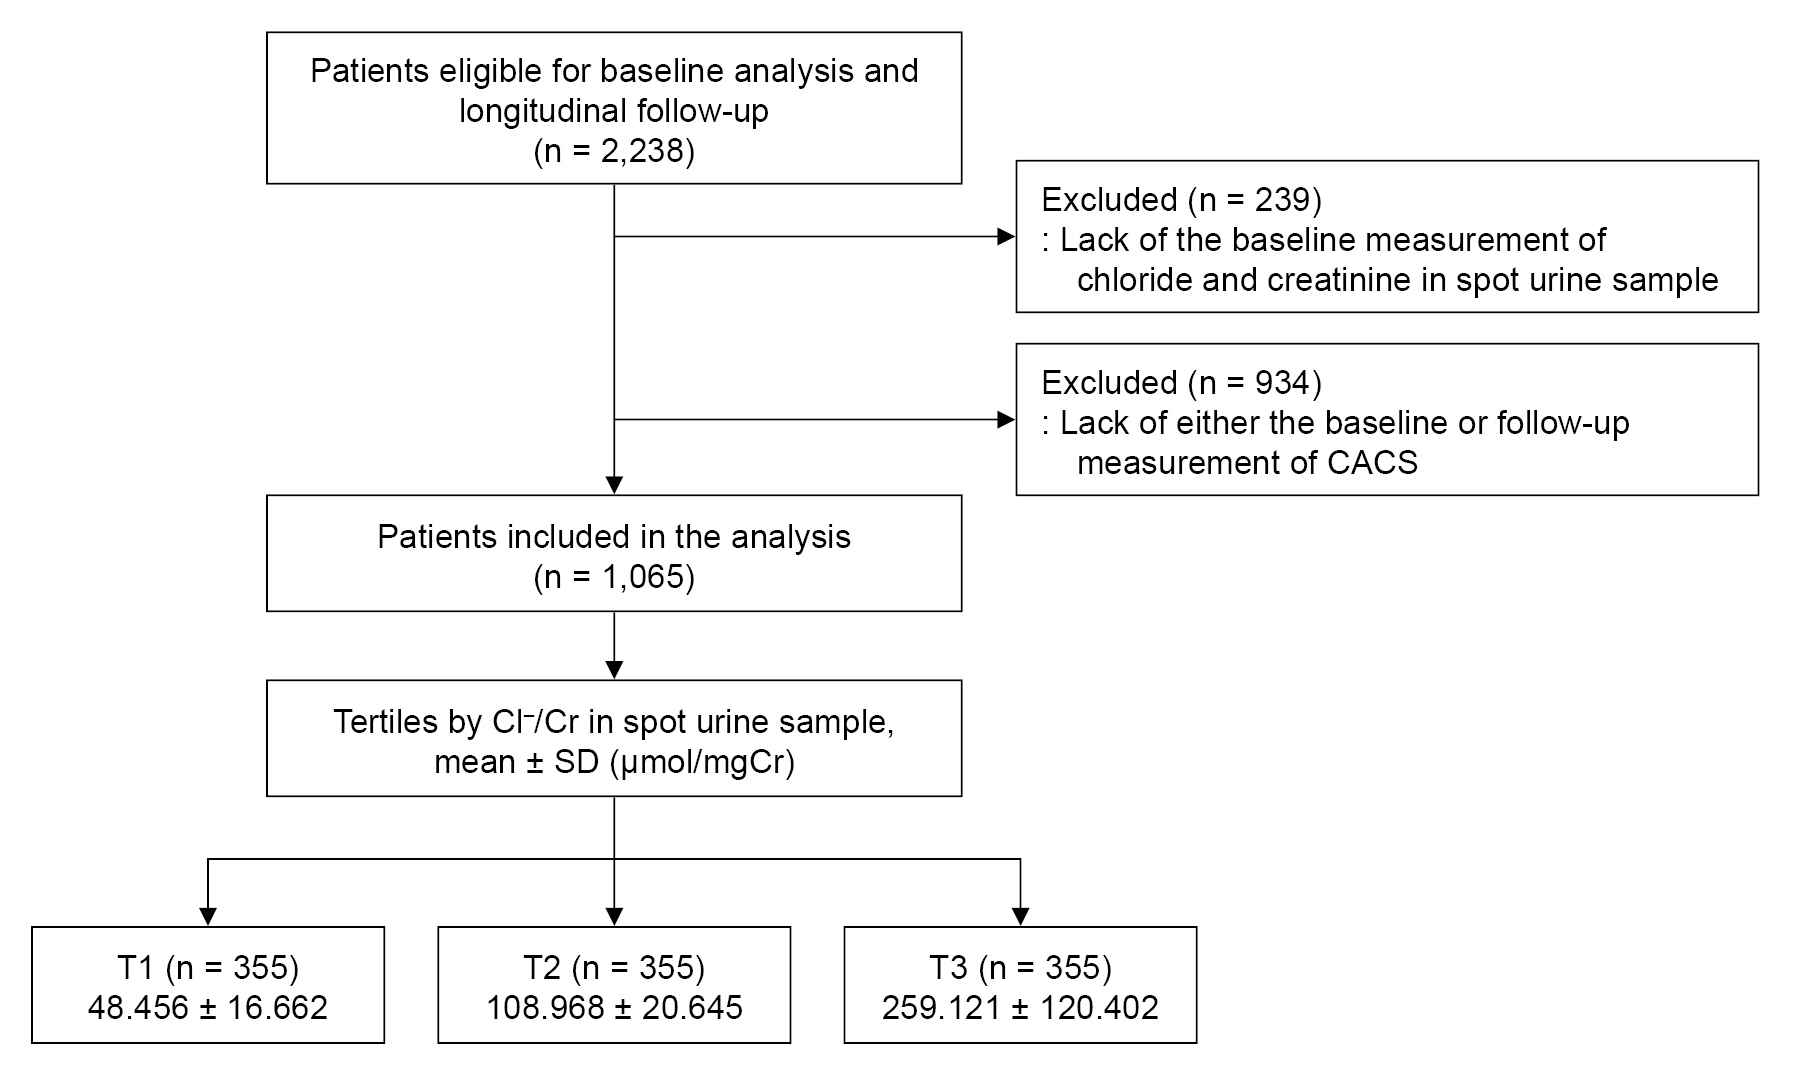
CACS, coronary artery calcium score; Cl/Cr, chloride-to-creatinine ratio; Cr, creatinine; SD, standard deviation; T1, 1st tertile; T2, 2nd tertile; T3, 3rd tertile.
j-krcp-22-072f1.jpg
Figure 2.

Restricted cubic spline of spot urine Cl–/Cr on the risk of CAC progression.
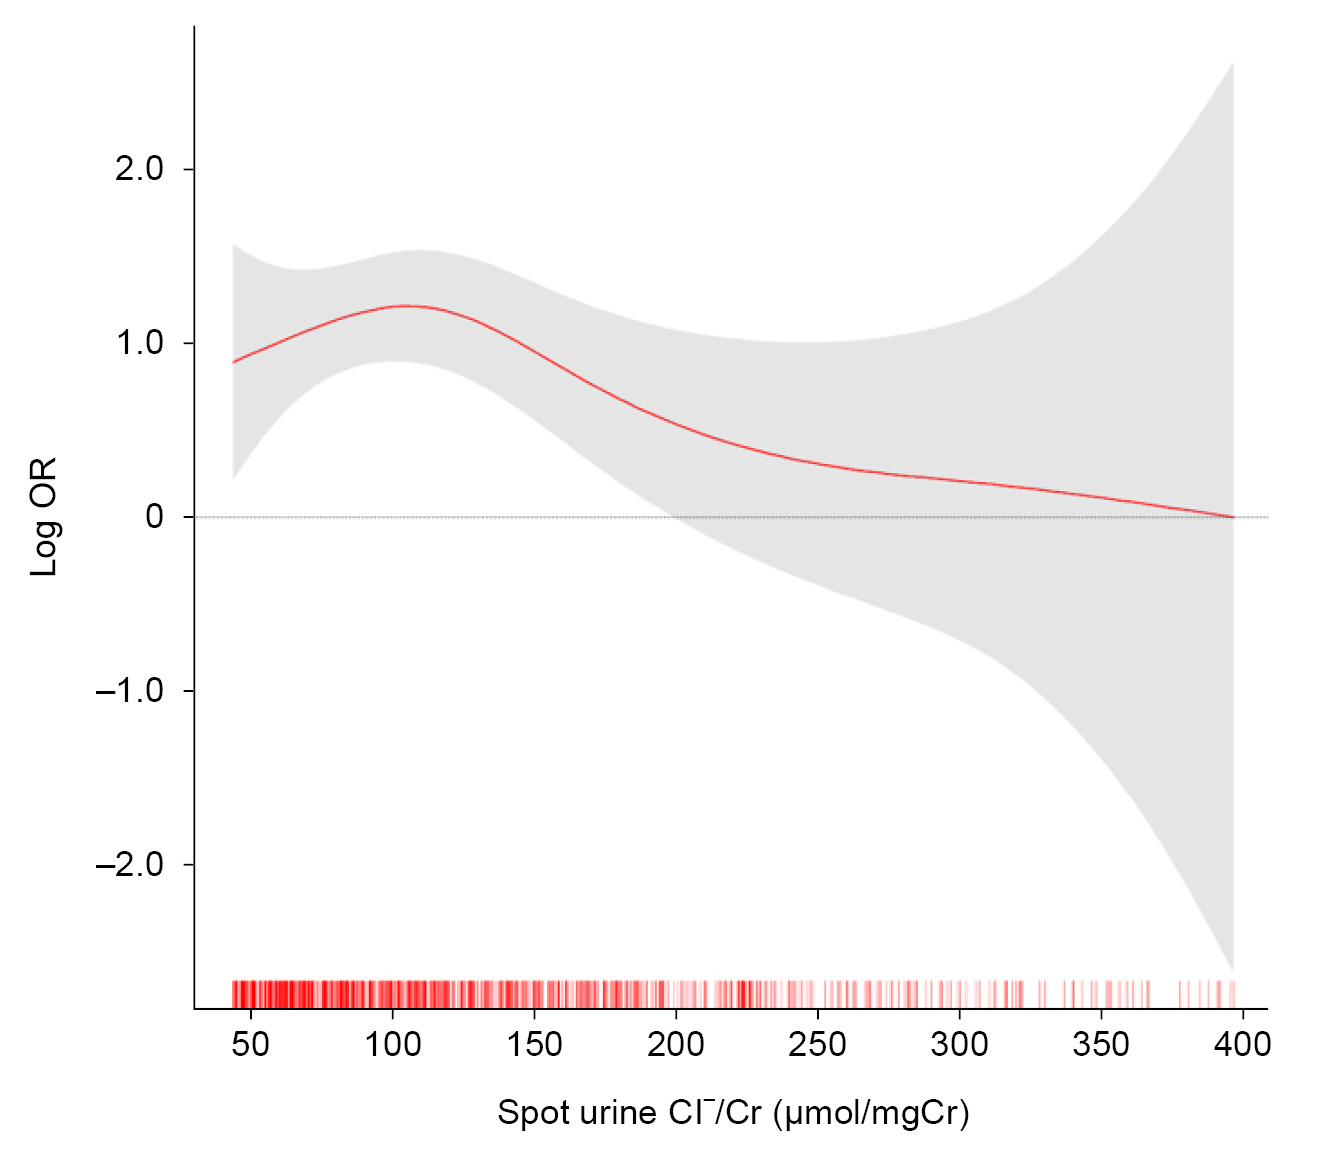
Adjusted OR of spot urine Cl/Cr as a continuous variable for the progression of CAC is depicted. The model was adjusted for age, sex, Charlson comorbidity index, primary renal disease, current smoking status, medication (ACEi/ARBs, diuretics, number of anti-HTN drugs, statins), BMI, SBP, hemoglobin, albumin, fasting glucose, HDL-C, TG, 25(OH) vitamin D, hsCRP, eGFR, spot urine ACR, and CACS at the baseline.
ACEi, angiotensin-converting enzyme inhibitor; ACR, albumin-to-creatinine ratio; ARB, angiotensin receptor blocker; BMI, body mass index; CACS, coronary artery calcium score; Cl/Cr, chloride-to-creatinine ratio; eGFR, estimated glomerular filtration rate; HDL-C, high-density lipoprotein cholesterol; hsCRP, high-sensitivity C-reactive protein; HTN, hypertension; OR, odds ratio; SBP, systolic blood pressure; T1, 1st tertile; T2, 2nd tertile; T3, 3rd tertile; TG, triglyceride.
j-krcp-22-072f2.jpg
Table 1.
Baseline characteristics of study participants in the tertiles by spot urine Cl–/Cr
Characteristic Spot urine Cl/Cr
p-value
T1 (n = 355) T2 (n = 355) T3 (n = 355)
CACS (AU) 0.34
 0 173 (48.7) 199 (56.1) 199 (56.1)
 >0, ≤400 151 (42.5) 133 (37.5) 136 (38.3)
 >400, ≤1,000 19 (5.4) 14 (3.9) 14 (3.9)
 >1,000 12 (3.4) 9 (2.5) 6 (1.7)
Age (yr) 52.572 ± 12.138 52.482 ± 11.985 52.820 ± 11.410 0.93
Male sex 214 (60.3) 212 (59.7) 200 (56.3) 0.51
Charlson comorbidity index 0.27
 0–3 285 (80.3) 289 (81.4) 304 (85.6)
 4–5 69 (19.4) 63 (17.7) 49 (13.8)
 ≥6 1 (0.3) 3 (0.8) 2 (0.6)
Primary renal disease 0.66
 Diabetes mellitus 60 (16.9) 54 (15.2) 53 (14.9)
 HTN 74 (20.8) 76 (21.4) 70 (19.7)
 Glomerulonephritis 131 (36.9) 115 (32.4) 145 (40.8)
 TID 3 (0.8) 4 (1.1) 2 (0.6)
 PKD 67 (18.9) 80 (22.5) 66 (18.6)
 Others 26 (7.3) 20 (5.6) 19 (5.4)
Body mass index (kg/m2) 24.137 ± 3.294 24.394 ± 3.085 25.075 ± 3.342 <0.001
SBP (mmHg) 125.465 ± 14.987 126.741 ± 15.104 125.600 ± 14.074 0.45
DBP (mmHg) 76.313 ± 10.903 77.220 ± 9.547 76.893 ± 10.421 0.494
Medications
 ACEi/ARBs 309 (87.0) 305 (85.9) 311 (87.6) 0.79
 Diuretics 100 (28.2) 86 (24.2) 71 (20.0) 0.04
 No. of anti-HTN drugs ≥3 264 (74.4) 269 (75.8) 283 (79.7) 0.22
 Statins 194 (56.6) 162 (45.6) 179 (50.4) 0.06
Laboratory finding
 Hemoglobin (g/dL) 13.226 ± 1.801 13.426 ± 1.852 13.488 ± 1.843 0.14
 Albumin (g/dL) 4.266 ± 0.338 4.249 ± 0.358 4.280 ± 0.325 0.47
 TC (mg/dL) 173.285 ± 36.697 175.031 ± 35.631 175.652 ± 34.640 0.66
 HDL-C (mg/dL) 50.265 ± 15.685 51.733 ± 15.599 50.475 ± 14.254 0.38
 LDL-C (mg/dL) 96.101 ± 31.223 96.547 ± 29.204 98.756 ± 28.840 0.45
 TG (mg/dL) 154.237 ± 93.455 151.877 ± 106.511 149.138 ± 82.377 0.78
 Fasting glucose (mg/dL) 105.283 ± 30.607 106.133 ± 28.387 107.756 ± 28.186 0.52
 hsCRP (mg/dL) 0.600 (0.200–1.725) 0.600 (0.200–1.400) 0.600 (0.200–1.700) 0.54
 Sodium (mmol/L) 140.932 ± 2.367 140.879 ± 2.273 141.048 ± 2.232 0.62
 Potassium (mmol/L) 4.541 ± 0.500 4.461 ± 0.493 4.487 ± 0.480 0.099
 Chloride (mmol/L) 104.783 ± 3.326 104.900 ± 3.027 105.006 ± 2.743 0.65
 Spot urine
  Na+/Cr (μmol/mgCr) 64.820 ± 46.776 98.805 ± 47.067 142.452 ± 78.717 <0.001
  K+/Cr (μmol/mgCr) 40.904 ± 18.042 47.923 ± 19.529 58.059 ± 25.678 <0.001
  ACR (mg/gCr) 264.561 224.773 (40.156–1,587.563) 226.955 0.24
(50.201–594.129) (40.256–1,273.767)
 eGFR (mL/min/1.73 m2) 54.263 ± 27.834 57.329 ± 28.410 66.943 ± 28.971 <0.001
CKD stage <0.001
 Stage 1 58 (16.3) 66 (18.6) 111 (31.3)
 Stage 2 90 (25.4) 81 (22.8) 93 (26.2)
 Stage 3a 58 (16.3) 83 (23.4) 64 (18.0)
 Stage 3b 89 (25.1) 88 (24.8) 64 (18.0)
 Stage 4 54 (15.2) 36 (10.1) 23 (6.5)
 Stage 5 6 (1.7) 1 (0.3) 0 (0.0)

Data are expressed as number (%), mean ± standard deviation, or median (interquartile range).

ACEi, angiotensin-converting enzyme inhibitor; ACR, albumin-to-creatinine ratio; ARB, angiotensin receptor blocker; AU, Agatston unit; CACS, coronary artery calcium score; CKD, chronic kidney disease; Cl/Cr, chloride-to-creatinine ratio; DBP, diastolic blood pressure; eGFR, estimated glomerular filtration rate; HDL-C, high-density lipoprotein cholesterol; hsCRP, high-sensitivity C-reactive protein; HTN, hypertension; K+/Cr, potassium-to-creatinine ratio; LDC-C, low-density lipoprotein cholesterol; Na+/Cr, sodium-to-creatinine ratio; PKD, polycystic kidney disease; SBP, systolic blood pressure; T1, 1st tertile; T2, 2nd tertile; T3, 3rd tertile; TC, total cholesterol; TG, triglyceride; TID, tubulointerstitial disease.

Table 2.
Binary logistic regression of spot urine Cl–/Cr for the risk of CAC progression
Spot urine Cl/Cr Event, n (%) Model 1
Model 2
Model 3
Model 4
OR (95% CI) p-value OR (95% CI) p-value OR (95% CI) p-value OR (95% CI) p-value
T1 46 (13.0) 0.98 (0.63–1.51) 0.91 0.97 (0.57–1.62) 0.89 0.88 (0.50–1.53) 0.65 0.72 (0.39–1.34) 0.30
T2 47 (13.2) Reference Reference Reference Reference
T3 25 (7.0) 0.50 (0.30–0.83) 0.007 0.45 (0.25–0.81) 0.008 0.43 (0.23–0.81) 0.008 0.38 (0.19–0.76) 0.006

Model 1: unadjusted model. Model 2: model 1 + adjusted for age, sex, Charlson comorbidity index, primary renal disease, current smoking status, medication (ACEi/ARBs, diuretics, number of anti-HTN drugs, statins), BMI, and SBP. Model 3: model 2 + adjusted for hemoglobin, albumin, fasting glucose, HDL-C, TG, 25(OH) vitamin D, hsCRP, eGFR, and spot urine ACR. Model 4: model 3 + adjusted for CACS at the baseline.

ACEi, angiotensin-converting enzyme inhibitor; ACR, albumin-to-creatinine ratio; ARB, angiotensin receptor blocker; BMI, body mass index; CAC, coronary artery calcification; CACS, coronary artery calcium score; CI, confidence interval; Cl/Cr, chloride-to-creatinine ratio; eGFR, estimated glomerular filtration rate; HDL-C, high-density lipoprotein cholesterol; hsCRP, high-sensitivity C-reactive protein; HTN, hypertension; OR, odds ratio; SBP, systolic blood pressure; T1, 1st tertile; T2, 2nd tertile; T3, 3rd tertile; TG, triglyceride.

Table 3.
Binary logistic regression of spot urine Cl–/Cr for the risk of CAC progression in the subjects with baseline CACS of >>0 AU
Spot urine Cl/Cr Event, n (%) Model 1
Model 2
Model 3
Model 4
OR (95% CI) p-value OR (95% CI) p-value OR (95% CI) p-value OR (95% CI) p-value
T1 46 (25.3) 0.81 (0.50–1.31) 0.39 0.79 (0.46–1.38) 0.41 0.73 (0.40–1.31) 0.29 0.64 (0.34–1.22) 0.18
T2 46 (29.5) Reference Reference Reference Reference
T3 25 (16.0) 1.04 (1.02–1.07) <0.001 0.40 (0.22–0.76) 0.005 0.39 (0.20–0.74) 0.004 0.36 (0.17–0.72) 0.004

Model 1: unadjusted model. Model 2: model 1 + adjusted for age, sex, Charlson comorbidity index, primary renal disease, current smoking status, medication (ACEi/ARBs, diuretics, number of anti-HTN drugs, statins), BMI, and SBP. Model 3: model 2 + adjusted for hemoglobin, albumin, fasting glucose, HDL-C, TG, 25(OH) vitamin D, hsCRP, eGFR, and spot urine ACR. Model 4: model 3 + adjusted for CACS at the baseline.

ACEi, angiotensin-converting enzyme inhibitor; ACR, albumin-to-creatinine ratio; ARB, angiotensin receptor blocker; BMI, body mass index; CAC, coronary artery calcification; CACS, coronary artery calcium score; CI, confidence interval; Cl/Cr, chloride-to-creatinine ratio; eGFR, estimated glomerular filtration rate; HDL-C, high-density lipoprotein cholesterol; hsCRP, high-sensitivity C-reactive protein; HTN, hypertension; OR, odds ratio; SBP, systolic blood pressure; T1, 1st tertile; T2, 2nd tertile; T3, 3rd tertile; TG, triglyceride.

Table 4.
Binary logistic regression of random urine Cl–/Cr for the risk of CAC progression in various subgroups
Variable Spot urine Cl/Cr Unadjusted
Adjusted
OR (95% CI) p for interaction OR (95% CI) p for interaction
Age (yr)
 <60 T1 0.62 (0.31–1.20) 0.09 0.31 (0.08–1.08) 0.55
T2 Reference Reference
T3 0.28 (0.11–0.63) 0.14 (0.02–0.70)
 ≥60 yr T1 1.50 (0.81–2.79) 0.80 (0.33–1.90)
T2 Reference Reference
T3 0.74 (0.37–1.46) 0.42 (0.16–1.06)
Sex
 Male T1 0.89 (0.53–1.49) 0.58 0.61 (0.29–1.25) 0.58
T2 Reference Reference
T3 0.54 (0.30–0.97) 0.38 (0.16–0.84)
 Female T1 1.22 (0.53–2.87) 2.03 (0.19–29.48)
T2 Reference Reference
T3 0.40 (0.12–1.13) 0.01 (0.00–0.27)
BMI (kg/m2)
 <23 T1 1.17 (0.48–2.93) 0.93 0.62 (0.10–4.04) 0.92
T2 Reference Reference
T3 0.51 (0.14–1.64) 0.23 (0.01–2.68)
 ≥23 T1 0.96 (0.57–1.58) 0.65 (0.30–1.37)
T2 Reference Reference
T3 0.47 (0.26–0.81) 0.37 (0.16–0.79)
eGFR (mL/min/1.73 m2)
 ≥45 T1 0.53 (0.26–1.02) 0.07 0.49 (0.18–1.22) 0.53
T2 Reference Reference
T3 0.42 (0.21–0.79) 0.28 (0.11–0.70)
 <45 T1 1.54 (0.84–2.91) 1.41 (0.54–3.78)
T2 Reference Reference
T3 0.71 (0.30–1.57) 0.38 (0.10–1.29)
Spot urine ACR (mg/g)
 <300 T1 0.92 (0.47–1.80) 0.86 0.45 (0.15–1.28) 0.63
T2 Reference Reference
T3 0.56 (0.26–1.16) 0.34 (0.11–1.00)
 ≥300 T1 0.99 (0.56–1.79) 0.90 (0.37–2.21)
T2 Reference Reference
T3 0.45 (0.22–0.90) 0.28 (0.08–0.88)

The model was adjusted for age, sex, Charlson comorbidity index, primary renal disease, current smoking status, medication (ACEi/ARBs, diuretics, number of anti-HTN drugs, statins), BMI, SBP, hemoglobin, albumin, fasting glucose, HDL-C, TG, 25(OH) vitamin D, hsCRP, eGFR, spot urine ACR, and CACS at the baseline.

ACEi, angiotensin-converting enzyme inhibitor; ACR, albumin-to-creatinine ratio; ARB, angiotensin receptor blocker; BMI, body mass index; CAC, coronary artery calcification; CACS, coronary artery calcium score; CI, confidence interval; Cl/Cr, chloride-to-creatinine ratio; eGFR, estimated glomerular filtration rate; HDL-C, high-density lipoprotein cholesterol; hsCRP, high-sensitivity C-reactive protein; HTN, hypertension; OR, odds ratio; SBP, systolic blood pressure; T1, 1st tertile; T2, 2nd tertile; T3, 3rd tertile; TG, triglyceride.

References

1. Xie Y, Bowe B, Mokdad AH, et al. Analysis of the Global Burden of Disease study highlights the global, regional, and national trends of chronic kidney disease epidemiology from 1990 to 2016. Kidney Int 2018;94:567–581.
crossref pmid
2. Jin DC, Yun SR, Lee SW, et al. Current characteristics of dialysis therapy in Korea: 2016 registry data focusing on diabetic patients. Kidney Res Clin Pract 2018;37:20–29.
crossref pmid pmc
3. Choi HS, Han KD, Oh TR, et al. Trends in the incidence and prevalence of end-stage renal disease with hemodialysis in entire Korean population: a nationwide population-based study. Medicine (Baltimore) 2021;100:e25293.
pmid pmc
4. Cai Q, Mukku VK, Ahmad M. Coronary artery disease in patients with chronic kidney disease: a clinical update. Curr Cardiol Rev 2013;9:331–339.
crossref pmid pmc
5. Jankowski J, Floege J, Fliser D, Böhm M, Marx N. Cardiovascular disease in chronic kidney disease: pathophysiological insights and therapeutic options. Circulation 2021;143:1157–1172.
crossref pmid pmc
6. Foley RN, Parfrey PS, Sarnak MJ. Clinical epidemiology of cardiovascular disease in chronic renal disease. Am J Kidney Dis 1998;32:S112–S119.
crossref pmid
7. Engelbertz C, Reinecke H, Breithardt G, et al. Two-year outcome and risk factors for mortality in patients with coronary artery disease and renal failure: the prospective, observational CAD-REF Registry. Int J Cardiol 2017;243:65–72.
crossref pmid
8. Levey AS, Eckardt KU, Tsukamoto Y, et al. Definition and classification of chronic kidney disease: a position statement from Kidney Disease: Improving Global Outcomes (KDIGO). Kidney Int 2005;67:2089–2100.
crossref pmid
9. Jentsch TJ, Pusch M. CLC chloride channels and transporters: structure, function, physiology, and disease. Physiol Rev 2018;98:1493–1590.
crossref pmid
10. Piechotta K, Lu J, Delpire E. Cation chloride cotransporters interact with the stress-related kinases Ste20-related proline-alanine-rich kinase (SPAK) and oxidative stress response 1 (OSR1). J Biol Chem 2002;277:50812–50819.
crossref pmid
11. Palmer BF, Alpern RJ. Metabolic alkalosis. J Am Soc Nephrol 1997;8:1462–1469.
crossref pmid
12. Batlle DC, Hizon M, Cohen E, Gutterman C, Gupta R. The use of the urinary anion gap in the diagnosis of hyperchloremic metabolic acidosis. N Engl J Med 1988;318:594–599.
crossref pmid
13. Joo YS, Kim J, Park CH, et al. Urinary chloride concentration and progression of chronic kidney disease: results from the KoreaN cohort study for Outcomes in patients With Chronic Kidney Disease. Nephrol Dial Transplant 2021;36:673–680.
crossref pmid pdf
14. Arad Y, Spadaro LA, Goodman K, Newstein D, Guerci AD. Prediction of coronary events with electron beam computed tomography. J Am Coll Cardiol 2000;36:1253–1260.
crossref pmid
15. Greenland P, LaBree L, Azen SP, Doherty TM, Detrano RC. Coronary artery calcium score combined with Framingham score for risk prediction in asymptomatic individuals. JAMA 2004;291:210–215.
crossref pmid
16. Elkeles RS, Godsland IF, Feher MD, et al. Coronary calcium measurement improves prediction of cardiovascular events in asymptomatic patients with type 2 diabetes: the PREDICT study. Eur Heart J 2008;29:2244–2251.
crossref pmid
17. Becker A, Leber A, Becker C, Knez A. Predictive value of coronary calcifications for future cardiac events in asymptomatic individuals. Am Heart J 2008;155:154–160.
crossref pmid
18. Oh KH, Park SK, Park HC, et al. KNOW-CKD (KoreaN cohort study for Outcome in patients With Chronic Kidney Disease): design and methods. BMC Nephrol 2014;15:80.
crossref pmid pmc pdf
19. Levey AS, Stevens LA, Schmid CH, et al. A new equation to estimate glomerular filtration rate. Ann Intern Med 2009;150:604–612.
crossref pmid pmc
20. Agatston AS, Janowitz WR, Hildner FJ, Zusmer NR, Viamonte M Jr, Detrano R. Quantification of coronary artery calcium using ultrafast computed tomography. J Am Coll Cardiol 1990;15:827–832.
crossref pmid
21. Jung CY, Heo GY, Park JT, et al. Sex disparities and adverse cardiovascular and kidney outcomes in patients with chronic kidney disease: results from the KNOW-CKD. Clin Res Cardiol 2021;110:1116–1127.
crossref pmid pdf
22. Suh SH, Oh TR, Choi HS, et al. Association of body weight variability with progression of coronary artery calcification in patients with predialysis chronic kidney disease. Front Cardiovasc Med 2022;8:794957.
crossref pmid pmc
23. Suh SH, Oh TR, Choi HS, et al. Association of high serum adiponectin level with adverse cardiovascular outcomes and progression of coronary artery calcification in patients with pre-dialysis chronic kidney disease. Front Cardiovasc Med 2022;8:789488.
crossref pmid pmc
24. Suh SH, Song SH, Choi HS, et al. Parental educational status independently predicts the risk of prevalent hypertension in young adults. Sci Rep 2021;11:3698.
crossref pmid pmc pdf
25. Suh SH, Song SH, Oh TR, et al. Association of urinary potassium excretion with blood pressure variability and cardiovascular outcomes in patients with pre-dialysis chronic kidney disease. Nutrients 2021;13:4443.
crossref pmid pmc
26. Mills KT, Chen J, Yang W, et al. Sodium excretion and the risk of cardiovascular disease in patients with chronic kidney disease. JAMA 2016;315:2200–2210.
crossref pmid pmc
27. Schnermann J, Briggs J. Concentration-dependent sodium chloride transport as the signal in feedback control of glomerular filtration rate. Kidney Int Suppl 1982;12:S82–S89.
pmid
28. Schnermann J, Ploth DW, Hermle M. Activation of tubulo-glomerular feedback by chloride transport. Pflugers Arch 1976;362:229–240.
crossref pmid pdf
29. Bell PD, Komlosi P, Zhang ZR. ATP as a mediator of macula densa cell signalling. Purinergic Signal 2009;5:461–471.
crossref pmid pmc pdf
30. Bell PD, Lapointe JY, Peti-Peterdi J. Macula densa cell signaling. Annu Rev Physiol 2003;65:481–500.
crossref pmid
31. Schnermann J. Concurrent activation of multiple vasoactive signaling pathways in vasoconstriction caused by tubuloglomerular feedback: a quantitative assessment. Annu Rev Physiol 2015;77:301–322.
crossref pmid
32. Navar LG. Intrarenal renin-angiotensin system in regulation of glomerular function. Curr Opin Nephrol Hypertens 2014;23:38–45.
crossref pmid pmc
33. Ditzel J, Lervang HH, Brøchner-Mortensen J. Renal sodium metabolism in relation to hypertension in diabetes. Diabete Metab 1989;15:292–295.
pmid
34. Lorenz JN, Weihprecht H, Schnermann J, Skøtt O, Briggs JP. Renin release from isolated juxtaglomerular apparatus depends on macula densa chloride transport. Am J Physiol 1991;260:F486–F493.
crossref pmid
TOOLS
METRICS Graph View
  • 2 Web of Science
  • 1 Crossref
  • 1 Scopus
  • 3,143 View
  • 118 Download
ORCID iDs

Sang Heon Suh
https://orcid.org/0000-0003-3076-3466

Tae Ryom Oh
https://orcid.org/0000-0002-3713-0939

Hong Sang Choi
https://orcid.org/0000-0001-8191-4071

Chang Seong Kim
https://orcid.org/0000-0001-8753-7641

Eun Hui Bae
https://orcid.org/0000-0003-1727-2822

Seong Kwon Ma
https://orcid.org/0000-0002-5758-8189

Kook-Hwan Oh
https://orcid.org/0000-0001-9525-2179

Tae-Hyun Yoo
https://orcid.org/0000-0002-9183-4507

Dong-Wan Chae
https://orcid.org/0000-0001-9401-892X

Soo Wan Kim
https://orcid.org/0000-0002-3540-9004

Related articles

Triglyceride-glucose index is an independent predictor of coronary artery calcification progression in patients with chronic kidney disease2024 May;43(3)

Longitudinal progression trajectory of estimated glomerular filtration rate in children with chronic kidney disease: results from the KNOW-Ped CKD (KoreaN cohort study for Outcomes in patients With Pediatric Chronic Kidney Disease)

Correction to “Association between urinary chloride excretion and progression of coronary artery calcification in patients with non-dialysis chronic kidney disease: results from KNOW-CKD study” 2023 July;42(4)

Association between serum osteoprotegerin level and renal prognosis in nondialysis patients with chronic kidney disease in the Korean Cohort Study for Outcomes in Patients with Chronic Kidney Disease (the KNOW-CKD Study)2022 March;41(2)

Association between copeptin levels and treatment responses to hypertonic saline infusion in patients with symptomatic hyponatremia: a prospective cohort study2021 September;40(3)


ABOUT
BROWSE ARTICLES
EDITORIAL POLICY
FOR CONTRIBUTORS
Editorial Office
#301, (Miseung Bldg.) 23, Apgujenog-ro 30-gil, Gangnam-gu, Seoul 06022, Korea
Tel: +82-2-3486-8736    Fax: +82-2-3486-8737    E-mail: registry@ksn.or.kr                

Copyright © 2024 by The Korean Society of Nephrology.

Developed in M2PI

Close layer