


Introduction
Patients undergoing hemodialysis who experience intradialytic hypotension (IDH) reportedly have higher risk of all-cause mortality, myocardial infarction, and hospitalization [1,2]. A recent meta-analysis found that approximately 5% to 12% of patients undergoing hemodialysis experience IDH [3]. High ultrafiltration, decreased cardiac compensation, and autonomic dysfunction are possible pathophysiological mechanisms of IDH [4]. IDH occurs when the plasma volume removed during hemodialysis exceeds the refilling rate, which is determined largely by the interstitial volume. Due to the characteristics of patients undergoing hemodialysis, particularly with respect to age, nutritional status, and inflammation status [5], these patients tend to have less muscle mass and can show variable transcellular shifts. Therefore, each individual must decide the appropriate dry body weight to prevent IDH. Previous studies have suggested a relationship between body composition and IDH [6]; however, evidence is needed in terms of sarcopenia.
As people age, body composition changes as muscle mass decreases and adipose tissue increases. Sarcopenia begins with loss of muscle function, such as muscle strength, muscle power, or physical performance, which correlates well with prognosis [7,8]. The European Working Group on Sarcopenia in Older People recently defined sarcopenia as a combination of decreased muscle mass, low muscle strength, and poor physical performance. Sarcopenia correlates with obesity due to shared pathophysiological mechanisms, such as metabolic adaptations, stimulation of fat infiltration into muscle, and hormonal changes [9].
Among the various ways to measure skeletal muscle mass, bioelectrical impedance analysis (BIA) has several strengths: it can measure several components of body composition, it is administered at the bedside, and it does not involve a radiocontrast technique [10,11]. Previous studies have shown that BIA can be used clinically to determine the required amount of ultrafiltration during hemodialysis to reach dry body weight, which leads to superior outcomes [12,13]. The aim of this study was to investigate the importance of skeletal muscle mass in IDH.
Methods
Ethical approval
The study protocol was approved by the Institutional Review Boards of Ajou University Hospital (No. AJIRB-MED-SUR-16-128) and Seoul National University Bundang Hospital (No. B-2006/619-305). Written informed consent was obtained from all participants or a legal guardian, when applicable.
Study design
Body composition was measured by BIA immediately after hemodialysis on the day of regular blood examination in the month of enrollment. Skeletal muscle mass, intracellular and extracellular water contents, total body water, and cellular-membrane functionality (phase angle at 50 kHz) were measured. We then collected details regarding IDH events for the next 3 months.
Setting and participants
Patients who started maintenance hemodialysis at least 3 months before study onset were enrolled at three dialysis centers in 2016 and one center in 2020. In 2016, one center was a tertiary hospital, and the other two were local dialysis clinics, whereas in 2020, the dialysis center belonged to another tertiary hospital in South Korea.
Adults undergoing maintenance hemodialysis for more than 3 months who agreed to participate in this study and could understand and answer questionnaires were enrolled. To avoid potential risks associated with BIA measurement techniques, pregnant women, patients who had implanted electronic medical devices such as pacemakers or cardioverters, those with liver cirrhosis, and anyone receiving chemotherapy for solid cancer was excluded.
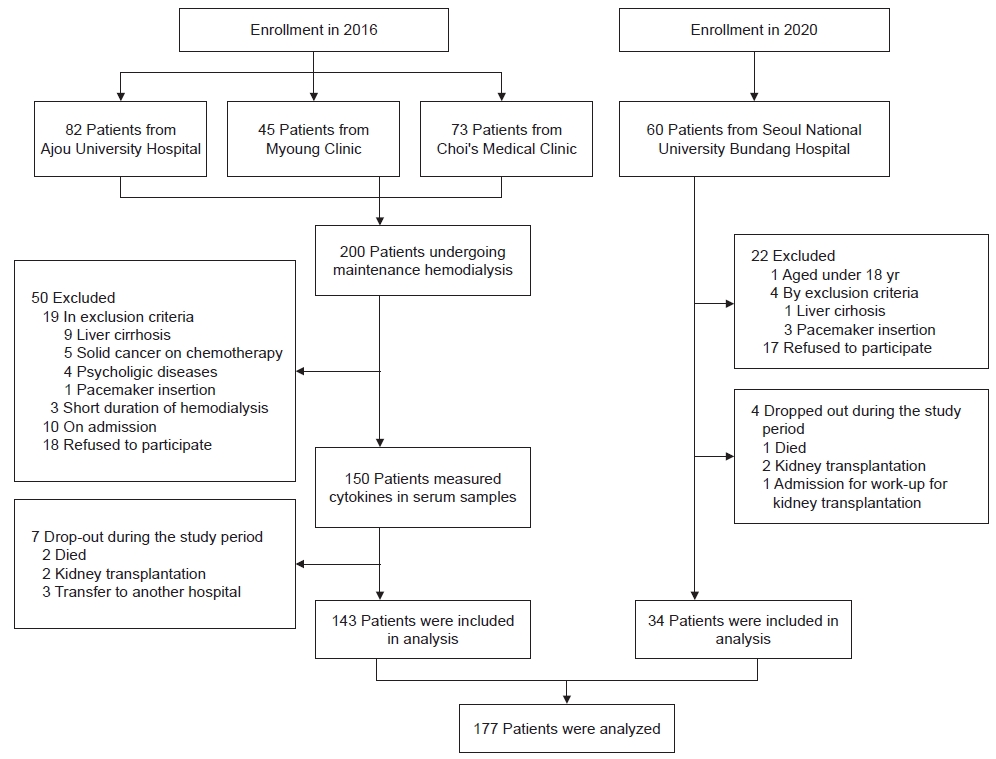
Among the 260 patients undergoing maintenance hemodialysis, 72 were excluded due to refusal to sign an agreement, the inclusion/exclusion criteria, hospitalization during enrollment, or short duration of hemodialysis (≤3 months). Eleven patients dropped out after enrollment (Fig. 1). A total of 177 patients, including 143 patients in 2016 and 34 patients in 2020, was analyzed. They were ranked by ratio of skeletal muscle mass (measured by BIA) to dry body weight (SMM/WT) and divided into three groups (low-, middle-, and high-SMM/WT). Dry body weight was calculated by subtracting the amount of ultrafiltration from the pre-hemodialysis body weight.
Variables
The primary outcome was recurrent IDH, defined as more than two episodes of hypotension (systolic blood pressure [SBP] of <90 mmHg) requiring interventions such as reducing the amount of ultrafiltration; administration of mannitol, albumin, or saline loading; and discontinuation of the dialysis session [14]. Outcomes were verified against electronic medical records after each dialysis session. The data showed similar distributions for each parameter, and all parameters for participants were analyzed.
Measurements
Measurements were performed at baseline and at 3 months. At baseline, data on clinical characteristics, physical examinations including handgrip assessment, mid-arm maximal circumference, triceps skinfold thickness, medication data, Tilburg frailty questionnaires, Patient-Generated Subjective Global Assessment (PG-SGA) nutritional questionnaires, N-terminal prohormone of brain natriuretic peptide (NT-proBNP) tests, chest radiographs, and BIA were collected. Medications for hypertension were transformed to an equivalent dose. At 3 months, medication data and any history of adverse events were recorded. The cardiac index was calculated as mediastinal width divided by chest width on chest radiography. A Jamar hand dynamometer (JAMAR@Hand Dynamometer; Patterson Medical, Ltd., Sutton-in-Ashfield, UK) was used by one researcher to assess patient grip strength in the absence of an arteriovenous fistula. Measurements were performed according to a unified protocol with the patient in a seated position, with shoulders adducted and neutrally rotated, and the wrist angle between 0° and 30°. A multifrequency bioelectrical impedance spectroscopy analyzer (Inbody S-10; Inbody, Seoul, Korea) was used to measure the reactance or impedance at five frequencies between 5 and 1,000 kHz. All BIA measurements were performed immediately after hemodialysis on the midweek day. Each BIA measurement used four electrodes, one on each limb. The duration of the measurements was approximately 1 to 2 minutes. During BIA assessment, patients were in a seated or supine position and remained still. Raw impedance data and calculated data on body composition of extracellular and intracellular water contents, total body water, and skeletal muscle mass were obtained. Using criteria set by the Asian Working Group [7], sarcopenia was defined as both low handgrip strength (HGS) and low skeletal muscle mass. Low skeletal muscle mass was defined as a ratio of appendicular skeletal muscle mass (measured by BIA) to squared height of ≤7.0 kg/m2 in males and ≤5.7 kg/m2 in females. The criterion for low HGS was ≤28 kg•f in males and ≤18 kg•f in females. Only patients with low HGS were classified as having possible sarcopenia [7].
Statistical methods
Baseline characteristics are expressed as mean ± standard deviation for continuous data and number (percentage) for categorical variables. To compare the characteristics of the two groups according to development of IDH, Student t-test was used for continuous variables, and the chi-square test was used for categorical variables. Analysis of variance was used to compare continuous variables among tertiles of SMM/WT. To account for the impact of potential confounders on IDH, we considered both adjustment and weighting methods. The adjustment method involved a multivariable logistic regression model with potential confounders of age, sex, diabetes mellitus, cardiovascular diseases including chronic heart failure and ischemic heart disease, cardiac index, and the percentage of the amount of ultrafiltration (kg) to body weight (kg) per session. We used inverse probability of treatment weighting (IPTW) to balance confounders among the three SMM/WT groups. The IPTW analysis required a propensity score estimate, which was achieved by gradient-boosted logistic regression. In addition, we conducted a logistic regression analysis with comprehensive BIA parameters, including SMM/WT as a continuous variable, to enhance predictability. Receiver operating characteristic (ROC) curves indicated the predictive accuracy of the BIA parameters.
We assessed the odds of IDH at different SMM/WT and HGS values as both continuous and categorical variables indicative of sarcopenia. The multivariable logistic regression model for IDH was depicted as a cubic spline curve, with each curve having four equally distributed nodes at the 5th, 35th, 65th, and 95th percentiles for SMM/WT. To group patients using the newly defined cutoff values of SMM/WT and HGS, the values were defined as the points at which the odds of IDH began to increase. Patients grouped according to SMM/WT and HGS were included as new variables in the multivariable logistic regression model to assess the odds of IDH. Statistical analyses were performed using Stata software (version 16; StataCorp LP, College Station, TX, USA) and R language (version 3.6.3, R Foundation, Vienna, Austria). The mnps function in the twang package with an interaction depth of 2 and 20,000 trees in R version 3.6.3 was used to estimate the propensity score.
Results
Baseline characteristics
Among the 177 patients, 39 experienced IDH (Table 1). The mean age of the enrolled patients was 59.5 ± 14.5 years. Half of all the study participants were females. The mean duration of hemodialysis before study enrollment was 5.5 ± 4.3 years. Patients experiencing IDH were more likely to be female, had a higher body mass index, and experienced shorter hemodialysis periods compared with those without IDH. Of all patients, 45.8% were diagnosed with diabetes mellitus, 19.8% had ischemic heart disease, 8.5% had chronic heart failure, 10.7% had stroke, and 5.6% had peripheral arterial occlusive disease. The percentage of comorbidities of ischemic heart disease, chronic heart failure, stroke, or peripheral arterial occlusive disease was higher in the patients experiencing IDH than in those without IDH. The proportion of patients with diabetes mellitus was higher in IDH patients. The distribution of etiologies to end-stage renal disease (ESRD) in the two groups was different, but diabetes mellitus was the most common cause of ESRD in both groups. The SMM/WT ratio was 38.9% ± 5.8% in total, 40.2% ± 5.3% in the patients without IDH, and 34.3% ± 4.9% in the patients experiencing IDH. One patient refused to undergo HGS measurement. The mean value of HGS was lower in patients who developed IDH than in patients who did not. Of all patients, 113 (63.8%) were classified as having possible sarcopenia based on HGS. The ratio of possible sarcopenia (84.6%) was statistically higher in patients with IDH compared to those without IDH (58.0%). Combining these results with the ratio of skeletal muscle mass to squared height, four participants (2.3%) were classified as having sarcopenia. In patients experiencing IDH, triceps skin thickness and mid-arm maximal circumference were higher than in patients without IDH, but the difference was not statistically significant. The mean score of the PG-SGA was lower and the Tilburg frailty index was higher in patients experiencing IDH, but the difference was not statistically different. The mean cardiac index or NT-proBNP level did not differ between the two groups.
Main results
Comparison of the odds of intradialytic hypotension among the three skeletal muscle mass to dry body weight groups
Among the 177 patients, 59 were included in each tertile of SMM/WT. The characteristics of patients in the tertile SMM/WT groups are described in Supplementary Table 1 (available online). The mean values for SMM/WT in the low-, middle-, and high-SMM/WT groups were 32.6% ± 3.0%, 38.8% ± 1.8%, and 45.3% ± 2.6%, respectively. A total of 24 patients (40.7%) in the low, 12 (20.3%) in the middle, and 3 (5.1%) in the high-SMM/WT group experienced IDH. The incidence of IDH was higher in the low-SMM/WT group than in the middle- and high-SMM/WT groups.
The clinical variables used to predict IDH were age, sex, cardiovascular disease such as chronic heart failure or ischemic heart disease, diabetes mellitus, cardiac index, and the amount of ultrafiltration per body weight before hemodialysis. Each variable was independent of the others. In the univariable logistic model, lower SMM/WT was associated with significantly higher odds of IDH (p < 0.001) (Table 2). When comparing the odds ratio of IDH among the three SMM/WT groups, that in the middle-SMM/WT group was 0.37 (p = 0.02) and that in the high-SMM/WT group was 0.08 (p < 0.001) compared with the low-SMM/WT group. We assessed the balance of the seven clinical and BIA variables used to generate IPTW. After IPTW, the odds ratio of IDH was 0.83 (p = 0.06) in the middle-SMM/WT group and 0.71 (p < 0.001) in the high-SMM/WT group compared with the low-SMM/WT group. The odds ratios of variables in the logistic regression model are described in Supplementary Table 2 (available online). The odds ratio of diabetes mellitus to the risk of IDH was 5.00 (p = 0.001), and that of the ultrafiltration amount by weight was 1.70 (p = 0.002).
Low skeletal muscle mass to dry body weight and low handgrip strength indicate higher odds of intradialytic hypotension
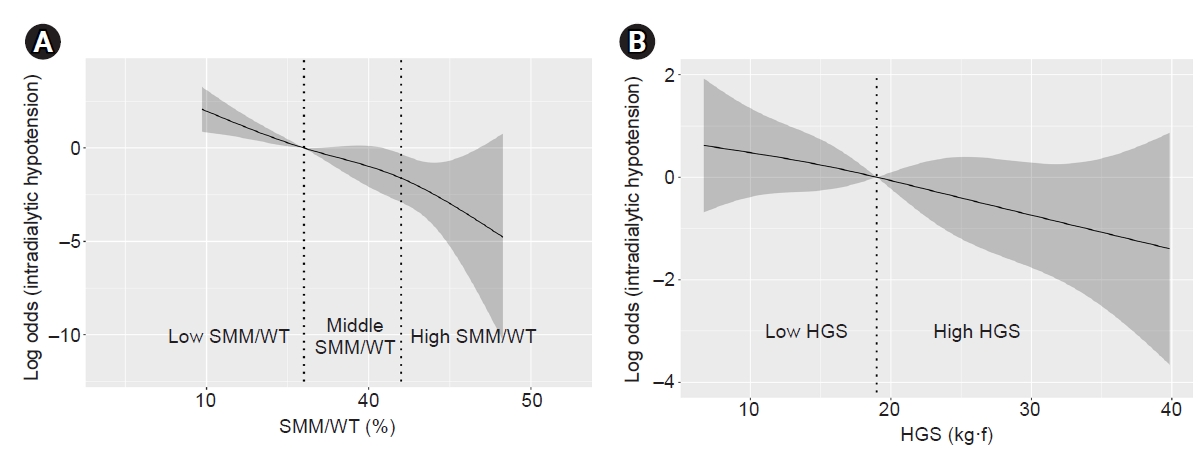
In Fig. 2A, in which the odds ratios of IDH according to SMM/WT are depicted by a restricted cubic spline curve, the log odds of IDH increased linearly as SMM/WT decreased, indicating an increased probability of IDH event according to the decrease in SMM/WT. Cubic spline curves are used to depict the relationship between HGS and the log odds of IDH in Fig. 2B. The odds of IDH in females increased when HGS was less than 19.0 kg•f and decreased when HGS was greater than 19.0 kg•f in males (Supplementary Fig. 1, available online).
Forty-four patients (24.9%) had both SMM/WT of <36.0% and HGS of <19.0 kg•f. Fifty-seven patients (32.2%) had either SMM/WT of <36.0% or HGS of <19.0 kg•f. Overall, 15 patients (8.5%) had SMM/WT of <36.0% and HGS of ≥19.0 kg•f, and 42 (23.7%) had SMM/WT of ≥36.0% and HGS of <19.0 kg•f. As with the cubic spline curves, patients with either SMM/WT of <36.0% or HGS of <19.0 kg•f were at higher risk of IDH by a factor of 4.44 compared with those with both SMM/WT of ≥36.0% and HGS of ≥19.0 kg•f (Table 3). The odds ratio of IDH was 17.11 when the patients had both SMM/WT of <36.0% and HGS of <19.0 kg•f compared with those with both SMM/WT of ≥36.0% and HGS of ≥19.0 kg•f. The odds ratio of IDH in patients with SMM/WT of <36.0% and HGS of ≥19.0 kg•f was 6.83 (p = 0.02) (Supplementary Table 3, available online). In patients with HGS of <19.0 kg•f and SMM/WT of ≥36.0%, the odds ratio was 3.55, although it was not statistically significant (p = 0.07).
We then compared the area under the ROC curve (AUC) to predict IDH in the clinical model (model 8) and clinical-plus-BIA models (Table 4). Model 1, which included HGS and SMM/WT, produced a statistically higher AUC compared with the model that included only clinical parameters (model 8) (AUC of model 1 = 0.877, 95% confidence interval [CI], 0.82–0.93; AUC of model 8 = 0.809, 95% CI, 0.74–0.88; p = 0.008). Model 2, including SMM/WT, also showed a relatively higher AUC (0.843, 95% CI, 0.78–0.91; p of AUC of model 2 compared to model 8 = 0.01). Model 1 explained IDH better than model 8 in some subgroups, such as female patients, patients aged ≥65 years, those with diabetes mellitus, and patients with greater ultrafiltration per weight (Supplementary Table 4, available online).
Discussion
In this study, we evaluated the relationship between development of IDH and measurement of skeletal muscle mass using BIA. A lower percentage of skeletal muscle mass to body weight was associated with a higher rate of IDH. Furthermore, characteristics of sarcopenia such as low skeletal muscle mass and low muscle power were related to IDH, a frequent complication during maintenance hemodialysis.
The volume and movement of body water constitute one of the pathophysiological mechanisms of IDH. It has been suggested that the water content in approximately 10% to 20% of skeletal muscle mass is dynamically mobile [15]. We propose that skeletal muscle mass, as a reservoir of water, can be an important predictor of IDH. A previous study measured relaxation times in patients undergoing hemodialysis by nanoscale magnetic resonance, magnetic resonance imaging (MRI), and BIA [16]. The authors suggested that the amount of water in the muscle, the lower legs in particular, was higher in volume-overloaded patients but decreased after hemodialysis to levels similar to those in the healthy population. In the clinical field, doctors assume that body weight determines the rate of ultrafiltration, which might be higher than the refilling rate. One previous study showed that transcellular shift of body water from extracellular to intracellular fluid by osmotic alteration was higher in patients who experienced IDH compared with the expected amount of ultrafiltration in stable patients [17]. The authors reported that body weights in the two groups were similar, although hydration states differed. This suggests that body composition is more important than body weight in preventing IDH. In the present study, we showed that measurement of the percentage of skeletal muscle mass to body weight could be an applicable indicator of dry body weight. Extracellular water to total body water was also a significant predictor of IDH. However, a previous study showed that over-hydration derived from extracellular fluid measured by BIA was a false-positive factor in malnourished patients [18]. We investigated the role of the IDH predictor not only in extracellular water but also in skeletal muscle mass.
The patients enrolled in this study were mostly elderly and had a lower skeletal muscle mass relative to body weight. According to data from the 2013 ESRD Registry Committee of the Korea Society of Nephrology, the proportion of elderly patients undergoing dialysis in Korea was 39.5% compared to 12.2% in the general population [19]. A 16-year-follow-up epidemiologic study using the Korean National Health Insurance Service database showed that the mean age of patients undergoing hemodialysis increased between 2002 and 2017 [20]. Due to old age, chronic inflammation, and frailty in most patients undergoing maintenance dialysis, sarcopenia (decreased muscle mass) should be considered by nephrologists [21,22]. Although the ratio of patients diagnosed with sarcopenia according to the criteria by the Asian Working Group was low, possible sarcopenia accounted for more than 64% of this cohort. Patients who fulfilled the criteria for possible sarcopenia showed low HGS, and this also explained the risk of IDH after multivariable logistic analysis and comparison of AUCs. In addition to a quantitative approach to skeletal muscle, our study also found that higher HGS was associated with lower odds of IDH. Considering that previous studies emphasized muscle strength as a criterion for diagnosing sarcopenia [23], these results support the importance of the quality of muscles. Patients in the low-SMM/WT group had a higher body mass index and a higher skinfold thickness relative to mid-arm maximal circumference, indicating higher rates of adipose tissue mass and obesity. These are characteristics of sarcopenic obesity [8], which represents a potential public health problem due to clinical consequences. Obesity and sarcopenia are known to have a synergistic and negative impact on performance status among the elderly [24]. Several studies have revealed that low lean tissue index (kg/m2), skeletal muscle mass (kg) per square height (m2), and high-fat tissue index (kg/m2) are risk factors for IDH or mortality [6,25–27]. In that regard, the poor prognosis found in this and previous studies suggest that a higher fat tissue index with a low lean tissue index should be interpreted as poor quality of muscle.
Measurements of body composition have been conducted to find more convenient methods using tools such as MRI, computed tomography, dual-energy X-ray absorptiometry, and BIA [28,29]. Using the dephasing time between the solid and liquid phases, nanoscale nuclear molecular resonance spectrometry has been suggested to qualitatively measure body composition [30]. Due to the convenience and safety of a bedside non-radiocontrast method that correlates closely with conventional methods [31], we used BIA to measure skeletal muscle mass immediately after hemodialysis, when the body weight would be close to “dry body weight,” excluding excessive interstitial body water. In a previous cross-sectional study [32], the phase angle at 50 kHz was positively correlated with the ratio of lean tissue mass to dry body weight, which was similar to the results of our study. As it is derived from the phase angle, extracellular water is related to IDH. The accuracy and utility of extracellular water using BIA are problematic in hemodialysis patients [33,34]. Nevertheless, by measuring different parameters in hemodialysis patients, BIA correlated closely with other characteristics [35]. As the ultrafiltration rate is indicative of IDH [36,37], we adjusted the ultrafiltration rate. Skeletal muscle mass was still an important indicator.
There are some limitations to this study. First, although the Tilburg frailty parameter and subjective global assessment to evaluate sarcopenia [38] did not capture prognostic significance, we suspect that this can be attributed to the limited sensitivity of the clinical questionnaire rather than noninvolvement of any frailty mechanism. We also measured other parameters of sarcopenia, such as a simple handgrip assessment, which functioned as a good predictor of IDH. Second, we defined IDH using an absolute criterion of SBP < 90 mmHg and need for intervention. This might have increased the heterogeneity of the definition of IDH in previous studies, which defined IDH in numerous ways; for example, the National Kidney Foundation Kidney Disease Outcomes Quality initiative defined IDH as a decrease in SBP of ≥20 mmHg and diastolic blood pressure of ≥10 mmHg [39]. We suggest that combining clinical intervention with the definition of IDH could lessen the effect of clinically insignificant changes in blood pressure on the results of our study. Third, as there was a deviation in the results due to the small number of samples and the limited ability to detect minimal differences among samples, further investigation is warranted. We attempted to reduce outcome bias by statistical weighting. Finally, the appropriate measurement time of BIA to accurately measure skeletal muscle mass is uncertain. Previous studies of changes in skeletal muscle mass pre- and post-hemodialysis [40,41] have produced conflicting findings. We expect that further studies will be needed to determine the optimal method of applying skeletal muscle mass in patients undergoing hemodialysis.
In conclusion, low skeletal muscle mass as a fraction of body mass is associated with IDH. For elderly patients with sarcopenia undergoing maintenance hemodialysis, prevention of IDH would be more successful using measurements of body composition by BIA. The application of skeletal muscle mass to prevent IDH in patients undergoing hemodialysis should be investigated in future studies.
 PDF Links
 PubReader
 ePub Link
 Full text via DOI
 Download Citation
 Supplement 1
 Print
Print


")


