


Introduction
Immunoglobulin A nephropathy (IgAN) is the most common primary glomerulonephritis worldwide [1ŌĆō4]. Patients with IgAN have a wide range of clinical features, from benign conditions with persistent microscopic hematuria only to kidney failure [5]. Generally, 20% to 30% of patients eventually require kidney replacement therapy (KRT) within 20 years after diagnosis [1]. The current therapeutic strategies for IgAN mainly focus on reducing proteinuria. All patients are conservatively treated with lifestyle modifications, such as a low-salt and low-protein diet, smoking cessation, and blood pressure (BP) control. Renin-angiotensinogen system blockades (RASB) are recommended if urinary protein excretion exceeds 0.5 g per day [6]. Immunosuppression therapy is reserved for patients with persistent heavy proteinuria and high progression risk after maximal supportive care. Importantly, there is a time gap between disease onset and initiation of disease course-modifying treatment. In this regard, a reliable tool for risk assessment and stratification of IgAN could enable early identification of high-risk patients. This would help physicians prioritize treatment and avoid unnecessary delays.
Numerous studies have identified clinical risk predictors of progression to end-stage kidney disease (ESKD), including estimated glomerular filtration rate (eGFR) at the time of diagnosis, BP, and proteinuria in IgAN [7ŌĆō11]. In addition, the Oxford histologic scoring system can provide useful information for predicting IgAN progression. This system was derived from a multiethnic cohort and has been validated with high reproducibility [12,13]. Thus, establishing a scoring system that incorporates histologic findings with clinical risk factors would be ideal for improving discrimination of high-risk patients. Interestingly, the prevalence and incidence of IgAN are higher in East Asia than in Western countries [14ŌĆō16], and IgAN patients of Pacific Asian origin are more likely to progress to ESKD than are those of other ethnicities [17]. Therefore, the IgAN risk scoring system should consider racial and ethnic variability.
Recently, the International IgA Nephropathy Network developed and externally validated two prediction models, with and without race/ethnicity. These models relied on retrospective, large, international, multiethnic IgAN cohorts with long-term follow-up [18]. Both models included mesangial and endocapillary hypercellularity, segmental glomerulosclerosis, and tubular atrophy/interstitial fibrosis (MEST) scoring of the Oxford classification and clinical parameters of age, mean arterial pressure, eGFR, and proteinuria. The two models showed excellent discrimination and calibration in the original study. Notably, although Chinese and Japanese patients were included in the study, the clinical course of IgAN varied between the two populations, and the model with race/ethnicity used different coefficients for each race. These findings led us to test the clinical performance of the prediction tool in Korean patients. Therefore, the purpose of this study was to externally validate the International IgA Nephropathy Prediction Tool using a large, multicenter, independent cohort from Korea. We also sought to determine a Korean race/ethnicity coefficient for a more accurate prediction.
Methods
Ethics statement
This study was conducted in accordance with the Declaration of Helsinki and approved by the Institutional Review Board of each participating center (Asan Medical Center, No. 2021-0031; Severance Hospital, No. 4-2021-0376; Seoul National University Hospital, H-2103-091-1205; and Seoul National University Bundang Hospital, B-1707-408-106). The requirement for informed consent was waived as the study is a retrospective, observational study with de-identified data.
Study population and clinical data set
This is a retrospective, observational study from four tertiary medical centers in Korea. We identified 2,484 patients with biopsy-proven IgAN from March 2012 to September 2021. Using the electronic health record system (EHRS), we collected all the clinical and pathologic data required to use the International IgA Nephropathy Prediction Tool. Patients were excluded who met the following criteria: 1) missing information for the Oxford classification or eGFR at biopsy or during follow-up, 2) aged <18 years, 3) diagnosed with chronic kidney disease (CKD) G5 requiring KRT at the time of biopsy, and 4) missing information for the International IgA Nephropathy Prediction Tool. Like the original study, we only included patients with one year or more of follow-up care and who developed CKD G5 or eGFR halving from baseline value within 1 year [18]. A total of 2,064 patients was included in the analytic cohort (Supplementary Fig. 1, available online).
Predictors and outcome
Clinical information collected retrospectively from the EHRS comprised demographics, BP, serum creatinine, proteinuria, and use of RASB and immunosuppressants prior to biopsy and during follow-up. Serum creatinine was determined using an isotope dilution mass spectroscopy-traceable method, and eGFR was calculated using the CKD Epidemiology Collaboration equation [19]. Proteinuria was estimated using the spot urine protein-creatinine ratio when 24-hour urinary protein excretion information was missing [20]. Renal biopsies were analyzed by the local pathologists of each participating hospital and scored using the Oxford Classification of IgAN (MEST score) [13]. The pathologists were blinded to the clinical data. The linear predictors for each patient were calculated using predictors at biopsy according to the models with and without race, as previously published (Supplementary Table 1, available online) [18].
The primary outcome was a composite of a persistent decline in eGFR Ōēź 50% from the baseline value or onset of ESKD during the follow-up period. ESKD was defined as initiation of KRT including dialysis, renal transplantation, or eGFR of <15 mL/min/1.73 m2.
Statistical analysis
The performances of the two prediction models were evaluated using measures of model fit, discrimination, reclassification, and calibration. The Royston-Sauerbrei D statistic (R2D) and Akaike information criterion were used to assess model fit [21]. Discrimination was evaluated using C-statistics [22]. We calculated the coefficient of the linear predictor in our cohort data by constructing a linear predictor-only Cox proportional hazard model for the primary outcome to measure discrimination. This estimated coefficient of the linear predictor is known as the ŌĆ£calibration slope,ŌĆØ and the discrimination in the validation dataset is almost the same when the linear predictor slope is approximately 1. If the calibration slope is >1, discrimination is better in the validation data set than in the original data set [23]. Continuous net reclassification improvement (NRI) and integrated discrimination improvement (IDI) for censoring were calculated to measure reclassification [24]. The 95% confidence intervals (95% CIs) for C-statistics, NRI, and IDI were obtained from 100 bootstrap samples. The differences between survival curves were examined using the log-rank test. The annual eGFR decline rate for each risk group was calculated using a linear mixed-effects model. To assess the accuracy of risk estimates from the models, we assessed both the entire follow-up period and time-specific calibration. The mean predicted survival curves within risk groups (categorized as <15th, 15thŌĆō50th, 51stŌĆō85th, and Ōēź86th percentile according to the linear predictor) were compared with the observed survival curves estimated by the Kaplan-Meier method for calibration over the follow-up period. In addition, subjects were grouped into deciles according to the predicted 5-year risk and compared with the observed 5-year risks in the time-specific calibration. The difference in calibration between the predicted and observed risks was visually compared. Additional analyses were performed in sequential steps to derive a Korean coefficient by recalibrating the prediction tool for Korean patients as follows. First, the International IgA Nephropathy Prediction Tool was applied directly to the Korean analytic cohort using the linear predictor with the ŌĆśotherŌĆÖ race/ethnicity coefficient and baseline survival as previously published [18]. Then, by adjusting the linear predictorŌĆÖs race coefficient (the ŌĆśotherŌĆÖ race/ethnicity coefficient), the model with the Korean coefficient was evaluated and tested using the calibration plot and the Kaplan-Meier plot [23]. The model with a new coefficient that precisely predicted the observed kidney outcomes during the follow-up period was visually examined, and the coefficient value of overlap between the predicted curve and the observed risk was determined as the final Korean coefficient. Two-tailed p-values of <0.05 were considered statistically significant. Data were analyzed using STATA version. 16.1 (Stata Corp., College Station, TX, USA), R version. 4.1.0 (R Core Team, Vienna, Austria), and SAS version. 9.4 (SAS Institute, Cary, NC, USA).
The study adhered to the TRIPOD (Transparent Reporting of a Multivariable Prediction Model for Individual Prognosis or Diagnosis) guidelines (Supplementary material, available online) [25].
Results
Study population characteristics
The baseline characteristics of the external validation cohort are shown in Table 1. Among the 2,064 subjects, 353 (17.1%) experienced the primary outcome (Supplementary Fig. 2, available online). The median follow-up duration was 3.8 years (interquartile range, 1.8ŌĆō6.6 years), with 843 subjects (40.8%) undergoing follow-up for 5 years or more. From baseline to year 5, 246 subjects developed the primary outcome, with a corresponding probability of 16.2% (95% CI, 14.3%ŌĆō18.1%).
The Korean cohort was established more recently than the derivation and validation cohorts of the original study (the median years that biopsies were performed were 2014 vs. 2006 and 1998, respectively), with a smaller follow-up period (3.8 years vs. 4.8 and 5.8 years, respectively) [18]. In addition, the mean age at biopsy was higher in the Korean cohort than in the derivation and validation cohorts of the original study (41.3 years vs. 35.6 and 34.8 years, respectively), and the proportion of men was lower (44.8% vs. 57.8% and 49.3%, respectively) [18]. Our cohort had a median proteinuria of 1.0 g/day compared with 1.2 and 1.3 g/day in the two original cohorts and a median eGFR of 87.8 mL/min/1.73 m2 compared with 83.0 and 89.7 mL/min/1.73 m2 [18].
Performance of the International IgA Nephropathy Prediction Tool
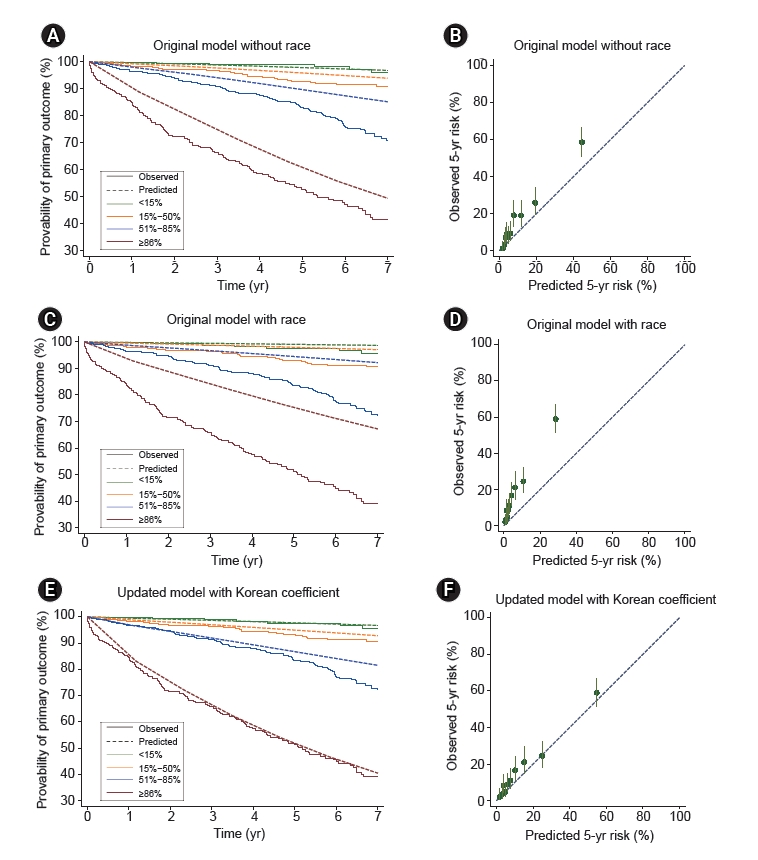
The C-statistics of the model without race and the model with race in the Korean cohort were 0.81 (95% CI, 0.77ŌĆō0.84) and 0.81 (95% CI, 0.78ŌĆō0.85), respectively. The calibration slopes of the linear predictors were 1.08 (95% CI, 0.96ŌĆō1.20) and 1.03 (95% CI, 0.92ŌĆō1.14), respectively, suggesting that discrimination was comparable to that of the original derivation cohort. The risk reclassification for predicting the 5-year primary outcome development risk was slightly improved in the model with race compared to the model without race (NRI, 0.13 [95% CI, 0.08ŌĆō0.29]; IDI, 0.002 [95% CI, 0ŌĆō0.007]) (Table 2). The Kaplan-Meier curves between risk subgroups according to model are shown in Fig. 1. The curves were separated distinctively between the lower-risk groups (low- and intermediate-risk) and the high- and highest-risk groups, suggesting that the model without race had a good discriminatory capability. However, the distinction between the low and intermediate-risk groups was less prominent using this model. When the eGFR decline rates were compared according to risk group using the model, there was a graded decrease in eGFR across the four risk groups, with the steepest decline occurring in the highest risk group (Table 3).
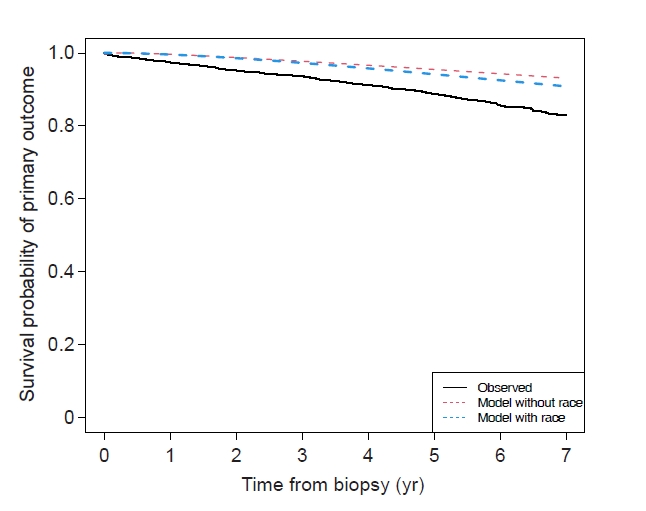
Both baseline survival probabilities from the original study underestimated the risk compared with the survival curve observed in our cohort (Fig. 2). When the predicted risk was visually compared with the observed risk, differences were observed in most of the risk groups, suggesting that both models underestimated risk (Fig. 1A, C). Notably, the model with race underestimated risk irrespective of risk group, although the risk was more highly underestimated in the high and highest risk groups (Fig. 1C). Fig. 1B and D show the observed vs. predicted 5-year risks of the primary outcome according to decile of predicted risk. In the model without race, the observed risk in the lower risk deciles approximated a perfect calibration threshold, suggesting that the model estimated risk relatively well. In the higher deciles, the observed risk was above the perfect calibration threshold, suggesting that the model without race underestimated risk for those in the higher deciles of predicted risk (Fig. 1B). In contrast, the model with race underestimated the 5-year risk of the primary outcome for those in all risk deciles (Fig. 1D).
Updating the prediction tool for Korean patients
Using the updating strategy as described in the statistical analysis section, we found that the Korean race/ethnicity coefficient was 0.5 (Supplementary Table 1, available online). Since we recalibrated the race/ethnicity coefficient only and our cohort included only Korean people, the C-statistics, NRI, and IDI results for predicting the 5-year primary outcome risk were identical in the two models. The predicted and observed primary outcome risks over the follow-up period and the calibration between the predicted and observed risks using the model updated with the Korean race/ethnicity coefficient are shown in Fig. 1E and F, respectively. Of note, the predicted and observed risks were consistent in the updated model, which was better than the results of the two original models using the International IgA Nephropathy Prediction Tool
Discussion
In this study, we assessed the performance of the International IgA Nephropathy Prediction Tool in a multicenter cohort with 2,064 patients from four Korean hospitals. We found that both models of the original study had good discrimination power and comparable risk stratification abilities. However, the models apparently underestimated the risk for progression in Korean patients. Notably, our updated model with the newly-derived Korean race/ethnicity coefficient accurately predicted the risk with good calibration in our cohort.
Before introduction of the International IgA Nephropathy Prediction Tool, several prognostic scoring systems for predicting progression to ESKD or mortality in IgAN patients were available [7,8,26,27]. Nonetheless, these scoring systems included only a single geographic region or race/ethnicity or used clinical and pathological findings without considering race/ethnicity [8,26,27]. In addition, previous scoring systems used a sample size of <1,000 subjects, which is insufficient for model development [7,8]. Moreover, the suggested models have not been well validated in other cohorts. The International IgA Nephropathy Prediction Tool was developed in a multinational cohort including Europe, Asia, and North and South America and externally validated in a distinct dataset with 1,146 IgAN patients. The established models included well-known clinical predictors for progression of IgAN and pathologic findings based on the Oxford classification. In the same study, the validation cohort included more patients with other races/ethnicities, with only 15.5% of the cohort being Caucasian compared with 42% in the derivation cohort, indicating that the models performed well in different ethnic, geographic, and clinical settings [18]. Several external validation studies have also reported that the International IgA Nephropathy Prediction Tool performed well in different cohorts [28ŌĆō30]. Considering this evidence, the recently published Kidney Disease: Improving Global Outcomes (KDIGO) guidelines for glomerular diseases advocate the use of the International IgA Nephropathy Prediction Tool for risk quantification and shared decision-making with patients [6]. Nevertheless, the original prediction models use different race coefficients for Chinese and Japanese patients, although they belong to the same East Asian group. Thus, this tool needs to be further validated in other Asian regions.
In this study, we externally validated two prediction models, with and without race, in a large Korean cohort. Generally, both models performed well for discriminating risk groups among Korean patients. The survival curves were noticeably separated among subgroups categorized according to predicted risk, and a graded decline rate in eGFR was observed as predicted risk increased. The NRI and IDI for the model with race/ethnicity were slightly improved compared to the model without race/ethnicity. Compared to the model with race/ethnicity, the model without race/ethnicity additionally included a predictor ŌĆ£interaction term between RASB use and proteinuriaŌĆØ, which might result in poorer discrimination ability and model fit. These findings indicate that applying the prediction model to newly diagnosed IgAN patients can help guide treatment for high-risk patients and avoid unnecessary treatment for patients at a low risk of disease progression.
Although both prediction models discriminated well between groups, the calibration results clearly showed that the International IgA Nephropathy Prediction Tool underestimated the risk of adverse kidney outcomes in our cohort. Unlike the original cohort comprising 42% Caucasian subjects, our study included a single ethnic population. Interestingly, a study using a racially diverse Canadian cohort from the Toronto Glomerulonephritis Registry showed that IgAN patients of Pacific Asian origin (China, Japan, Philippines, and Vietnam) had a higher risk of ESKD development and a 50% reduction in eGFR compared to those of other origins [17]. The results of this study suggest that race/ethnicity factors should be considered when constructing prediction models. In another validation study exclusively including the Chinese race, the model without race apparently underestimated the primary outcome risk, while the model with race precisely predicted the risk after 3 years [29]. Nevertheless, in our study, even the model considering race substantially underestimated the risk in Korean patients. Better calibration in the Chinese validation study is presumably because this model used the Chinese race/ethnicity coefficient. These findings underscore the need to update prediction models for diverse racial populations.
In our study, we found a Korean race coefficient of 0.50. In agreement with the findings from the original study, the model with race/ethnicity had a slightly better discrimination power than the model without race/ethnicity in our validation study. Therefore, we updated the race coefficient rather than re-estimating the coefficients for the other predictors to improve risk underestimation in the model with race/ethnicity. After the update, the estimated mean survival probability curves were parallel with the observed survival curves according to the risk group. Moreover, underestimation of risk by the original model with race was notably improved in our updated model using the Korean race coefficient. The race coefficients for Chinese and Japanese patients were 0.818 and 0.408, respectively, while that for Korean patients was 0.50, suggesting better-estimated kidney outcomes in Korean IgAN patients than in Chinese patients but worse than in Japanese patients. Not only race but also the national difference in treatment of IgAN might have resulted in the original prediction toolŌĆÖs risk underestimation compared to observed risk. In fact, patients in our cohort were less commonly treated with immunosuppressants at biopsy than were those in the original cohort. In addition, tonsillectomy is more commonly performed in Japan than in other countries [6]. Therefore, using the Chinese coefficient might overestimate the risk, and the Japanese coefficient might underestimate adverse kidney outcomes in Korean IgAN patients. However, since this new model was only internally validated, external validation in other Korean cohorts is warranted.
Some limitations of this study should be noted. First, the retrospective nature of this study might have caused unpredicted confounding factors. We retrospectively collected patient data from the EHRS, and exclusion of patients without clinical or pathologic information might have led to a selection bias. In addition, we could not capture the outcome results for patients lost to follow-up, and some patients might have reached the primary outcome as a result of acute kidney injury. Moreover, the dataset did not have information on detailed treatment after biopsy, and our developed prediction model did not consider immunosuppression treatment after biopsy or the effects of specific immunosuppression agents. This might have resulted in residual confounding factors. Second, interobserver variability in MEST-C scoring can exist among pathologists [31]. In addition, management of IgAN might have differed among the four centers. Although they followed the KDIGO guidelines, immunosuppression was generally used at the physicianŌĆÖs discretion [32]. Nevertheless, the four centers in our study are the largest leading research-oriented hospitals in Korea, with many experienced medical faculty members. Thus, we believe our cohort can best represent the current IgAN patients in terms of diagnostic approach and management across the nation. Third, the burden of disease for the patients in our cohort might have been more severe than that of other IgAN patients in Korea. Presumably, high-risk patients are more likely to be referred to a specialized tertiary care center. Fourth, even though the International IgA Nephropathy Prediction Tool performed well in our cohort, the distinction between low- and intermediate-risk groups was poor. This was also observed in the original multiethnic cohort and in the Chinese validation cohort [18,29]. Thus, further studies are required to develop prediction tools that can stratify risk in the early stages of IgAN.
In conclusion, this study externally validated the International IgA Nephropathy Prediction Tool in a large Korean cohort. Both models had good discrimination, and the model with race had a slightly better risk stratification power. However, the models underestimated the predicted 5-year risk for adverse kidney outcomes. Given the good risk stratifying ability and calibration of our proposed model with a new ethnicity/race coefficient for Korean IgAN patients, we expect that more studies will be conducted to validate the clinical utility of our model.
 PDF Links
 PubReader
 ePub Link
 Full text via DOI
 Download Citation
 Supplement 1
 Print
Print


")


