


Introduction
Sarcopenia, defined as the progressive loss of muscle mass and strength, is significantly associated with frailty, poor quality of life, comorbid diseases such as infections, and early death [1ŌĆō6]. It is common not only in patients on dialysis but also in those with non-dialysis-dependent (NDD) chronic kidney disease (CKD). It is associated with poor physical performance, renal disease progression, and mortality in that population [7ŌĆō11]. A recent study using data from the Korean National Health and Nutrition Examination Survey from 2014 to 2017 revealed that the prevalence of decreased muscle strength was higher in CKD patients than in healthy people, and the decrease in strength correlated significantly with the CKD stage [12]. A low-protein diet, which is one of the treatments for advanced CKD, can increase the risk of muscle loss [13]. Additionally, protein-energy wasting is often present in CKD patients, which increases the risk of various conditions and leads to poorer prognoses [14].
Therefore, the early detection and management of sarcopenia are important; however, periodic screening and evaluation for sarcopenia have not been recommended in patients with NDD-CKD [15], and limited information about risk assessment and stratification is available. Many of the methods commonly used to evaluate muscle mass and strength are difficult to apply in practice. Therefore, if sarcopenia can be predicted from the results of periodic blood tests already performed in patients with CKD, monitoring would be simple, inexpensive, and easy to use in actual clinical practice. In addition, the development of biomarkers for detecting sarcopenia could be useful for identifying high-risk populations. Several candidate biomarkers for sarcopenia have been suggested [16ŌĆō18]. However, because sarcopenia is a heterogeneous condition, its pathophysiology and associated aging-related muscle changes are barriers to the identification of specific biomarkers.
The serum creatinine (sCr) level is a well-known serum biomarker for renal function; it is proportional to the glomerular filtration rate (GFR) but is affected by factors such as fluid status, nutritional status, diet, and muscle mass [19]. In contrast, the serum cystatin C level, another marker of renal function, is not directly affected by muscle mass because it is produced in all nucleated cells; therefore, it reflects GFR more accurately and consistently than sCr in patients with muscle loss [20,21]. We hypothesized that serum cystatin C levels might be higher than sCr levels in patients with sarcopenia. Several studies have demonstrated that the ratio of these two markers can predict the loss of muscle mass and strength, as well as sarcopenia, better than either marker alone [22ŌĆō24].
In this study, we examined whether the serum cystatin C to Cr (serum cystatin C/Cr) ratio or the difference between the serum cystatin C and sCr levels measured in patients with NDD-CKD correlates with decreased muscle mass and strength and sarcopenia; additionally, we evaluated the accuracy of those indicators and their diagnostic precision.
Methods
Study population and design
This retrospective cohort study was conducted with adult patients who visited the outpatient clinic at the Department of Nephrology in Hallym University Sacred Heart Hospital between March 2015 and February 2020. We enrolled patients who visited at least twice at 3-month intervals, met the blood and urine criteria for CKD, underwent body composition monitoring at least once and had renal function tests, including cystatin C, on the same date. In total, 517 patients were included in the study, excluding 408 patients who were already on dialysis (Supplementary Fig. 1, available online). This study was conducted in accordance with the guidelines outlined in the 2013 Declaration of Helsinki and was approved by the Institutional Review Board of Hallym University Sacred Heart Hospital (No. HALLYM 2022-02-017). Body composition monitoring was performed during routine clinical evaluations, and this was a retrospective study using data obtained from treatment processes that had already been completed. Because the personal information of the research subjects was thoroughly protected during the entire research process, including clinical data collection, analysis, and thesis writing, the Institutional Review Board waived the requirement for written informed consent from the study population.
Body composition parameters
Body composition parameters were measured using a portable whole-body bioimpedance spectroscopy (BIS) device (Fresenius Medical Care, Bad Homburg, Germany). In patients suspected to have an accompanying volume depletion or volume overload because of their clinical history or physical examination, body composition parameters were not measured. All participants stood in front of the device and were evaluated with both arms extended to the sides. This instrument displays objective indicators of muscle mass (lean tissue mass), fat mass, and hydration status. The lean tissue index (LTI) and fat tissue index (FTI) were obtained by normalizing the lean tissue mass and fat mass to the body surface area (m2). According to the 2019 Asian Working Group for Sarcopenia (AWGS) guidelines [25], low muscle mass was defined as an LTI of <5.7 kg/m2 for females and <7.0 kg/m2 for males. Handgrip strength (HGS) was measured using a Jamar handheld dynamometer (Jamar Plus; Sammons Preston Inc., Bolingbrook, IL, USA) to evaluate muscle strength. Low muscle strength was defined as an HGS of <18 kg for females and <28 kg for males. Sarcopenia was defined as both low muscle mass (low LTI) and low muscle strength (low HGS), according to the sarcopenia diagnostic criteria of the 2019 AWGS [25]. Because muscle mass alone is not sufficient for a strength evaluation, and muscle biomarkers are more related to muscle mass than muscle strength, we subclassified our subjects into low LTI, low HGS, and low HGS and low LTI (sarcopenia) subgroups for our analyses.
Clinical parameters and assessments
The results of laboratory investigations (blood and urine) performed on the day that patients underwent body composition monitoring were collected from their electronic medical records. The hemoglobin (Hb) concentration in whole blood samples was determined using an ADVIA 2120i hematology system (Siemens Healthcare Diagnostics, Erlangen, Germany). The levels of total cholesterol, total protein, serum albumin, uric acid, blood urea nitrogen, sCr, sodium, potassium, calcium, phosphorus, and total CO2 in the serum samples were measured on a Cobas 8000 c702 Chemistry Analyzer (Roche Diagnostics, Rotkreuz, Switzerland). The urine protein to Cr ratio was calculated using random urine samples. Cystatin C was measured using an automated AU-5800 analyzer (Beckman Coulter, Brea, CA, USA). The estimated GFR (eGFR) was calculated using the CKD-Epidemiology Collaboration (CKD-EPI) formula [26].
Diabetes was defined as a fasting blood glucose level of Ōēź126 mg/dL, glycated Hb of Ōēź6.5%, or the use of an antidiabetic agent. Hypertension was defined as a systolic or diastolic blood pressure of Ōēź140 mmHg or Ōēź90 mmHg, respectively, or the use of antihypertensive agents. Body mass index (BMI, kg/m2) was calculated using the weight and height at the time of body composition measurement and was classified into five groups based on the criteria for the Asian population.
Statistical analyses
Categorical variables, expressed as frequencies and proportions, were compared using the chi-square test or Fisher exact test. The Kolmogorov-Smirnov test was performed to examine the assumption of normality for continuous variables. After the test for normality, non-normally distributed variables, presented as medians with interquartile ranges, were compared using the Kruskal-Wallis or Mann-Whitney U test. Pearson correlation coefficients were calculated to explore the linear relationships between various clinical parameters and the serum cystatin C/Cr ratio or the difference between cystatin C and sCr levels. Patients were categorized into sex-specific quartiles of serum cystatin C/Cr ratio because no normal value for that ratio has been established. The value of the serum cystatin C/Cr ratio or difference between cystatin C and sCr levels for identifying sarcopenia, low LTI, and low HGS was investigated using the area under the receiver operating characteristic curve, cut-off values, sensitivity, specificity, positive predictive value (PPV), negative predictive value (NPV), positive likelihood ratio, negative likelihood ratio, and diagnostic odds ratio (DOR). A simple logistic regression model was used to calculate odds ratios and 95% confidence intervals (CIs) for associations between the serum cystatin C/Cr ratio or difference between cystatin C and sCr levels and sarcopenia, low LTI, and low HGS. Significance was set at p < 0.05, and statistical analyses were performed using IBM SPSS version 20.0 K (IBM Corp., Armonk, NY, USA).
Results
Baseline characteristics and demographics of the participants
Table 1 presents the demographic, clinical, and body composition parameters of the participants categorized according to the sex-specific serum cystatin C/Cr ratio quartiles. Of the 517 participants, 66.2% were male, the median age was 67 years, and diabetes was observed in 45%. At the time of enrollment, the average CKD-EPI eGFR was 40.0 mL/min/1.73 m2, and the incidence of advanced (stage Ōēź 4) CKD was approximately 30% among the study patients. Approximately 28% of patients displayed proteinuria > 1 g/day.
The sex ratio, incidence of diabetes and hypertension, and BMI were comparable in the four groups. However, as the serum cystatin C/Cr ratio increased, age and pulse pressure increased, and Hb and serum albumin levels gradually decreased (Supplementary Table 1, available online). In addition, in the highest cystatin C/Cr ratio quartile group, LTI and HGS were the lowest, and FTI was the highest. When we classified patients according to age, sex, eGFR, and BMI, the cystatin C/Cr ratio was higher in patients with sarcopenia than in those without sarcopenia, except for patients with an eGFR Ōēź 45 or < 60 mL/min/1.73 m2 and a BMI < 23 or Ōēź 30 kg/m2 (Fig. 1).
Correlation analysis of the serum cystatin C to creatinine ratio, clinical and body compositional parameters, and handgrip strength
Sarcopenia was observed in 132 patients (25.5%), and the mean serum cystatin C/Cr ratio was significantly higher in patients with sarcopenia than in those without sarcopenia (1.14 ┬▒ 0.26 vs. 1.01 ┬▒ 0.27, p < 0.001). The serum cystatin C/Cr ratio differed significantly between females and males (0.98 ┬▒ 0.23 vs. 1.18 ┬▒ 0.30, respectively; p < 0.001) and correlated positively with age (╬▓ = 0.359, p < 0.001), FTI (╬▓ = 0.259, p < 0.001) and pulse pressure (╬▓ = 0.091, p = 0.04). It correlated negatively with LTI (╬▓ = ŌłÆ0.450, p < 0.001), HGS (╬▓ = ŌłÆ0.363, p < 0.001), Hb (╬▓ = ŌłÆ0.234, p < 0.001), and the serum albumin level (╬▓ = ŌłÆ0.136, p = 0.002) (Supplementary Fig. 2, available online). The correlation with LTI was higher in males than in females, and neither Hb nor albumin showed any correlation with the serum cystatin C/Cr ratio in females (Supplementary Table 2, available online).
In contrast, the difference between the serum cystatin C and sCr levels had a weak correlation with several indicators and no correlation with the biochemical data. Therefore, we determined that the serum cystatin C/Cr ratio was a potential marker reflecting low LTI and low HGS and performed the following analysis.
Serum cystatin C to creatinine ratio as a potential biomarker for sarcopenia
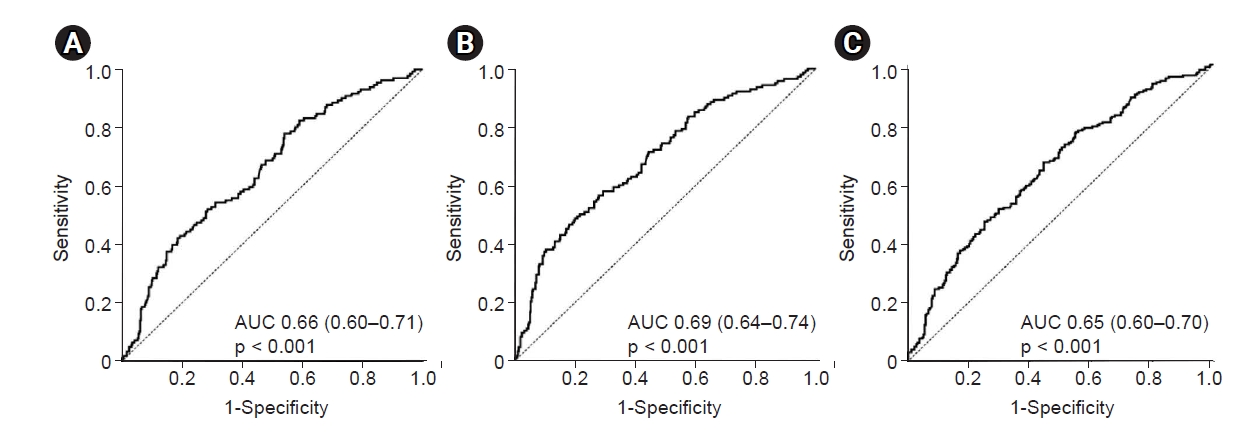
The diagnostic utility of the serum cystatin C/Cr ratio as a biomarker for sarcopenia showed an area under the curve of 65.6% and an accuracy of 59.2% (Table 2, Fig. 2). The optimal cut-off value for predicting sarcopenia was 1.170 in females and 0.977 in males (sensitivity, 59.1%; specificity, 59.2%; NPV, 80.9%; and PPV, 33.2%). LTI was more closely associated with the serum cystatin C/Cr ratio than HGS. In patients with an eGFR of Ōēź45 mL/min/1.73 m2, the serum cystatin C/Cr ratio demonstrated a high NPV in predicting sarcopenia (90.5%) and low LTI (90.4%). In other words, if the serum cystatin C/Cr ratio in patients with eGFR of Ōēź45 mL/min/1.73 m2 was <1.047 or <1.071, it was highly likely that no sarcopenia or low LTI, respectively, was present. In males, the serum cystatin C/Cr ratio demonstrated a relatively higher NPV and DOR in predicting sarcopenia than in females.
The logistic regression analysis for the prevalence of sarcopenia, low LTI, and low HGS is presented in Table 3. As the serum cystatin C/Cr ratio increased by 1, the prevalence risk of sarcopenia, low LTI, and low HGS increased by 4.6-fold (95% CI, 1.7ŌĆō12.7, p = 0.003), 7.2 times (95% CI, 2.6ŌĆō20.2, p < 0.001), and 2.6 times (95% CI, 1.0ŌĆō6.6, p = 0.05), respectively, after adjusting for age, BMI, underlying disease, albumin level, Hb level, and eGFR. However, the correlation was greatest for low LTI. The cystatin C/Cr ratio is thus a marker that better reflects muscle mass than muscle strength.
The risk for the prevalence of sarcopenia increased by approximately 1.8-fold when the cut-off value identified in the diagnostic ability evaluation was Ōēź1.032 (Supplementary Table 3, available online), and the risk for the prevalence of low LTI increased by approximately 2.0-fold when the cut-off value was Ōēź1.037. However, there was no significant correlation with low HGS values.
The participants were classified according to their CKD stage (Supplementary Table 4, available online). The correlation between the serum cystatin C/Cr ratio and sarcopenia or low LTI was strongest in patients with an eGFR of <30 mL/min/1.73 m2.
Discussion
This study demonstrates a correlation between the prevalence of sarcopenia and the serum cystatin C/Cr ratio in patients with NDD-CKD. As the serum cystatin C/Cr ratio increased, the risks of sarcopenia, low LTI, and low HGS increased significantly regardless of age, BMI, diabetes, hypertension, eGFR, albumin, and Hb levels. The serum cystatin C/Cr ratio demonstrated high diagnostic predictive power for sarcopenia or low LTI.
Recently, studies have reported the necessity and clinical usefulness of the sarcopenia index in various diseases. The Cr/cystatin C ratio and that value multiplied by 100 have been analyzed the most [22ŌĆō24,27,28]. Recently, the Cr ├Ś cystatin C-based GFR was suggested as a new index for identifying sarcopenia in patients with various advanced cancers, showing a stronger correlation with HGS and skeletal muscle mass than the Cr/cystatin C ratio [29]. However, those studies included patients with relatively preserved renal function and considered only a small number of patients. Also, in some studies, muscle mass and strength were not measured. Therefore, it is difficult to generalize and apply those findings to kidney disease.
Yanishi et al. [30] reported a positive correlation between the skeletal muscle index and the Cr/cystatin C ratio in kidney transplantation patients, but they excluded patients with an eGFR of <30 mL/min/1.73 m2. A high Cr/cystatin C ratio at the start of continuous renal replacement therapy was associated with a favorable prognosis [31]; however, that study did not include nutritional status scoring and applied the Cr/cystatin C ratio as a marker for muscle mass at a time when it was not in a steady-state, which limits the applicability of their analyses.
A recent analysis of the sarcopenia index in patients with NDD-CKD [32] reported some results that differ from our study results. First, whereas previous studies used a whole-body bioelectrical impedance device (BIA), we measured body composition using a portable whole-body BIS device. BIA is widely used in nutritional evaluations in Korea, and it has the advantage of having general population data; however, its accuracy for determining muscle mass depends on volume status, and insufficient research has assessed its accuracy in patients with CKD. On the other hand, research results using BIS have been reported for patients with CKD, especially dialysis patients [33ŌĆō37]. BIS has the advantage of being non-invasive, rapid, and producing easily repeatable measurements at the bedside, and its usefulness in prescribing dialysis doses or determining the dry weight of dialysis patients has been proven. We have conducted several studies of dialysis patients using BIS measurements [6,38ŌĆō42], and this study was conducted as an extension of those previous reports. To the best of our knowledge, no standard definition of sarcopenia in patients with NDD-CKD or guidelines for treating and monitoring them have yet been established. Because no big data studies have yet been done to establish evidence or a consensus, we conducted a study using BIS that confirmed the clinical significance of sarcopenia in dialysis patients. Of course, those study results alone cannot be generalized, and additional studies are needed to evaluate and validate the diagnostic accuracy of BIS, as well as to compare BIA and BIS.
Second, the criteria for low muscle mass (low LTI) and low muscle strength (low HGS) differed between our study and previous studies, which used the sex-specific lowest 10th percentile of skeletal muscle index within the study population. Here, we defined sarcopenia as a combination of low muscle mass and low muscle strength according to the sarcopenia diagnostic criteria of the 2019 AWGS. The cystatin C/Cr ratio reflects muscle mass better than muscle strength. Muscle strength cannot be evaluated simply by muscle mass; thus, markers that can evaluate and represent both parameters need to be discovered and developed.
Third, this study analyzed twice as many patients as previous studies, and 30% of our patients had advanced CKD. A strength of our study is including patients with all stages of CKD and performing our analyses separately for each CKD stage. Most important, unlike previous studies, we used the cystatin C/Cr ratio. Studies of the sarcopenia index in various disease groups, including patients with NDD-CKD, are being actively conducted; however, none of them are clearly established or suggested as guidelines or consensus findings. Therefore, research on various markers should be performed from a broad perspective. The cystatin C/Cr ratio had a significant correlation coefficient with body composition markers and correlated positively with the risk of low LTI, low HGS, and sarcopenia, with the risk increasing as the ratio increased. Therefore, the cystatin C/Cr ratio has the advantage of allowing clinicians to intuitively evaluate patient status, and it can be easily calculated in actual clinical practice. Of course, it is a limitation that the cystatin C/Cr ratio has a stronger correlation with muscle mass than muscle strength because muscle strength is more important than muscle mass, and physical performance is even more important than muscle strength. Therefore, additional research is needed to develop a simple marker that can reflect and evaluate all those factors. Characteristically, the diagnostic predictive power of this ratio was higher in patients with an eGFR of Ōēź45 mL/min/1.73 m2, probably because the effect of protein intake or eGFR itself was greater in patients with eGFR of <45 mL/min/1.73 m2. To support that supposition, protein intake should be checked and adjusted; the lack of such data is a limitation of this study.
This study also has other limitations. Research conducted on a single ethnic group does not reflect racial differences. In addition, because inflammation can affect cystatin C levels and was not evaluated, its effect cannot be completely excluded. Body fluid retention might have influenced the results of the body composition analysis. However, we tried to exclude patients with volume overload or depletion, and the overhydration index of the study population was not large. We used measurements taken at only one time point, so we could not determine trends and changes in the serum cystatin C/Cr ratio. Because we used cross-sectional data, the correlation between this index and long-term outcomes could not be confirmed.
There is no dispute that combining exercise therapy with adequate protein intake is an effective treatment for improving muscle mass and muscle strength [43ŌĆō48]. However, no concrete and clear criteria or consensus has yet been reached. Importantly, different levels of protein restriction should be applied according to individual patient characteristics and risk factors [49]. If the risk of end-stage renal disease progression is high, protein restriction should be aggressive, and conversely, if the risk of sarcopenia is high, protein restriction should be relaxed [50ŌĆō52]. Therefore, screening patients with NDD-CKD to find those with a high risk of sarcopenia and then managing their risk factors, diet, and exercise together is essential to improving their clinical prognoses. The cystatin C/Cr ratio has an acceptable diagnostic value and measurement significance for sarcopenia, low LTI, and low HGS. Therefore, it can be used to screen and manage sarcopenia and thereby improve the treatment of patients with CKD.

 PDF Links
 PubReader
 ePub Link
 Full text via DOI
 Download Citation
 Supplement 1
 Print
Print


")


