


Introduction
IgA nephropathy (IgAN) is the leading cause of primary chronic glomerular disease in the world [1,2]. A slow progression to end-stage renal disease over two decades has been reported in 30% of patients [3]. Diagnosis is based on presence of mesangial proliferation with dominant or co-dominant IgA deposition [4]. The deposition of circulating immune complex, caused by autoantibodies against galactose-deficient IgA1 (Gd-IgA1), in glomerular mesangium is considered the emerging pathogenesis of IgAN [5]. The deposited immune complex consisting of Gd-IgA1 and antibody (mostly IgG and partly IgA) leads to podocyte activation and injury through mesangial-derived cytokines [6,7].
Proteinuria has been reported to be the most important risk factor for progression of IgAN [8,9]. Approximately 10% of IgAN present with nephrotic syndrome and exhibit poor prognosis in absence of response to treatment [10]. Another study reports presence of extensive foot process effacement (FPE) in patients with IgAN with nephrotic syndrome, similar to minimal change disease [11]. In addition, proteinuria has a positive correlation with severity of FPE in IgAN [12]. However, the relationship of FPE and proteinuria or with other histologic characteristics, like the Oxford classification, has not been examined. Therefore, we evaluated the relationship between FPE, proteinuria, and histologic characteristics, including the Oxford classification.
Methods
Study population
This study was reviewed and approved by the Institutional Review Board of Soonchunhyang University Cheonan Hospital (Cheonan, Korea) (approval number: 2019-08-026-001). Patients who underwent a renal biopsy and were diagnosed with IgAN at Soonchunhyang University Cheonan Hospital (Cheonan, Korea) from January 2011 to December 2018 were evaluated. Adult patients (≥ 18 years) with predominant immunofluorescence (IF) microscopy of IgA (≥ 1+) in the glomerular mesangial area were enrolled. Patients with active cancer, positive serology for hepatitis virus antigens (B and C), acute infection, or history of diabetes ± biopsy confirmed diabetic nephropathy were excluded to rule out secondary causes. Patients without electron microscopy results that showed adequate glomerulus to evaluate severity of FPE were excluded. Patients with subendothelial electron-dense depositions were also removed from this study to exclude the interaction between subendothelial deposition and FPE. This study was conducted in accordance with the principles of the Declaration of Helsinki. Since this was a retrospective study, the requirement of informed consent was waived.
Characteristics of renal pathology
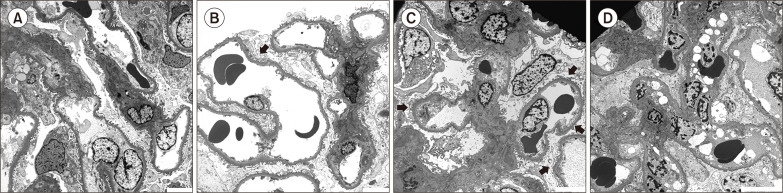
Diagnosis of IgAN was based on light and IF microscopy results by two expert pathologists (J.H. Lee and S.H. Jang). The histologic features were described according to the Oxford classification of mesangial hypercellularity (M, Fig. 1A), endocapillary hypercellularity (E, Fig. 1B), segmental glomerulosclerosis (S), tubular atrophy/interstitial fibrosis (T), and crescents (C) [13,-15]. Severity of FPE was determined based on only extent of FPE, which was established by visual inspection [16] using a semi-quantitative method. When more than 90% of the capillaries exhibited FPE, we defined the severity as ‘diffuse.’ If less than 10% of the capillaries exhibited FPE, it was designated as ‘rare.’ If FPE was observed in more than half (but not exceeding 90%) of the total glomerular capillary length, it was defined as ‘moderate’; if not (i.e., FPE was observed in less than half of the total glomerular capillary length), it was described as ‘mild’ (Fig. 2). The degree of IgA deposition was categorized as 1+, 2+, and ≥ 3+ (representing 3+ and 4+). Co-deposition of complement 3 (C3) was described as negative, trace, 1+, and ≥ 2+ (representing 2+ and 3+) and of IgG as a dichotomous level, negative or positive. Patients with number of globally sclerotic glomeruli (GSG) greater than the upper reference limit (95th percentile) of those expected on biopsy according to age were grouped into GSG abnormal for age [17]. Patients aged > 77 years were regarded to have the same thresholds as the 75 to 77-years group because reference limits were not available for patients aged > 77 years. Patients not assigned to the GSG abnormal group for age were grouped with GSG normal for age.
Covariates
The clinical and demographical characteristics of the patients, including age, sex, body mass index (BMI), history of hypertension, current smoking status, and blood pressure on admission day, were collected by reviewing electronic medical records. The patients’ laboratory data, including complete blood count, serum protein, albumin, blood urea nitrogen, creatinine, uric acid, calcium, and phosphorus, were collected. Based on creatinine level, the estimated glomerular filtration rate (eGFR) was calculated using the Chronic Kidney Disease-Epidemiology Collaboration equation [18]. Twenty-four-hour collected urine protein and urine protein to creatinine ratio were calculated.
Statistical analyses
The patients were categorized into four groups according to severity of FPE: 1) rare, 2) mild, 3) moderate, and 4) diffuse. Categorical variables are presented as count (percentage) and continuous variables as mean ± standard deviation or median (interquartile range) as appropriate. Comparisons between groups were performed using one-way ANOVA for normally distributed continuous variables and the Kruskal-Wallis test for non-normally distributed continuous variables. For categorical variables, Pearson’s chi-square test or Fisher’s exact test was performed. As a trend test, the Jonckheere-Terpstra test was used for continuous variables. For categorical variables, the Cochran-Armitage test was used in the case of 2 × k tables, while the linear-by-linear association test was used in other cases. To estimate the role of covariates in degree of proteinuria, generalized linear models were used. The basic model was created based on clinical information that was classically considered significant, including the Oxford classification. Then, a new model including severity of FPE was built to demonstrate the association between FPE and proteinuria. The impacts of the histologic characteristics on FPE were evaluated using ordinary logistic analysis because the parallelism test for ordinary logistic analysis was satisfied.
Statistical analyses were performed using IBM SPSS Statistics 25.0 for Windows (IBM Corp., Armonk, NY, USA) and R version 3.4.3 (The R Foundation for Statistical Computing, Vienna, Austria).
Results
A total of 805 cases of renal biopsy was performed at Soonchunhyang University Cheonan Hospital (Cheonan, Korea) from January 2011 to December 2018. Among them, 327 patients were diagnosed with IgAN. Overall, 82 patients were excluded from this study with the following causes: 8, inadequate glomerulus in electron microscopy; 22, age < 18 years (range: 10 to 17 years); 7, active cancer (1, cholangiocarcinoma; 1, gastric cancer; 2, gynecologic cancer; 1, thyroid cancer; 1, breast cancer; and 1, hepatocellular carcinoma); 15, hepatitis B antigen positive; 1, hepatitis C antigen positive; 1, suspicion of infection-associated IgAN; and 19, diabetes ± concomitant diabetic nephropathy. To eliminate the interaction between subendothelial deposition and FPE, nine patients with subendothelial deposits were excluded. Finally, a total of 245 patients was analyzed.
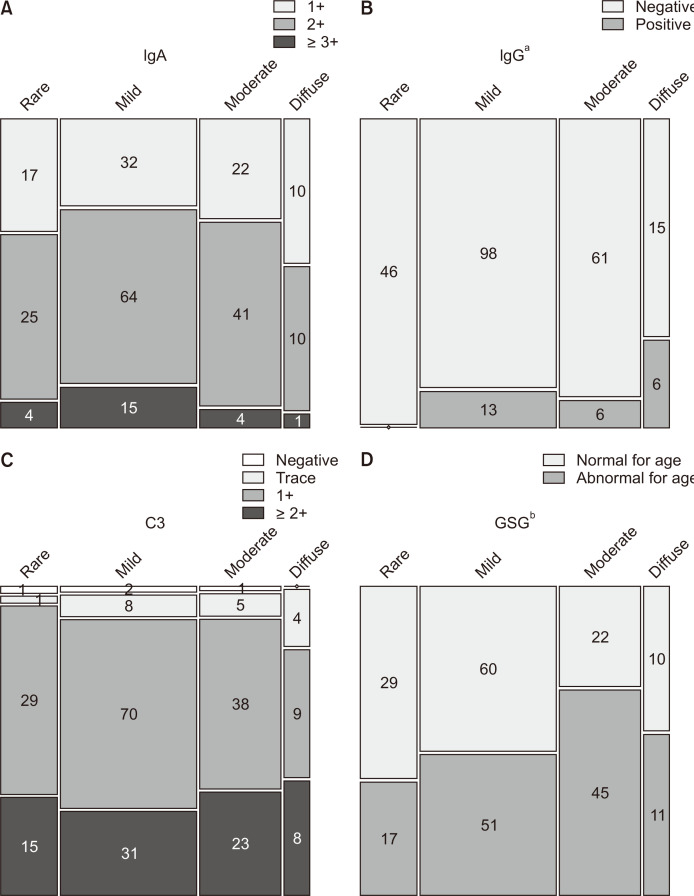
Table 1 shows the clinical characteristics stratified according to severity of FPE. In patients with severe FPE, more urine protein, higher serum uric acid level, and lower serum albumin level were noted. Reduced renal function with higher T score in the Oxford classification was observed in the higher FPE group. Calcium level seemed to be lower in the more severe FPE group. However, there was no difference in corrected calcium level between the groups, implying an effect of serum albumin level. Additionally, the group with severe FPE had a more prevalent M1 score in the Oxford classification, a higher proportion of GSG abnormal for age, and greater deposition of IgG (Table 1, Fig. 3).
We evaluated the possible factors with an impact on degree of proteinuria. All scores of the Oxford classification exhibited a relationship with proteinuria (Fig. 4). Model 1 was built with variables that were classically considered significant, including age, male sex, history of hypertension, current smoking status, BMI, mean arterial pressure, eGFR, uric acid, and the Oxford classification (Table 2). The score of E1 was associated with more severe proteinuria (about 0.5 g/day more than E0). When severity of FPE was added to Model 1 (i.e., Model 2), it exerted an effect on proteinuria independently. Notably, patients with diffuse FPE had more than 1.30 g/day (0.63 to 1.96 g/day) of proteinuria compared to those with rare FPE, suggesting the significant role of FPE in proteinuria in patients with IgAN (Table 2). The histologic characteristics in correlation with severity of FPE were evaluated. As a result, severity of FPE was found to be associated with M1 in the Oxford classification and with deposition of IgG in IF (Table 3).
Discussion
Our results showed that severity of FPE had an impact on degree of proteinuria, and that mesangial proliferation and immune deposits of IgG were associated with severity of FPE. Considering the changes in actin dynamics induced by cytoskeleton rearrangements in podocyte, a connection between FPE and proteinuria was conceivable [19]. Our results suggest that mesangial proliferation and deposition of IgG are linked with FPE of podocytes in IgAN.
In our cohort, all the Oxford classification scores exhibited a statistically significant relationship with proteinuria (Fig. 4). However, there were several discrepancies in the association between the Oxford classification and degree of proteinuria [20,-22]. The discrepancies noted in previous studies may be attributed to severity of FPE.
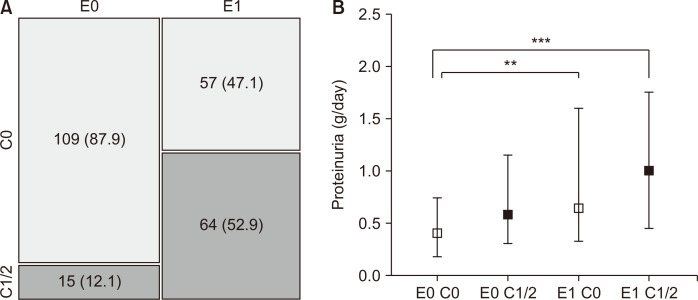
In our final model, E1 in the Oxford classification and severity of FPE were associated with proteinuria (Table 2). Chakera et al [23] reported that E-lesions with no immunosuppressive treatment exhibited prognostic value. E score and degree of proteinuria were significantly related. However, there was no improvement of the goodness of fit when an interaction term between E-score and proteinuria was added [23]. Another study from China reported that crescents were more prevalent with E1 score [24]. Our result was consistent with this previous study. Their subsequent study showed that CD68 infiltrates were associated with E score, suggesting that the pathogenesis of more severe proteinuria in patients with E score was correlated with renal inflammation [25]. They also reported a significant association between E and C scores. In our cohort, a similar relationship between E and C scores was observed (Fig. 5A). Patients with E1 had more proteinuria than those with E0 irrespective of C score (Fig. 5B). Given that formation of crescents represented a nonspecific response to severe injury to the glomerular capillary wall and discontinuities of capillary walls resulting in leakage of inflammatory materials into Bowman’s space [26,27], endocapillary hypercellularity may precede crescent formation.
Deposition of immune complexes composed of Gd-IgA1 and its specific autoantibodies in the mesangial area have a pivotal role in pathogenesis of IgAN [28]. Deposition of immune complexes in the mesangial area leads to proliferation of mesangial cells, thereby affecting other cells in the nephron, i.e., podocytes and tubular epithelial cells [29]. Podocyte injury results in podocyte detachment, podocyte hypertrophy, and FPE [30]. Previous studies have shown that podocytopathy induced by podocyte loss correlated with disease severity in IgAN [31], leading to segmental sclerosis and disease progression [32,33]. Given that mesangial proliferation leads to podocyte injury in IgAN [6,7], it was conceivable that mesangial hypercellularity was associated with severity of FPE, as shown in our results (Table 3).
Additionally, our study showed that patients with positive IgG deposits in IF have greater FPEs (Fig. 3, Table 3). Previous studies have demonstrated that patients with IgG deposition exhibited more detrimental renal outcomes [34,-36]. Since there were several cases in which IgG deposits were not found in IF microscopy, it was considered that IgA autoantibodies specific to Gd-IgA1 were generated [37]. However, in a recent study, Gd-IgA1-specific IgG autoantibodies were found even in patients with negative IgG by IF microscopy [38]. The antigenicity in IF could be masked by sampling errors that could occur during renal biopsy and by the three-dimensional structure of the glomeruli. Nonetheless, if any patient had numerous lesions with co-deposition of IgG in their glomeruli, those with positive IgG could be identified more easily in renal biopsy samples. Therefore, it was reasonable to assume that the more common is IgG deposition the more severe is the disease. Taken together, our results implied that IgG deposition induced podocyte injury and FPE.
Our study had several limitations. First, this was a retrospective study from a single center. Additionally, all patients involved in this study were Korean. Therefore, it may be problematic to apply our results to other races. Second, the severity of FPE was determined by visual inspection in a semi-quantitative fashion. Third, the proportion of IgG deposits in our cohort was smaller (28 cases, 10.4%) compared to previous reports [34,-36]. These results might be affected by a regional determinant of renal biopsies, such as medical insurance or tests for mandatory military service. Nevertheless, another study on deposition of IgG in Korea reported that 31.9% of cases had IgG deposition in the glomerulus [35]. This discrepancy could be a weakness of our study.
In conclusion, our results suggest that severity of FPE had an impact on degree of proteinuria and may be associated with pathogenesis of IgAN.


 PDF Links
 PubReader
 Full text via DOI
 Download Citation
 Print
Print


")


