Kidney Res Clin Pract > Epub ahead of print
Kim, Choi, Hwang, Hwang, Jeong, Cho, Ahn, Kwon, Moon, and Ko: Target blood pressure in Korean hemodialysis patients for optimal survival

Abstract

Background

Hypertension is a major cardiovascular risk factor in hemodialysis patients. This study identified the optimal blood pressure (BP) target for Korean hemodialysis patients using the Korean Renal Dialysis System (KORDS) dataset from the Korean Society of Nephrology and a pooled analysis for previous studies.

Methods

Hemodialysis patients were classified according to their systolic (SBP) and diastolic BP (DBP) at intervals of 20 and 10 mmHg, respectively. As a primary and secondary outcome, all-cause mortality and cardiovascular mortality were evaluated. Subsequently, pooled analysis with previous literatures was performed.

Results

Among 70,607 patients, 13,708 (19.4%) died in 2,426 days (interquartile range, 1,256–4,075 days). Mean SBP and DBP were 143.0 ± 19.6 and 78.5 ± 12.0 mmHg. In multivariable Cox regression, the patients with SBP of <120 and ≥180 mmHg showed 1.10- and 1.12-times increased risk of all-cause mortality compared to SBP of 120–140 mmHg. Meanwhile, DBP showed no significant association. In subgroup analysis, patients aged <70 years and without diabetes had a U-shaped SBP-mortality association. Cardiovascular mortality was increased in SBP of ≥160 mmHg compared to 120–140 mmHg, but it was not in <120 mmHg. Pooled analysis with previous studies mostly showed elevated risk in SBP of <120 mmHg, but the risks in 140–160 and 160–180 mmHg were not consistent.

Conclusion

Extremely lowering BP (<120 mmHg) or uncontrolled hypertension (≥160 mmHg) should be avoided to optimize survival in Korean hemodialysis patients. Detailed analysis for patients with SBP of 120–160 mmHg should be studied further under uniform BP measurement, along with consideration of risk of intradialytic hypotension. Tailored recommendations regarding patient risk factors also should be considered.

Introduction

The mortality risk of maintenance hemodialysis patients remains high worldwide [13]. In Korea, the mortality of hemodialysis patients is estimated as 50.7 per 1,000 patient-years [4], and the leading cause of mortality in hemodialysis is cardiac and cerebrovascular events, which account for more than 50% of deaths; cardiovascular mortality is nine-fold higher in these patients compared with age-matched and sex-matched healthy individuals [5,6].
Hypertension is a common cardiovascular risk factor in patients with end-stage kidney disease (ESKD) [7,8], and is one of the main contributors to high mortality and morbidity among these patients [9,10]. Hypertension in ESKD patients has a complex pathophysiology, including arterial stiffness, volume overload, chronic inflammation, and other factors [11,12]. The complex nature of hypertension in ESKD and the reverse epidemiology of blood pressure (BP) and mortality makes it difficult to determine BP targets in these populations [13].
Clinical practice guidelines suggest a predialysis BP of <140/90 mmHg and a postdialysis BP of <130/80 mmHg [14]. However, the evidence supporting recommendations is weak since most of the data was extrapolated from observational studies or derived from non-ESKD patients [15,16].
The aim of this study is to find the optimal BP targets among hemodialysis patients that correspond to optimal survival using the Korean registry dataset and pooled analysis with previous studies.

Methods

Study cohorts and data collection

Since 1985, the Korean Society of Nephrology (KSN) has been operating a nationwide ESKD patient registration project named Korean Renal Dialysis System (KORDS) and announcing the current status of renal replacement therapy in Korea every year. The registration rate of ESKD patients is about 70%, which is autonomously registered by the KSN members from each medical institution.
We obtained the KORDS database which includes ESKD patients on hemodialysis registered from 2001 to 2020. The KORDS database included various clinical characteristics of patients such as age, sex, body mass index, insurance status, diabetes, and recent history of hospitalization. In addition, dialysis-related characteristics including dialysis vintage, dialysis access types, usage of hemodiafiltration and ultrafiltration rate as well as laboratory findings including hemoglobin, albumin, calcium, phosphorus, and parathyroid hormone were collected. Death and the cause of death can also be found in the database. The epidemiologic characteristics of this database can be found elsewhere [4].
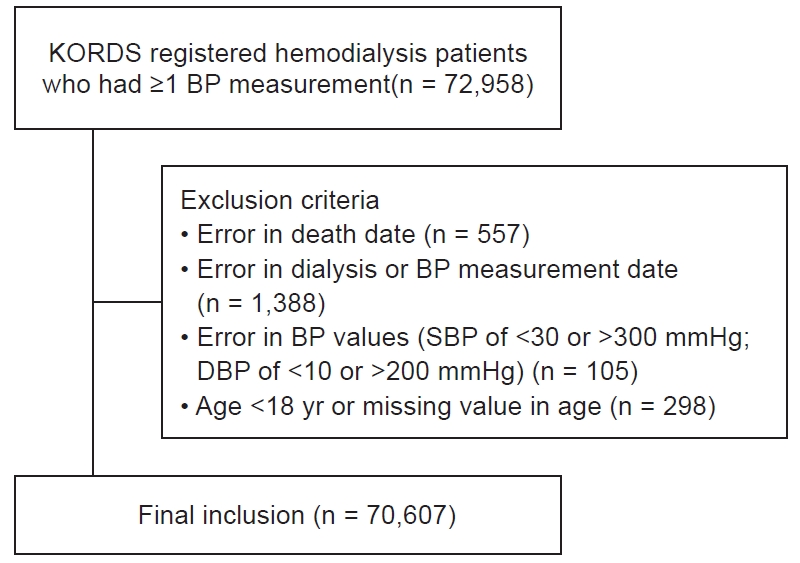
Among the registered participants, patients with at least one BP measurement data were included. Exclusion criteria included an error in the date of death or unknown date of death, missing or error data for dialysis or BP measurement, abnormal BP values (systolic BP [SBP], <30 or >300 mmHg; diastolic BP [DBP]: <10 or >200 mmHg) or age of <18 years.
The study design was approved by the Institutional Review Board of Korea University Guro Hospital (No. 2020GR0190) and complied with the Declaration of Helsinki. Informed consent was waived by the board because of the use of an unidentifiable registry dataset.

Study design and outcome

We classified hemodialysis patients according to BP reported in the KORDS database. SBP and DBP were categorized at 20 and 10 mmHg intervals, respectively. The reference range of SBP and DBP for analyses were 120–139 and 80–89 mmHg, respectively. To be specific, SBP was classified into five categories: <120, 120–139, 140–159, 160–179, and ≥180 mmHg; and DBP was classified into eight categories: <50, 50–59, 60–69, 70–79, 80–89, 90–99, 100–109, and ≥110 mmHg.
The main outcome was all-cause mortality according to BP categories. The secondary outcome was the subgroup analyses for age, diabetes mellitus, and cardiovascular mortality. Cardiovascular mortality was defined as the death caused by heart diseases including coronary heart disease and cardiac arrest, or cerebrovascular disease.
After the analysis using the KORDS dataset, we compared the main outcome with other studies from various countries by pooled analysis.

Literature search and data extraction for pooled analysis

The literature search was performed in accordance with the PRISMA (Preferred Reporting Items for Systematic Reviews and Meta-Analyses) guidelines [17]. We searched PubMed and Embase databases up to 26 September 2020. We included retrospective and prospective cohort studies assessing the associations between peridialysis BP levels and mortality in the maintenance hemodialysis population. The keywords and MeSH terms used were BP, hypertension, renal dialysis, hemodialysis, dialysis, chronic kidney failure, chronic renal insufficiency, and mortality. We limited the search results to original articles published in English. Four researchers (JEK, KHJ, JYM, and HSH) independently screened the titles and abstracts of all publications. Full texts of relevant studies were retrieved and screened for eligibility by two researchers independently. Each eligible study should report adjusted effect size and 95% confidence intervals (CIs) of all-cause mortality for at minimum three BP categories. In addition, because the criteria for BP categories varied widely from study to study, we included only studies of BP divided by 20 mmHg, where most studies were reported. From each eligible study, the following data were extracted: first author, publication year, sample size, total death count, follow-up duration, baseline BP definition, and adjusted hazard ratios estimates with 95% CIs of all-cause mortality for each BP category.

Statistical analysis

Continuous and categorical variables were expressed as mean ± standard deviation and counts (percentage), respectively. Unadjusted and adjusted Cox regression analyses were conducted for the risk of all-cause mortality according to BP categories. Adjusted Cox regression models included age, sex, body mass index, diabetes mellitus, hemodialysis duration, insurance type, blood hemoglobin, serum albumin, serum calcium, parathyroid hormone, ultrafiltration, hemodiafiltration, and vascular access type as covariates. Spline curves were constructed for nonlinear relationship analysis between BP and mortality, with adjustment for the same covariates used in multivariable Cox regression. The violation of the proportional hazards assumption was checked for all regression tests. Competitive risk analysis was performed to evaluate the risk of cardiovascular mortality and other causes of death. For the pooled analysis, hazard ratios and 95% CI were extracted from all studies. Heterogeneity between studies was assessed using both the chi-square test and the I2 statistic. The studies with an I2 of >50% were considered to have substantial heterogeneity, and therefore, a random-effects model analysis was used. Otherwise, a fixed-effect model was employed in the analysis. Publication bias was assessed using a funnel plot. A p-value of <0.05 was considered significant. Statistical analyses were performed using Stata software version 15.1 (StataCorp.), Review Manager version 5.3 (Nordic Cochrane Centre, The Cochrane Collaboration), and R version 4.1.3 (R core team).

Results

Baseline characteristics

In this study, we included 70,607 hemodialysis patients who were registered in KORDS (Fig. 1). The participants’ mean age was 57.9 ± 14.9 years and 59.8% were male. Almost half of the participants, 49.9%, had diabetes mellitus, and 46.8% of the participants had cause of ESKD as diabetes mellitus. The most common type of vascular access was arteriovenous fistula (65.0%) and vascular catheter accounted for 6.4%. The median ultrafiltration of the participants was 2.3 L (interquartile range [IQR], 1.7–2.9 L) per session. Mean SBP and DBP were 143.0 ± 19.6 and 78.5 ± 12.0 mmHg, respectively.
When comparing baseline characteristics by SBP category, increasing SBP was associated with younger age, higher proportion of diabetes, and lower rates of insured patients (Table 1). On the other hand, increasing DBP was associated with younger age, a higher proportion of male sex, a lower proportion of diabetes, and a lower rate of insured patients (Supplementary Table 1, available online).

All-cause mortality according to systolic blood pressure and diastolic blood pressure in hemodialysis patients

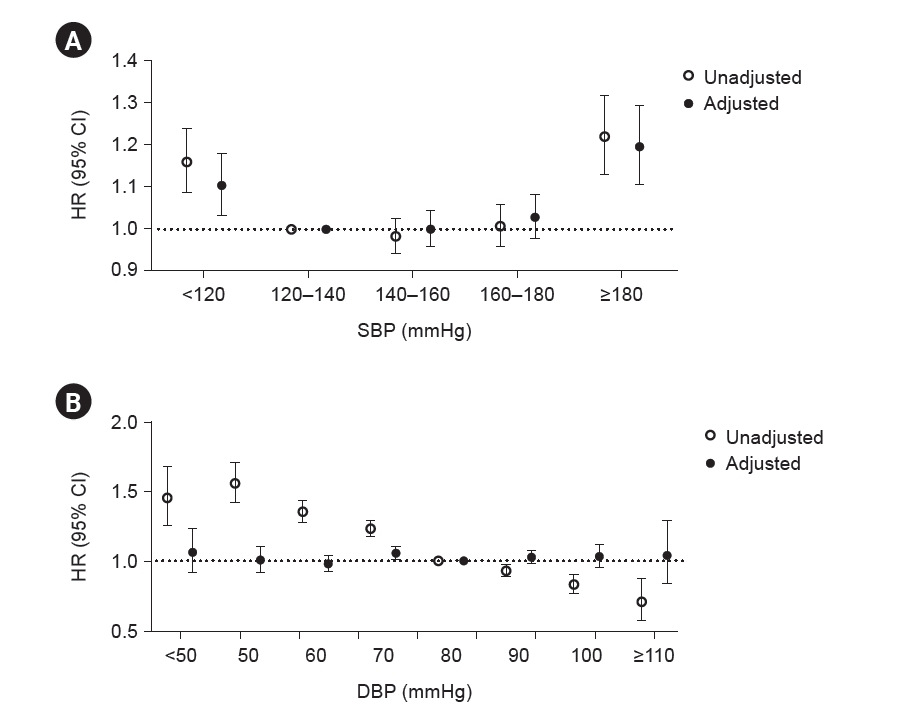
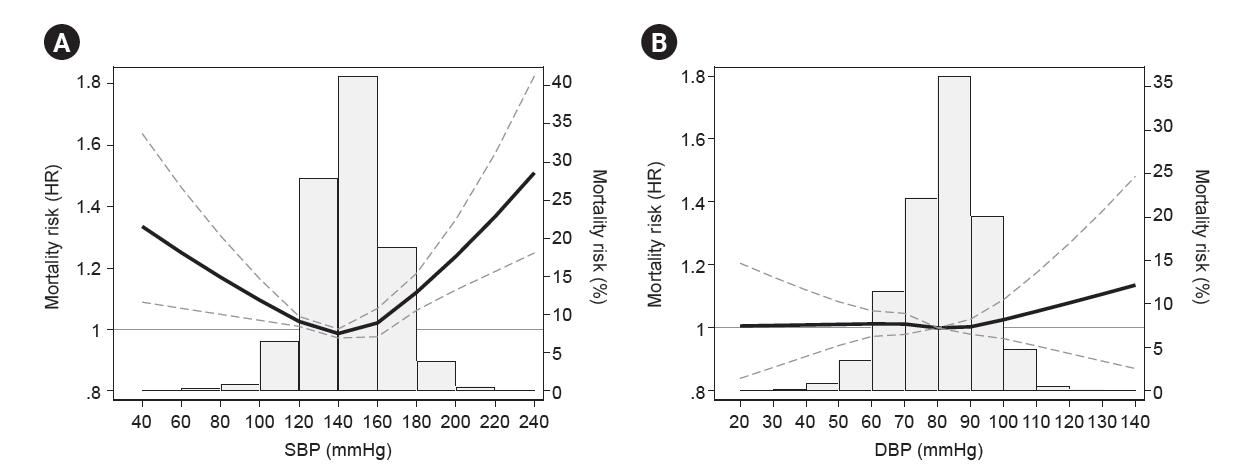
Of the total participants, 13,708 (19.4%) died in the median follow-up duration of 2,426 days (IQR, 1,256.5–4,074 days). Survival curves for each SBP category were expressed as Kaplan-Meier curves in Supplementary Fig. 1 (available online). In univariate Cox regression analysis, the risk of all-cause mortality was not statistically different between SBP of 120 and 180 mmHg, and the risk increased in the range as low as SBP of <120 mmHg or as high as ≥180 mmHg, showing a U-shaped hazard ratio. After multivariable adjustment, the patients with SBP of <120 mmHg and ≥180 mmHg showed 1.1- and 1.2-times mortality risks compared to SBP of 120–140 mmHg, respectively. On the other hand, low DBP seems to be related to increased mortality only in univariate Cox regression, and the association between DBP and mortality diminished after adjusting multiple covariates (Fig. 2). The spline curve in Fig. 3 showed a U-shaped relationship between SBP and all-cause mortality. There was no significant nonlinear relationship between DBP and mortality (Fig. 3).

Subgroup analysis for the association between mortality and systolic blood pressure according to age and diabetes mellitus

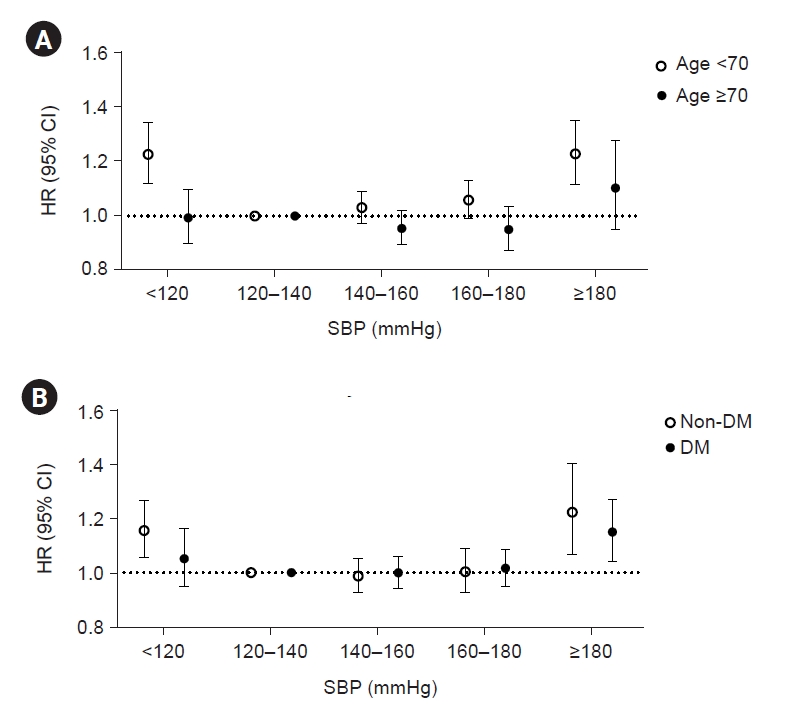
To find the impact of SBP on mortality in a specific population, we conducted the subgroup analysis according to age and history of diabetes. In subgroup analysis for age, a U-shaped association between SBP and mortality was largely restricted to patients under the age of 70 years. The old patients aged over 70 years showed no significant association between SBP and mortality (Fig. 4A). The patients without diabetes showed elevated mortality risk in the lowest and highest SBP categories with a U shape, but the patients with diabetes showed no association between SBP and mortality (Fig. 4B; Supplementary Fig. 2, available online).

Cardiovascular mortality according to systolic blood pressure in hemodialysis patients

In our cohort, cardiovascular death accounted for 44.4% of total mortality, and the median time for cardiovascular death was 1,821 days (IQR, 906–3,216 days). Survival curves for each SBP category were expressed as Kaplan-Meier curves in Supplementary Fig. 3 (available online). Unlike the results for all-cause mortality, survival for cardiovascular events was differently stratified between groups, and cardiovascular mortality increased only in the high SBP categories such as 160–179 and ≥180 mmHg, and not in the low SBP category. A significant elevation of risk for cardiovascular death was started at a relatively lower SBP (160–179 mmHg) compared to the SBP associated with an increased risk for all-cause mortality (≥180 mmHg) (Table 2).

Comparison between the risk analysis for systolic blood pressure and mortality from prior studies and the present results

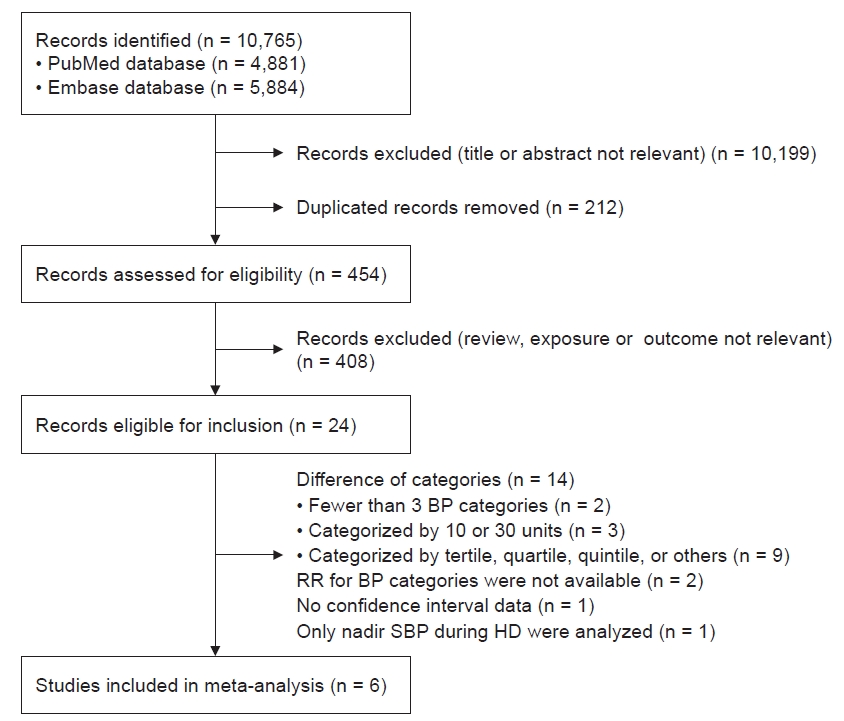
We conducted a pooled analysis for the comparison of the results from the present study and previous studies. With the search term we described in methods, 10,765 studies were initially identified from PubMed and Embase databases. After removing duplicated studies and irrelevant studies screened by title or abstracts, the main text of 454 probable relevant studies were screened by researchers. Accordingly, 24 relevant studies were fully reviewed and only six studies were confirmed to be included in pooled analysis after exclusion (Fig. 5).
Among the six included studies, two of them were prospective cohort analyses and others were retrospective cohort analyses. The studies were published from 2006 to 2014. Five studies were performed in the United States and one study was performed in Japan. We enrolled studies categorized SBP as 20 mmHg, and the lowest and highest margin of categories were SBP of <120 and ≥180 mmHg, with the exception of two studies that differed in the upper limit of the SBP category (Table 3) [1823].
A pooled analysis of all-cause mortality using the six previous studies and the present study was performed using a random-effects model. When the pooled analysis was done with six previous studies only, SBP of <120 mmHg showed an increased risk of mortality compared to SBP of 120–140 mmHg, and higher SBP categories, 140–160 and 160–180 mmHg, seems to have a lower risk of mortality compared to SBP of 120–140 mmHg (Supplementary Fig. 4, available online). However, in the pooled analysis including the present study as well as the previous six studies, the trend in decreased risk of mortality in higher SBPs, 140–160 and 160–180 mmHg, was alleviated. An increase in mortality of SBP of <120 mmHg was consistently found in pooled analyses with or without the present study (Fig. 6).

Discussion

This study found a U-shaped relationship between SBP and all-cause mortality in Korean hemodialysis patients, but no association between DBP and mortality. The patients with low SBP of <120 mmHg or high SBP of ≥180 mmHg had significantly higher mortality compared to patients with SBP of 120–140 mmHg. A U-shaped association was found in the younger age group (<70 years) and diabetic patients, but not in the elderly or nondiabetic patients. The risk for cardiovascular mortality was increased with SBP elevation over 160 mmHg. In addition, we found some similarities and differences between the present study and previous studies on the relationship between SBP and mortality in dialysis patients. Pooled analysis showed that hemodialysis patients with low SBP of <120 mmHg consistently increased risk of mortality across present and previous studies, while the risk of mortality in patients with high SBPs, 140–160 or 160–180 mmHg, seems to be different by studies.
High BP is associated with the progression of left ventricular hypertrophy as well as promotes the development of arterial stiffness resulting from atherosclerosis and vascular calcification, leading to the increased risk of all-cause mortality and cardiovascular events in hemodialysis patients [2432]. In addition, elevated BP may also indicate excessive fluid volume status, which is involved in subsequent mortality and cardiovascular events [3335].
On the other hand, low predialysis BP has been reported to increase the frequency of intradialytic hypotension, cardiovascular events, vascular access thromboses, and mortality in hemodialysis patients [3642]. Repeated intradialytic ischemia leads to myocardial stunning/hibernation and ischemic brain damage, all of which can result from intradialytic hypotension derived from strict BP control, which is also associated with increased risk of mortality and cardiovascular events [39,4345]. Therefore, it is a major issue in the ESKD population to find the optimal BP targets for minimizing cardiovascular complications, which is between left ventricular hypertrophy associated volume overload and intradialytic ischemia.
Several studies, including the present study, have shown a U-shaped relationship between peridialysis BP and mortality, suggesting that extreme level of BP is harmful in hemodialysis patients [46]. According to the present study, we suggest an optimal range of SBP as 120–180 mmHg in Korean patients undergoing hemodialysis to minimize the risk of all-cause mortality. To gain solid evidence of optimal BP range, we conducted pooled analysis and compared the present results and previous ones. Interestingly, we found consistency in low SBPs of <120 mmHg across most studies but not in high SBPs. Among the studies included in a pooled analysis, studies from the United States seem to have high optimal SBPs compared to studies from Japan or Korea (present study). It is not clear that this difference in optimal BP ranges is derived by differences in ethnicity or culture, but there are several evidences that regional difference may related to different incidence and/or prevalence of comorbidities [4749], which may affect the cardiovascular risks combined with hypertension. Therefore, it is reasonable to set the target BP ranges differentially by each region or ethnicity.
In addition, increased mortality risk in low SBP of <120 mmHg was only restricted in relatively low-risk patients with age under 70 years or without diabetes, which was an unexpected result of the present study. Usually, high-risk patients are expected to be very vulnerable to an extreme range of BP. There are possible explanations for this discrepancy. 1) High-risk populations may have other important risk factors rather than peridialysis SBP determining their mortality. 2) High-risk populations may have increased vascular stiffness and impaired control of vascular resistance even in regular BP ranges, resulting similar risk of mortality across BP ranges. The reason for this phenomenon is not completely understood by this study per se. However, we should not ignore the impact of BP in high-risk populations but rather focus on the significant effect of BP even in low-risk dialysis populations.
Unlike all-cause mortality, there seems to be a different optimal range for SBP for the risk of cardiovascular mortality. Cardiovascular mortality is the leading cause of death in hemodialysis patients, and the mortality rate in our study is similar to that of previous studies. The upper threshold of increasing risk for all-cause mortality is SBP ≥ 180 mmHg, whereas cardiovascular mortality begins to increase at the relatively lower threshold of SBP in the range of ≥160 mmHg. There was no change in the risk at lower SBP, suggesting much low SBP levels might be suitable for the specific high-risk population of cardiovascular mortality. In this context, the absence of an increased risk of all-cause mortality in the low SBP group (<120 mmHg) of the diabetes mellitus subgroup, which is the main cause of cardiovascular risk, may be explained.
In 2021, The Kidney Disease: Improving Global Outcomes and the European Society of Cardiology published updated clinical guidelines for BP targets for chronic kidney disease patients [50,51]. However, both clinical guidelines only provide guidelines for chronic kidney disease patients who do not receive dialysis, and BP targets in the dialysis population are not updated recently. As a guideline for BP targets for dialysis patients, The National Kidney Foundation’s Kidney Disease Outcomes Quality Initiative in 2005 suggested predialysis BP of <140/90 mmHg and postdialysis BP of <130/80 mmHg [14], but in the 2015 update, the targets were excluded due to paucity of clinical data [52]. In addition, the European Renal Association-European Dialysis and Transplant Association 2017 guideline does not suggest BP targets due to a lack of research [53]. That is, it should be noted that there is not enough data to define the optimal BP to date. Although our study is not representative of people worldwide, it may provide a basis for Korean clinical practice guidelines suggesting BP targets for dialysis patients. Based on the study results, we recommend that SBP should be maintained between 120 and 160 mmHg to avoid an increased risk of death and cardiovascular death and suggest an SBP of 120–140 mmHg for the best target, especially in patients aged under 70 years.
There are several limitations in this study. First, BP measurements were collected at only the baseline examination. We could not consider the intraindividual variability of BP over time. Also, peridialytic BPs showed poor validity and reproducibility, which can largely interfere with the observed associations with outcomes [53]. Second, the time and method for BP measurement were not clear. This is because there were no specific guidelines for data providers on when and how to record measured BP. Previous studies have shown that the risk of death and cardiovascular events may depend on when and how BP is measured [41,5457]. This is an important limitation of this study based on the KORDS data, and in order to present more accurate BP guidelines for dialysis patients, it will be necessary to collect new BP measurements after controlling the time and method of BP measurement. Third, there was a lack of data for several confounding factors including types of BP medication, echocardiography, and pulse wave velocity which may associated with cardiovascular outcomes. Although we adjusted for factors likely to affect the association between BP and mortality, such as ultrafiltration, albumin, hemoglobin, vascular access type, and several comorbidities, the effects of other unmeasured confounders may have influenced the results. Fourth, intradialysis BP measurements were not available in the KORDS dataset. Though intradialytic hypotension is an important factor associated with cardiovascular events and death, we could not adjust it in this study. Fifth, race proportions in studies included for pooled analysis were not specified for the population of Asians. Studies about race differences and specific guidelines for Korean dialysis patients based on these studies should be warranted in the future.
Our study may serve as important evidence to establish BP targets and make a clinical practice guideline for Korean hemodialysis patients. The proposed optimal BP ranges could help clinicians reduce the risk of mortality in hemodialysis patients by managing the BP of patients properly. Interpretation of this optimal BP range should also take other risk factors of hemodialysis patients into account. Further stratified studies for dialysis patients having various risk factors are warranted to optimize and settle the BP target in the Korean ESKD population.

Notes

Conflicts of interest

All authors have no conflicts of interest to declare.

Funding

All authors acknowledge the support from the Patient-Centered Clinical Research Coordinating Center funded by the Ministry of Health and Welfare, Republic of Korea (H19C0481 and HC19C0041).

Data sharing statement

The data presented in this study are available on request from the corresponding author.

Authors’ contributions

Conceptualization: HSH, KHJ, JYM, GJK

Data curation: JEK, YJC, HSH, KHJ, EC, SYA, YJK, JYM, GJK

Investigation: JEK, YJC, SYH

Funding acquisition: GJK

Supervision: JYM, GJK

Visualization: SYH

Writing – original draft: JEK

Writing – review & editing: JYM, GJK

All authors read and approved the final manuscript.

Figure 1.

Flowchart of patient inclusion.

BP, blood pressure; DBP, diastolic blood pressure; KORDS, Korean Renal Dialysis System; SBP, systolic blood pressure.
j-krcp-22-241f1.jpg
Figure 2.

Mortality risks according to blood pressure categories.

(A) SBP and (B) DBP. Empty dots and solid dots represent the hazard ratio analyzed in univariable and multivariable analyses, respectively. Multivariable Cox regression models included age, sex, body mass index, diabetes mellitus, hemodialysis duration, insurance type, blood hemoglobin, serum albumin, serum calcium, parathyroid hormone, ultrafiltration, hemodiafiltration, and vascular access type as covariates. Error bars represent a 95% confidence interval (CI).
DBP, diastolic blood pressure; HR, hazard ratio; SBP, systolic blood pressure.
j-krcp-22-241f2.jpg
Figure 3.

Spline curve showing the nonlinear relationship between blood pressure and all-cause mortality risk.

Hazard ratios of mortality plotted by (A) systolic blood pressure (SBP) and (B) diastolic blood pressure (DBP) adjusted for age, sex, body mass index, diabetes mellitus, hemodialysis duration, insurance type, blood hemoglobin, serum albumin, serum calcium, parathyroid hormone, ultrafiltration, hemodiafiltration, and vascular access type.
j-krcp-22-241f3.jpg
Figure 4.

Association between SBP and mortality according to age and DM subgroups.

(A) Empty dots and solid dots represent the hazard ratio in age of <70 and >70 years, respectively. (B) Empty dots and solid dots represent the hazard ratio in non-DM and DM patients. Multivariable Cox regression models included age, sex, body mass index, diabetes mellitus, hemodialysis duration, insurance type, blood hemoglobin, serum albumin, serum calcium, parathyroid hormone, ultrafiltration, hemodiafiltration, and vascular access type as covariates. Error bars represent 95% confidence interval (CI).
DBP, diastolic blood pressure; DM, diabetes mellitus; HR, hazard ratio; SBP, systolic blood pressure.
j-krcp-22-241f4.jpg
Figure 5.

Flow diagram of literature search and study selection for pooled analysis.

BP, blood pressure; HD, hemodialysis; RR, relative risk; SBP, systolic blood pressure.
j-krcp-22-241f5.jpg
Figure 6.

Pooled analysis for the association between SBP categories and mortality risk.

Forest plots for (A) SBP of 120–140 mmHg vs. <120 mmHg, (B) SBP of 120–140 mmHg vs. 140–160 mmHg, (C) SBP of 120–140 mmHg vs. 160–180 mmHg, and (D) SBP of 120–140 mmHg vs. ≥180 mmHg were shown, respectively.
CI, confidence interval; df, degree of freedom; SBP, systolic blood pressure.
j-krcp-22-241f6.jpg
Table 1.
Baseline characteristics of study participants across systolic blood pressure (SBP) categories
Variable Total (n = 70,607) SBP (mmHg)
<120 ≥120, <140 ≥140, <160 ≥160, <180 ≥180
No. of patients 70,607 5,391 19,659 29,154 13,274 3,129
Age (yr) 57.9 ± 14.9 59.6 ± 15.9 59.1 ± 15.2 57.8 ± 14.6 56.4 ± 14.3 55.8 ± 14.2
Male sex 42,197 (59.8) 2,691 (49.9) 11,310 (57.5) 18,015 (61.8) 8,339 (62.8) 1,842 (59.9)
Body mass index (kg/m2) 22.2 ± 3.0 22.0 ± 3.0 22.2 ± 3.0 22.2 ± 3.0 22.3 ± 3.0 22.2 ± 3.2
Diabetes mellitus 35,205 (49.9) 1,923 (35.7) 8,502 (43.2) 14,950 (51.3) 7,764 (58.5) 2,066 (66.0)
Insurance status
 Insured 46,521 (65.9) 3,596 (66.7) 13,593 (69.1) 19,304 (66.2) 8,223 (61.9) 1,805 (57.7)
 Aided 14,186 (20.1) 1009 (18.7) 3,618 (18.4) 5,856 (20.1) 2,954 (22.2) 749 (23.9)
 Unknown 9,900 (14.0) 786 (14.6) 2,448 (12.5) 3,994 (13.7) 2,097 (15.8) 575 (18.4)
Hospitalization in recent 1 year 27,558 (39.0) 2,309 (42.8) 7,826 (39.8) 11,172 (38.3) 5,058 (38.1) 1,193 (38.1)
Hemodialysis duration (yr) 2.3 ± 3.6 2.4 ± 4.2 2.2 ± 3.7 2.3 ± 3.6 2.5 ± 3.5 2.4 ± 3.2
Vascular access type
 Arteriovenous fistula 45,898 (65.0) 3,174 (58.9) 13,006 (66.2) 19,384 (66.5) 8,473 (63.8) 1,861 (59.5)
 Arteriovenous graft 7,525 (10.7) 667 (12.4) 2,132 (10.8) 2,982 (10.2) 1,404 (10.6) 340 (10.9%)
 Catheter 4,498 (6.4) 587 (10.9) 1,381 (7.0) 1,634 (5.6) 699 (5.3) 197 (6.3)
 Others 12,686 (18.0) 963 (17.9) 3,140 (16.0) 5,154 (17.7) 2,698 (20.3) 731 (23.4)
Hemodiafiltration 8,014 (11.4) 483 (9.0) 2,066 (10.5) 3,501 (12.0) 1,609 (12.1) 355 (11.3)
Ultrafiltration (L) 2.3 (1.7–2.9) 2.3 (1.2–2.4) 2.3 (1.5–2.6) 2.3 (1.7–3.0) 2.3 (1.9–3.0) 2.3 (2.0–3.3)
Laboratory tests
 Hemoglobin (g/dL) 10.2 ± 1.2 10.0 ± 1.7 10.3 ± 1.2 10.2 ± 1.2 10.2 ± 1.2 10.0 ± 1.3
 Albumin (g/dL) 3.8 ± 0.4 3.7 ± 0.5 3.8 ± 0.4 3.8 ± 0.4 3.8 ± 0.4 3.8 ± 0.4
 Calcium (mg/dL) 8.7 ± 0.8 8.7 ± 0.8 8.7 ± 0.7 8.7 ± 0.8 8.7 ± 0.8 8.7 ± 0.8
 Parathyroid hormone (pg/mL) 209.3 ± 183.1 208.9 ± 188.3 208.1 ± 181.6 207.9 ± 181.1 212.0 ± 183.8 218.9 ± 197.2

Data are expressed as mean ± standard deviation, number (%), or median (interquartile range).

Table 2.
Cardiovascular mortality according to SBP and DBP categories in hemodialysis patients
BP category Univariate
Multivariablea
HR (95% CI) p-value HR (95% CI) p-value
SBP category (mmHg)
 <120 1.02 (0.91–1.15) 0.70 1.01 (0.90–1.13) 0.88
 ≥120, <140 1 (Reference) 1 (Reference)
 ≥140, <160 1.01 (0.94–1.09) 0.74 1.01 (0.94–1.09) 0.74
 ≥160, <180 1.13 (1.04–1.22) 0.004 1.12 (1.03–1.21) 0.008
 ≥180 1.35 (1.19–1.53) < 0.001 1.29 (1.13–1.46) <0.001
DBP category (mmHg)
 <50 1.20 (0.93–1.55) 0.16 0.95 (0.73–1.23) 0.67
 ≥50, <60 1.22 (1.04–1.44) 0.02 0.82 (0.69–0.96) 0.02
 ≥60, <70 1.22 (1.10–1.34) < 0.001 0.90 (0.81–0.99) 0.04
 ≥70, <80 1.17 (1.09–1.26) < 0.001 1.01 (0.94–1.09) 0.73
 ≥80, <90 1 (Reference) 1 (Reference)
 ≥90, <100 0.94 (0.87–1.01) 0.09 1.03 (0.95–1.11) 0.45
 ≥100, <110 0.92 (0.81–1.04) 0.17 1.14 (1.00–1.29) 0.045
 ≥110 0.63 (0.43–0.91) 0.01 1.29 (1.13–1.46) <0.001

BP, blood pressure; CI, confidence interval; DBP, diastolic blood pressure; HR, hazard ratio; SBP, systolic blood pressure.

a Adjusted for age, sex, body mass index, diabetes mellitus, hemodialysis duration, insurance type, blood hemoglobin, serum albumin, serum calcium, parathyroid hormone, ultrafiltration, hemodiafiltration, and vascular access type.

Table 3.
Studies included in the pooled analysis for the association between systolic blood pressure and mortality
Study Year Country Study type Total samples (n) Death (n) Follow-up duration Age (yr) Female sex (%) DM (%) Vintage of dialysis (yr) SBP category
Li et al. [18] 2006 United States Retrospective cohort 69,590 10,414 1 yr 60.9 47.3 50.8 3.4 <120, 120–140, 140–160, 160–180, 180–200, ≥200
Molnar et al. [19] 2010 United States Retrospective cohort 67,085 N/A 5 yr 62 44 47 NA <120, 120–139, 140–159, ≥160
Chang et al. [20] United States Prospective cohort 1,846 871 2.5 yr 57.6 56.2 44.6 2.2 <120, 120–139, 140–159, 160–179, ≥180
Sipahioglu et al. [21] 2012 United States Retrospective cohort 3,446 76 (6 mo), 244 (12 mo) 1.96 yr 62 42 50.5 NA <120, 120–139, 140–159, 160–179, ≥180
Flythe et al. [22] 2013 United States Retrospective cohort 6,393 779 318 days 59.7 46.5 62.4 NA <120, 120–140, 140–160, 160–180, ≥180
Inaba et al. [23] 2014 Japan Prospective cohort 9,134 859 24.2 mo 62 37 34 6.4 <120, 120–139, 140–159, 160–179, ≥180
Kim et al. (current study) 2023 Korea Prospective cohort 70,609 13,708 6.6 yr 57.9 40.2 49.9 2.3 <120, 120–139, 140–159, 160–179, ≥180

DM, diabetes mellitus; NA, not available.

References

1. Robinson BM, Zhang J, Morgenstern H, et al. Worldwide, mortality risk is high soon after initiation of hemodialysis. Kidney Int 2014;85:158–165.
crossref pmid
2. Bradbury BD, Fissell RB, Albert JM, et al. Predictors of early mortality among incident US hemodialysis patients in the Dialysis Outcomes and Practice Patterns Study (DOPPS). Clin J Am Soc Nephrol 2007;2:89–99.
crossref pmid
3. Foley RN, Chen SC, Solid CA, Gilbertson DT, Collins AJ. Early mortality in patients starting dialysis appears to go unregistered. Kidney Int 2014;86:392–398.
crossref pmid
4. Hong YA, Ban TH, Kang CY, et al. Trends in epidemiologic characteristics of end-stage renal disease from 2019 Korean Renal Data System (KORDS). Kidney Res Clin Pract 2021;40:52–61.
crossref pmid pmc pdf
5. Saran R, Li Y, Robinson B, et al. US Renal Data System 2015 Annual Data Report: epidemiology of kidney disease in the United States. Am J Kidney Dis 2016;67(3 Suppl 1):A7–A8.
6. Saran R, Robinson B, Abbott KC, et al. US Renal Data System 2016 Annual Data Report: epidemiology of kidney disease in the United States. Am J Kidney Dis 2017;69:A7–A8.
pmid pmc
7. Parati G, Ochoa JE, Bilo G, et al. Hypertension in chronic kidney disease Part 1: out-of-office blood pressure monitoring: methods, thresholds, and patterns. Hypertension 2016;67:1093–1101.
crossref pmid
8. Bae EH, Lim SY, Kim B, et al. Blood pressure prior to percutaneous coronary intervention is associated with the risk of end-stage renal disease: a nationwide population based-cohort study. Kidney Res Clin Pract 2021;40:432–444.
crossref pmid pmc pdf
9. Aftab RA, Sellappans R, Ming CK, Shaik I. Taking a step further in identifying ideal blood pressure range among hemodialysis patients: a systematic review and a meta-analysis. Front Pharmacol 2020;11:729.
crossref pmid pmc
10. Son HE, Ryu JY, Go S, et al. Association of ambulatory blood pressure monitoring with renal outcome in patients with chronic kidney disease. Kidney Res Clin Pract 2020;39:70–80.
crossref pmid pmc
11. Viazzi F, Cappadona F, Leoncini G, et al. Two-day ABPM-derived indices and mortality in hemodialysis patients. Am J Hypertens 2020;33:165–174.
crossref pmid pdf
12. Shin J, Lee CH. The roles of sodium and volume overload on hypertension in chronic kidney disease. Kidney Res Clin Pract 2021;40:542–554.
crossref pmid pmc pdf
13. Kalantar-Zadeh K, Kilpatrick RD, McAllister CJ, Greenland S, Kopple JD. Reverse epidemiology of hypertension and cardiovascular death in the hemodialysis population: the 58th annual fall conference and scientific sessions. Hypertension 2005;45:811–817.
crossref pmid
14. K/DOQI Workgroup. K/DOQI clinical practice guidelines for cardiovascular disease in dialysis patients. Am J Kidney Dis 2005;45:S1–S153.
crossref
15. Chang TI. Systolic blood pressure and mortality in patients on hemodialysis. Curr Hypertens Rep 2011;13:362–369.
crossref pmid pmc pdf
16. Robinson BM, Tong L, Zhang J, et al. Blood pressure levels and mortality risk among hemodialysis patients in the Dialysis Outcomes and Practice Patterns Study. Kidney Int 2012;82:570–580.
crossref pmid pmc
17. Liberati A, Altman DG, Tetzlaff J, et al. The PRISMA statement for reporting systematic reviews and meta-analyses of studies that evaluate healthcare interventions: explanation and elaboration. BMJ 2009;339:b2700.
crossref pmid pmc
18. Li Z, Lacson E Jr, Lowrie EG, et al. The epidemiology of systolic blood pressure and death risk in hemodialysis patients. Am J Kidney Dis 2006;48:606–615.
crossref pmid
19. Molnar MZ, Lukowsky LR, Streja E, et al. Blood pressure and survival in long-term hemodialysis patients with and without polycystic kidney disease. J Hypertens 2010;28:2475–2484.
crossref pmid pmc
20. Chang TI, Friedman GD, Cheung AK, Greene T, Desai M, Chertow GM. Systolic blood pressure and mortality in prevalent haemodialysis patients in the HEMO study. J Hum Hypertens 2011;25:98–105.
crossref pmid pdf
21. Sipahioglu MH, Usvyat L, Liu L, et al. Early systolic blood pressure changes in incident hemodialysis patients are associated with mortality in the first year. Kidney Blood Press Res 2012;35:663–670.
crossref pmid pdf
22. Flythe JE, Inrig JK, Shafi T, et al. Association of intradialytic blood pressure variability with increased all-cause and cardiovascular mortality in patients treated with long-term hemodialysis. Am J Kidney Dis 2013;61:966–974.
crossref pmid pmc
23. Inaba M, Karaboyas A, Akiba T, et al. Association of blood pressure with all-cause mortality and stroke in Japanese hemodialysis patients: the Japan Dialysis Outcomes and Practice Pattern Study. Hemodial Int 2014;18:607–615.
pmid
24. Harnett JD, Kent GM, Barre PE, Taylor R, Parfrey PS. Risk factors for the development of left ventricular hypertrophy in a prospectively followed cohort of dialysis patients. J Am Soc Nephrol 1994;4:1486–1490.
crossref pmid
25. Patel RK, Oliver S, Mark PB, et al. Determinants of left ventricular mass and hypertrophy in hemodialysis patients assessed by cardiac magnetic resonance imaging. Clin J Am Soc Nephrol 2009;4:1477–1483.
crossref pmid pmc
26. Kitahara T, Ono K, Tsuchida A, et al. Impact of brachial-ankle pulse wave velocity and ankle-brachial blood pressure index on mortality in hemodialysis patients. Am J Kidney Dis 2005;46:688–696.
crossref pmid
27. Blacher J, Guerin AP, Pannier B, Marchais SJ, Safar ME, London GM. Impact of aortic stiffness on survival in end-stage renal disease. Circulation 1999;99:2434–2439.
crossref pmid
28. Blacher J, Guerin AP, Pannier B, Marchais SJ, London GM. Arterial calcifications, arterial stiffness, and cardiovascular risk in end-stage renal disease. Hypertension 2001;38:938–942.
crossref pmid
29. Foley RN, Parfrey PS, Harnett JD, Kent GM, Murray DC, Barre PE. Impact of hypertension on cardiomyopathy, morbidity and mortality in end-stage renal disease. Kidney Int 1996;49:1379–1385.
crossref pmid
30. Silberberg JS, Barre PE, Prichard SS, Sniderman AD. Impact of left ventricular hypertrophy on survival in end-stage renal disease. Kidney Int 1989;36:286–290.
crossref pmid
31. London GM, Pannier B, Guerin AP, et al. Alterations of left ventricular hypertrophy in and survival of patients receiving hemodialysis: follow-up of an interventional study. J Am Soc Nephrol 2001;12:2759–2767.
pmid
32. Zoccali C, Benedetto FA, Mallamaci F, et al. Left ventricular mass monitoring in the follow-up of dialysis patients: prognostic value of left ventricular hypertrophy progression. Kidney Int 2004;65:1492–1498.
crossref pmid
33. Wizemann V, Wabel P, Chamney P, et al. The mortality risk of overhydration in haemodialysis patients. Nephrol Dial Transplant 2009;24:1574–1579.
crossref pmid pmc
34. Zoccali C, Moissl U, Chazot C, et al. Chronic fluid overload and mortality in ESRD. J Am Soc Nephrol 2017;28:2491–2497.
crossref pmid pmc
35. Cabrera C, Brunelli SM, Rosenbaum D, et al. A retrospective, longitudinal study estimating the association between interdialytic weight gain and cardiovascular events and death in hemodialysis patients. BMC Nephrol 2015;16:113.
crossref pmid pmc pdf
36. Daugirdas JT. Measuring intradialytic hypotension to improve quality of care. J Am Soc Nephrol 2015;26:512–514.
crossref pmid
37. Flythe JE, Xue H, Lynch KE, Curhan GC, Brunelli SM. Association of mortality risk with various definitions of intradialytic hypotension. J Am Soc Nephrol 2015;26:724–734.
crossref pmid
38. Sands JJ, Usvyat LA, Sullivan T, et al. Intradialytic hypotension: frequency, sources of variation and correlation with clinical outcome. Hemodial Int 2014;18:415–422.
crossref pmid
39. Stefánsson BV, Brunelli SM, Cabrera C, et al. Intradialytic hypotension and risk of cardiovascular disease. Clin J Am Soc Nephrol 2014;9:2124–2132.
crossref pmid pmc
40. Chang TI, Paik J, Greene T, et al. Intradialytic hypotension and vascular access thrombosis. J Am Soc Nephrol 2011;22:1526–1533.
crossref pmid pmc
41. Port FK, Hulbert-Shearon TE, Wolfe RA, et al. Predialysis blood pressure and mortality risk in a national sample of maintenance hemodialysis patients. Am J Kidney Dis 1999;33:507–517.
crossref pmid
42. Zager PG, Nikolic J, Brown RH, et al. “U” curve association of blood pressure and mortality in hemodialysis patients. Kidney Int 1998;54:561–569.
crossref pmid
43. Shoji T, Tsubakihara Y, Fujii M, Imai E. Hemodialysis-associated hypotension as an independent risk factor for two-year mortality in hemodialysis patients. Kidney Int 2004;66:1212–1220.
crossref pmid
44. Agarwal R. Hypertension and survival in chronic hemodialysis patients: past lessons and future opportunities. Kidney Int 2005;67:1–13.
crossref pmid
45. Burton JO, Jefferies HJ, Selby NM, McIntyre CW. Hemodialysis-induced cardiac injury: determinants and associated outcomes. Clin J Am Soc Nephrol 2009;4:914–920.
pmid pmc
46. Carney EF. Dialysis: U-shaped associations between changes in blood pressure during dialysis and patient survival. Nat Rev Nephrol 2013;9:431.
crossref pmid pdf
47. Chaturvedi N. Ethnic differences in cardiovascular disease. Heart 2003;89:681–686.
crossref pmid pmc
48. Meadows TA, Bhatt DL, Cannon CP, et al. Ethnic differences in cardiovascular risks and mortality in atherothrombotic disease: insights from the Reduction of Atherothrombosis for Continued Health (REACH) registry. Mayo Clin Proc 2011;86:960–967.
crossref pmid pmc
49. Pu J, Hastings KG, Boothroyd D, et al. Geographic variations in cardiovascular disease mortality among Asian American subgroups, 2003-2011. J Am Heart Assoc 2017;6:e005597.
crossref pmid pmc
50. Kidney Disease: Improving Global Outcomes (KDIGO) Blood Pressure Work Group. KDIGO 2021 clinical practice guideline for the management of blood pressure in chronic kidney disease. Kidney Int 2021;99:S1–S87.
crossref pmid
51. Visseren FL, Mach F, Smulders YM, et al. 2021 ESC Guidelines on cardiovascular disease prevention in clinical practice. Eur Heart J 2021;42:3227–3337.
pmid
52. National Kidney Foundation.. KDOQI clinical practice guideline for hemodialysis adequacy: 2015 update. Am J Kidney Dis 2015;66:884–930.
pmid
53. Sarafidis PA, Persu A, Agarwal R, et al. Hypertension in dialysis patients: a consensus document by the European Renal and Cardiovascular Medicine (EURECA-m) working group of the European Renal Association-European Dialysis and Transplant Association (ERA-EDTA) and the Hypertension and the Kidney working group of the European Society of Hypertension (ESH). Nephrol Dial Transplant 2017;32:620–640.
crossref pmid
54. Agarwal R. Blood pressure and mortality among hemodialysis patients. Hypertension 2010;55:762–768.
crossref pmid
55. Hara M, Tanaka S, Taniguchi M, et al. Prognostic value of pre-dialysis blood pressure and risk threshold on clinical outcomes in hemodialysis patients: the Q-Cohort Study. Medicine (Baltimore) 2018;97:e13485.
pmid pmc
56. Tsuruya K, Kanda E, Nomura T, Iseki K, Hirakata H. Postdialysis blood pressure is a better predictor of mortality than predialysis blood pressure in Japanese hemodialysis patients: the Japan Dialysis Outcomes and Practice Patterns Study. Hypertens Res 2020;43:791–797.
crossref pmid pdf
57. Ezzatzadegan Jahromi S, Haghighi G, Roozbeh J, Ebrahimi V. Comparisons between different blood pressure measurement techniques in patients with chronic kidney disease. Kidney Res Clin Pract 2019;38:212–219.
crossref pmid pmc


ABOUT
BROWSE ARTICLES
EDITORIAL POLICY
FOR CONTRIBUTORS
Editorial Office
#301, (Miseung Bldg.) 23, Apgujenog-ro 30-gil, Gangnam-gu, Seoul 06022, Korea
Tel: +82-2-3486-8736    Fax: +82-2-3486-8737    E-mail: registry@ksn.or.kr                

Copyright © 2024 by The Korean Society of Nephrology.

Developed in M2PI

Close layer